- 10-24-16 Originally posted
- 2-11-22 added INFRASTRUCTURE index table Q4 2021
This post is preserved for the multitude of LINKS back to sources of cost indices and for the explanation of the difference between Input indices and Output or Final Cost Indices. For all latest indices plots and table see the latest yearly Inflation post.
2-1-23 SEE Construction Inflation 2023
2-11-22 SEE Construction Inflation 2022
11-10-21 See 2021 Construction Inflation
See the article Construction Inflation 2020
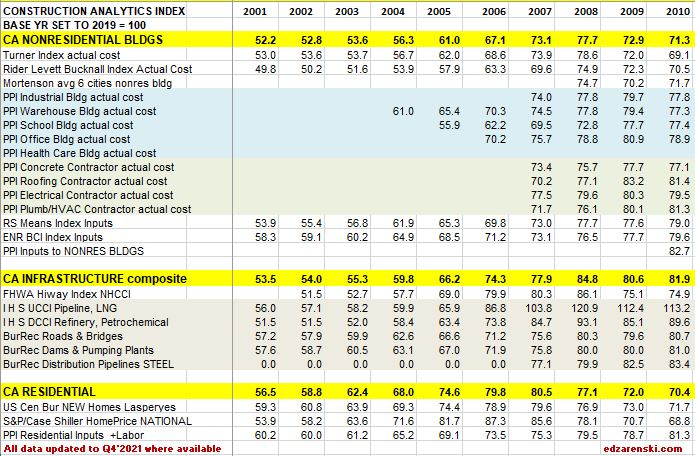
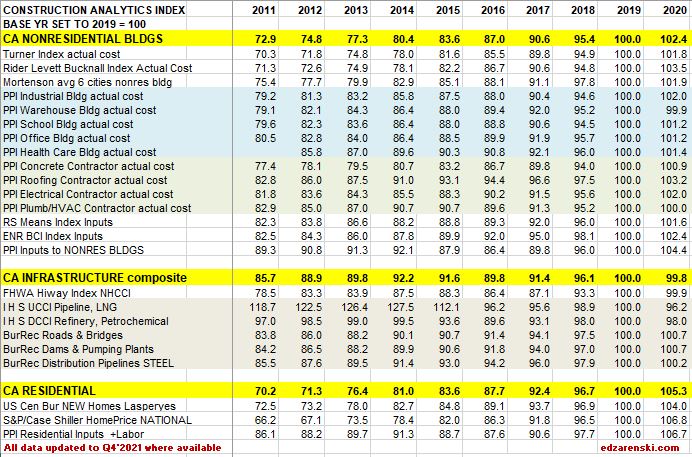
Construction Cost Indices come in many types: Final cost by specific building type; Final cost composite of buildings but still all within one major building sector; Final cost but across several major building sectors (ex., residential and nonresidential buildings); Input prices to subcontractors; Producer prices and Select market basket indices.
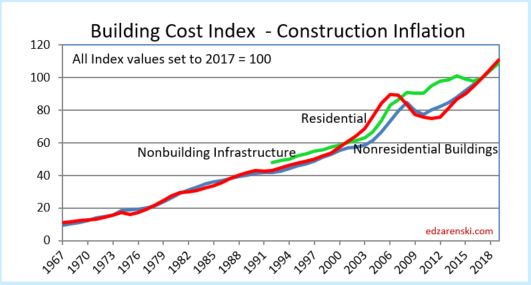
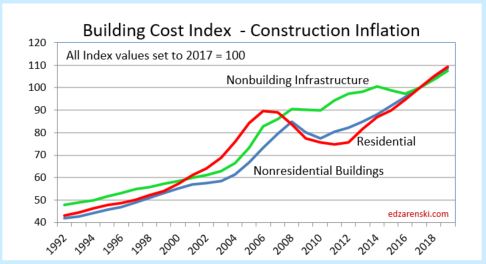
Residential, Nonresidential Buildings and Non-building Infrastructure Indices developed by Construction Analytics, (in highlighted BOLD CAPS in the tables below), are sector specific selling price (final cost) composite indices. These three indices represent whole building final cost and are plotted in Building Cost Index – Construction Inflation, see below, and also plotted in the attached Midyear report link. They represent average or weighted average of what is considered the most representative cost indicators in each major building sector. For Non-building Infrastructure, however, in most instances it is better to use a specific index to the type of work.
The following plots of Construction Analytics Building Cost Index are all the same data. Different time spans are presented for ease of use.
See the article Construction Inflation 2022
All actual index values have been recorded from the source and then converted to current year 2017 = 100. That puts all the indices on the same baseline and measures everything to a recent point in time, Midyear 2017.
All forward forecast values wherever not available are estimated and added by me.
Not all indices cover all years. For instance the PPI nonresidential buildings indices only go back to years 2004-2007, the years in which they were created. In most cases data is updated to include June 2019.
- June 2017 data had significant changes in both PPI data and I H S data.
- December 2017 data had dramatic changes in FHWA HiWay data.
SEE BELOW FOR TABLES
When construction is very actively growing, total construction costs typically increase more rapidly than the net cost of labor and materials. In active markets overhead and profit margins increase in response to increased demand. When construction activity is declining, construction cost increases slow or may even turn to negative, due to reductions in overhead and profit margins, even though labor and material costs may still be increasing.
Selling Price, by definition whole building actual final cost, tracks the final cost of construction, which includes, in addition to costs of labor and materials and sales/use taxes, general contractor and sub-contractor overhead and profit. Selling price indices should be used to adjust project costs over time.
quoted from that article,

R S Means Index and ENR Building Cost Index (BCI) are examples of input indices. They do not measure the output price of the final cost of buildings. They measure the input prices paid by subcontractors for a fixed market basket of labor and materials used in constructing the building. ENR does not differentiate residential from nonresidential, however the index includes a quantity of steel so leans much more towards nonresidential buildings. RS Means is specifically nonresidential buildings only. These indices do not represent final cost so won’t be as accurate as selling price indices. RSMeans Cost Index Page RS Means subscription service provides historical cost indices for about 200 US and 10 Canadian cities. RSMeans 1960-2018 CANADA Keep in mind, neither of these indices include markup for competitive conditions. FYI, the RS Means Building Construction Cost Manual is an excellent resource to compare cost of construction between any two of hundreds of cities using location indices.
Notice in this plot how index growth is much less for ENR and RSMeans than for all other selling price final cost indices.
8-10-19 note: this 2010-2020 plot has been revised to include 2018-2020 update.
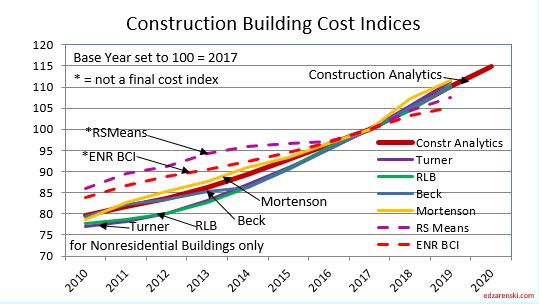
Turner Actual Cost Index nonresidential buildings only, final cost of building
Rider Levett Bucknall Actual Cost Index published in the Quarterly Cost Reports found in RLB Publications for nonresidential buildings only, represents final cost of building, selling price. Report includes cost index for 12 US cities and cost $/SF for various building types in those cities. Boston, Chicago, Denver, Honolulu, Las Vegas, Los Angeles, New York, Phoenix, Portland, San Francisco, Seattle, Washington,DC. Also includes cost index for Calgary and Toronto. RLB also publishes cost information for select cities/countries around the world, accessed through RLB Publications.
Mortenson Cost Index is the estimated cost of a representative nonresidential building priced in seven major cities and average. Chicago, Milwaukee, Seattle, Phoenix, Denver, Portland and Minneapolis/St. Paul.
Beck Biannual Cost Report in 2017 and earlier cost reports developed indices for six major U.S. cities and Mexico, plus average. In the most recent Summer 2021 report, while Beck provides valuable information on cost ranges for 30 different types of projects, the former inflation index is absent. Beck has not published city index values since 2017. Read the report for the trend in building costs. See discussion for Atlanta, Austin, Charlotte, Dallas/Fort Worth, Denver, Tampa and Mexico
Bureau of Labor Statistics Producer Price Index only specific PPI building indices reflect final cost of building. PPI cost of materials is price at producer level. The PPIs that constitute Table 9 measure changes in net selling prices for materials and supplies typically sold to the construction sector. Specific Building PPI Indices are Final Demand or Selling Price indices.
PPI Materials and Supply Inputs to Construction Industries
PPI Nonresidential Building Construction Sector — Contractors
PPI Nonresidential Building Types
PPI Materials Inputs and Final Cost Graphic Plots and Tables in this blog updated 2-10-19
PPI BONS Other Nonresidential Structures includes water and sewer lines and structures; oil and gas pipelines; power and communication lines and structures; highway, street, and bridge construction; and airport runway, dam, dock, tunnel, and flood control construction.
RS MEANS Key material cost updates quarterly
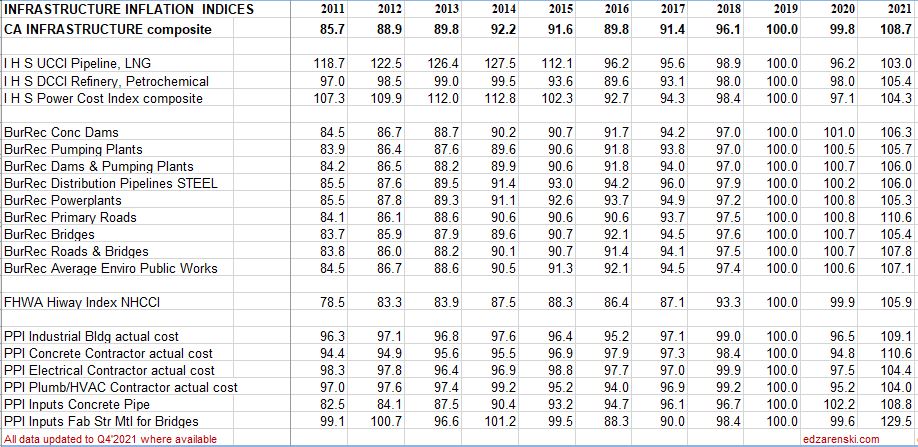
National Highway Construction Cost Index (NHCCI) final cost index, specific to highway and road work only.
The Bureau of Reclamation Construction Cost Trends comprehensive indexes for about 30 different types of infrastructure work including dams, pipelines, transmission lines, tunnels, roads and bridges. 1984 to present.
IHS Power Plant Cost Indices specific infrastructure only, final cost indices
- IHS UCCI tracks construction of onshore, offshore, pipeline and LNG projects
- IHS DCCI tracks construction of refining and petrochemical construction projects
- IHS PCCI tracks construction of coal, gas, wind and nuclear power generation plants
S&P/Case-Shiller National Home Price Index history final cost as-sold index but includes sale of both new and existing homes, so is an indicator of price movement but should not be used solely to adjust cost of new residential construction
US Census Constant Quality (Laspeyres) Price Index SF Houses Under Construction final cost index, this index adjusts to hold the build component quality and size of a new home constant from year to year to give a more accurate comparison of real residential construction cost inflation
TBDconsultants San Francisco Bay Area total bid index (final cost).
Other Indices not included here:
CoreLogic Home Price Index HPI for single-family detached or attached homes monthly 1976-2019. This is a new home and existing home sales price index.
Consumer Price Index (CPI) issued by U.S. Gov. Bureau of Labor Statistics. Monthly data on changes in the prices paid by urban consumers for a representative basket of goods and services, including food, transportation, medical care, apparel, recreation, housing. This index in not related at all to construction and should not be used to adjust construction pricing.
Jones Lang LaSalle Construction Outlook Report National Construction Cost Index is the Engineering News Record Building Cost Index (ENRBCI), a previously discussed inputs index. The report provides some useful commentary.
Sierra West Construction Cost Index is identified as a selling price index with input from 16-20 U.S. cities, however it states, “The Sierra West CCCI plays a major role in planning future construction projects throughout California.” This index may be a composite of several sectors. The link provided points to the description of the index, but not the index itself. No online source of the index could be found, but it is published in Engineering News Record magazine in the quarterly cost report update.
Leland Saylor Cost Index Clear definition of this index could not be found, however detailed input appears to represent buildings and does reference subcontractor pricing. But it could not be determined if this is a selling price index. A review of website info indicates almost all the work is performed in California, so this index may be regional to that area. Updated Index Page
DGS California Construction Cost Index CCCI The California Department of General Services CCCI is developed directly from ENR BCI. The index is the average of the ENR BCI for Los Angeles and San Francisco, so serves neither region accurately. Based on a narrow market basket of goods and limited labor used in construction of nonresidential buildings, and based in part on national average pricing, it is an incomplete inputs index, not a final cost index.
Vermeulens Construction Cost Index can be found here. It is described as a bid price index, which is a selling price index, for Institutional/Commercial/Industrial projects. That would be a nonresidential buildings sector index. No data table is available, but a plot of the VCCI is available on the website. Some interpolation would be required to capture precise annual values from the plot. The site provides good information.
CALTRANS Highway Cost Index Trade bids for various components of work and materials, published by California Dept of Transportation including earthwork, paving and structural concrete. Includes Highway Index back to 1972, quarterly from 2012.
Colorado DOT Construction Cost Index 2002-2019 Trade bids for various components of work published by Colorado Dept of Transportation including earthwork, paving and structural concrete.
Washington State DOT Construction Cost Index CCI for individual components or materials of highway/bridge projects 1990-2016
Minnesota DOT Highway Construction Cost Index for individual components of highway/bridge projects 1987-2016
Iowa DOT Highway Cost Index for individual components of highway/bridge projects 1986-2019
New Hampshire DOT Highway Cost Index 2009-2019 materials price graphs and comparison to Federal Highway Index.
New York Building Congress New York City Construction Costs compared to other US and International cities
U S Army Civil Works Construction Cost Index CWCCIS individual indices for 20 public works type projects from 1980 to 2050. Also includes State indices from 2004-2019
Eurostat Statistics – Construction Cost Indices 2005-2017 for European Countries
Comparative International Cities Costs – This is a comparative cost index comparing the cost to build in 40 world-wide cities If this International Cities Costs is a parity index, which involves correcting for difference in currency, then you must know the parity city in each country, which in the US I think is Chicago.
OECD International Purchasing Power Parity Index
Turner And Townsend International Construction Markets 2016-2017
Turner And Townsend International Construction Markets 2018
Rider Levitt Bucknall Caribbean Report 2018
US Historical Construction Cost Indices 1800s to 1957
Click Here for Link to Construction Cost Inflation – Commentary
2-12-18 – Index update includes revisions to historic Infrastructure data
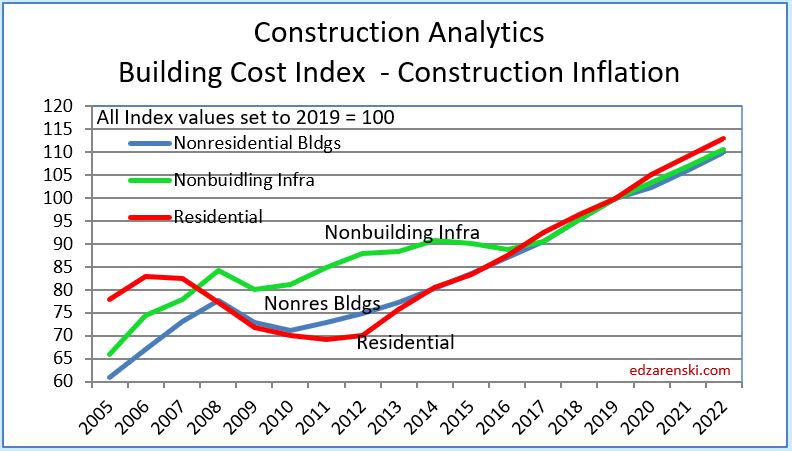
1-26-21 The tables below, from 2011 to 2020 and from 2015 thru 2023, updates 2020 data and provides 2021-2023 forecast.
NOTE, these tables are based on 2019=100. Nonresidential inflation, after hitting 5% in both 2018 and 2019, and after holding above 4% for the six years 2014-2019, is forecast to increase only 2.5% in 2020, but then 3.8% in 2021 and hold near that level the next few years. Forecast residential inflation for the next three years is level at 3.8%. It was only 3.6% for 2019 but averaged 5.5%/yr since 2013 and returned to 5.1% in 2020.
11-10-21 Follow the link at the bottom to 2021 Inflation
The Tables below 2001 to 2010 and 2011-2020 are updated to Q4 2021 with any revisions to past years posted on source websites.
The Table below 2015 to 2023 is updated to Q4 2021

How to use an index: Indexes are used to adjust costs over time for the affects of inflation. To move cost from some point in time to some other point in time, divide Index for year you want to move to by Index for year you want to move cost from. Example : What is cost inflation for a building with a midpoint in 2022, for a similar nonresidential building whose midpoint of construction was 2016? Divide Index for 2022 by index for 2016 = 110.4/87.0 = 1.27. Cost of building with midpoint in 2016 x 1.27 = cost of same building with midpoint in 2022. Costs should be moved from/to midpoint of construction. Indices posted here are at middle of year and can be interpolated between to get any other point in time.
All forward forecast values, whenever not available, are estimated by Construction Analytics.

Yes, but it will take some time to see the impact. Watch the 2021 Inflation article for latest info.
LikeLike
Hi Ed, thank you for Construction Analytics’ Construction Inflation Index Tables and Charts. Are you going to factor into your inflation forecasts the effects of President Joe Biden’s infrastructure bill if the bill becomes law?
LikeLike
I love your write up. Very interesting and informative
LikeLike
This is great data. It would be really nice if you had a link to the Excel or a Google Sheet or something with the data.
LikeLike
[…] The historical cost indices used in this study measure input prices paid by builders for a fixed market basket of labor and materials used in the construction of a number of building types which the producers of R.S. Means deem representative….this study takes the (R.S.Means) historical cost indices at face value….For a variety of alternative sources of construction cost data, see Ed Zarenski’s blog post entitled “Construction Inflation Index Tables”. […]
LikeLike
I replaced the table of values, but I see not difference in the resolution. Just a note, but I can open this table on my phone or tablet and the resolution is excellent, actually better than on my computer. My apologies if the resolution is not working for you. edz
LikeLiked by 1 person
Hi Ed, Thanks a lot. You’re right. It’s readable while opening on the phone. Thank you so much. It works !!!
LikeLike
Hi Ed Zarenski, Thank you so much for these great information. It’s very helpful. However, I had a problem in opening a larger index table. After using the right click as instructed, I still saw the same image as shown on this page. It’s still hard to read. Please advise. Thank you.
LikeLike
Hi, Ed – the resolution on the image of the spreadsheet of indices is too low to make the data legible. Thanks
LikeLike
I’ll see if I can replace the image with one of
greater resolution.
LikeLike