11-2-17
Construction spending had been chugging along very nicely from 2012 through 2016 with annual growth ranging between +6.5% and +11.0%. The average spending growth for those 5 years is 8.5%/yr. For 2017, spending growth will come in at only just over 5%.
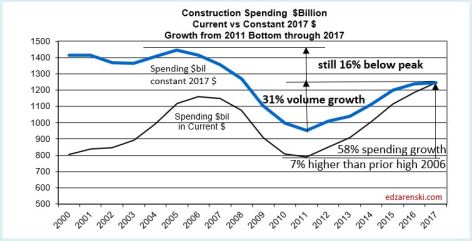
Perhaps what may be more important is the inflation adjusted growth or constant dollar growth. Constant dollar growth measures volume. Volume growth ranged from +3.0% to +8.0% in the 5 years from 2012 through 2016. The average constant$ growth for those 5 years is 5.4%/yr. The rest of the spending growth was inflation dollars. For example: a year in which spending growth is 7% but that has 4% inflation ends up with only 3% constant$ volume growth.
From 2005 peak volume ($1,448 bil in 2017$) to the lows reached in 2011 ($954 bil), constant dollar volume dropped 34%. Since the 2011 low, volume has increased 31%. In rapid growth years volume increases between 6% to 8%/yr. In average or low growth years, constant dollar volume growth ranges closer to 2% to 3%/yr.

2017 will post the highest composite construction inflation in 11 years, 4.5%. Residential inflation has averaged 6%/yr for the last 5 years. With 2017 at 5% construction spending growth, the lowest in six years, and at the highest inflation in years, 2017 volume growth will fall to only +0.6%.
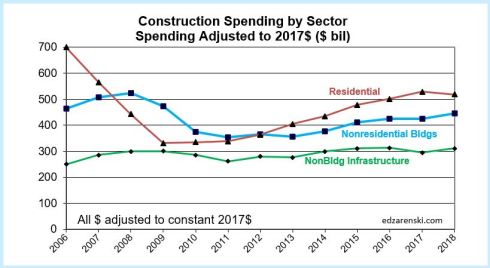
Residential, with nearly 12% spending growth in 2017, still holds onto the best volume growth in 2017 at slightly over 5%. Residential has recorded the highest volume growth in 5 of the last 6 years, the lowest coming in at +5%, averaging 8%/yr for 6 years.
Nonresidential Buildings constant dollars is down slightly for 2017, posting a volume decline of -0.2%. This was predictable since Manufacturing, after recording 90% growth from 2011 to 2015, has worked off a big backlog and dropped 15% (from an all-time high) in the last two years, most of that drop in 2017. For 2017 that drop offset $8 billion of growth from other markets. Nonresidential Buildings volume increased 20% in the previous 3 years.
Non-building Infrastructure volume is down 6% in 2017 after growing only 5% in the previous 2 years. However, the non-building infrastructure sector led all growth in 2014 at +8.5%. It should be noted that 2015 posted the all-time high for Infrastructure spending. The largest declines since then are in Environmental Public Works projects, Sewer/Water/Conservation. All three markets posted declines in new project starts in 3 or 4 of the last 4 years. Spending in 2017 is down 17% from the most recent high in 2015.
Public works spending is responsible for 80% of the dollar decline in non-building infrastructure spending since the high in 2015.
In 2018, Nonresidential Buildings and Non-building Infrastructure lead spending growth. Residential spending will slow considerably after six years of solid growth. Constant$ volume growth after inflation will climb back to +2.3% with the two nonresidential sectors over 5% and residential dropping to a volume decline.

SEE INFLATION TABLES HERE CONSTRUCTION INFLATION
These articles all relate to Constant dollars (Inflation Adjusted)
Constant Dollars – Impact of Inflation
Are We at New Peak Construction Spending?