2-3-18
During the period including 2011 through 2017, we had record construction spending, up 50% in 5 years, moderate inflation reaching as high as 4.6% but averaging 3.8%, record construction volume growth (spending minus inflation), up 30% in 5 years and the the 2nd highest rate of jobs growth ever recorded.
Residential spending was up 90% in 5 years, but real residential volume up only 50%. Residential inflation, at 6%/year, was much higher than all construction. Jobs increased only 33%.
Construction added 1,339,000 jobs in the last 5 years. The only time in history that exceeded jobs growth like that was the period 1993-1999 with the highest 5-year growth ever of 1,483,000 jobs. That same 93-99 period had the previous highest spending and volume growth. 2004-2008 would have reached those lofty highs but the residential recession started in 2006 and by 2008 spending had already dropped 50%, offsetting the highest years of nonresidential growth ever posted.
The point made here is the period 2011-2017 shows spending and jobs at or near record growth. Although 2017 slowed, there is no widespread slowdown in volume or jobs growth.
This 2011-2017 plot of Construction Jobs Growth vs Construction Volume Growth seems to show there is no jobs shortage. In fact it shows jobs are growing slightly faster than volume. But that just does not sit well with survey data from contractors complaining of jobs shortages. So how is that explained?
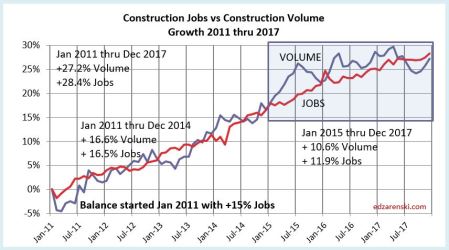
There have been cries from some quarters, including this blog, that the answer lies in declining productivity. There seems to be plenty of workers, but it now takes more workers to do the same job that took fewer in the past. As we will see, that is part of the answer, but doesn’t explain why some contractors need to fill vacant positions. To find data that might answer that question about a jobs shortage we must dig a little deeper.
The total jobs vs volume picture masks what is going on in the three major sectors, Residential, Nonresidential Buildings and Non-Building Infrastructure. A breakout of jobs and volume growth by sector helps identify the imbalances and helps explain construction worker shortages. It shows the residential sector at a jobs deficit.
7 years 2011-2017 – % Jobs growth vs % Volume growth
- Totals All Construction Jobs +31%, Volume +30%
- Nonres Bldgs Jobs +27%, Volume +19%
- Nonbldg Hvy Engr Jobs +21%, Volume +12%
- Residential Jobs +40%, Volume +54%
The totals show jobs and volume almost equal, data that supports the 2011-2017 totals plot above and what we would expect in a balanced market. But severe imbalances show up by sector. Both nonresidential sectors show jobs growth far outpaced volume growth. Residential stands out with a huge deficit, with jobs way below volume growth.
Just looking at 2017 growth shows the most recent imbalances.
2017 % jobs growth vs % volume growth
- Totals All Construction Jobs +3.4% Volume -0.8%
- Nonres Bldgs Jobs +3.3% Volume -1.6%
- Nonbldg Hvy Engr Jobs +1.7% Volume -6.0%
- Residential Jobs +3.5% Volume +4.2%
Census recently released initial construction spending for 2017, totaling $1.230 trillion, up only 3.8% from 2016. What is somewhat disconcerting is that 2017 construction spending initial reports growth of 3.8% do not even match the total inflation growth of 4.6% for 2017, indicating a -0.8% volume decline. However, as does always occur, I’m expecting upward revisions (estimated +2%) to 2017$ construction spending on 7-1-18. If we don’t get an upward revision, then 2017 will go down as the largest productivity decline since recession. Even if we do get +2% upward revision to 2017$ spending, 2017 volume would be revised up to +1.2% and jobs growth will still exceed volume growth.
Let’s look a little deeper at the data within the sectors. Each chart is set to zero at Jan 2011 so we can see the change from that point, the low point of the recession, until today. At the bottom of each chart is shown a Balance at start. That represents the cumulative surplus or deficit of jobs growth compared to volume growth for the previous 10 years prior to Jan 2011. If there are no changes in productivity, or no surplus or deficit to counteract, then jobs should grow at the same pace as volume.
There are slight differences between the data in the three sector charts and the total construction chart. The sector charts use annual avg data and the totals chart uses actual monthly data.
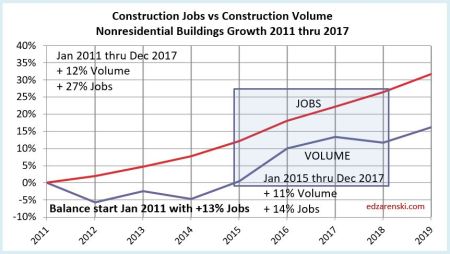

Nonresidential Buildings and Non-building Infrastructure, over seven years and the most recent three years, show jobs increasing far more rapidly than volume. Nonresidential Buildings started 2011 with a surplus of jobs after the recession, but Infrastructure started 2011 with a substantial deficit of jobs. Only in this last year did Infrastructure jobs reach long-term balance with work volume.
Nonresidential Buildings started 2011 with a 13% surplus of jobs and more than doubled it in the seven years following. I’ve suggested before it could be that a part of this surplus is due to companies hiring to meet revenue growth, and not inflation adjusted volume. Although nonresidential spending actually increased 43%, volume since 2010 has increased only 12%. Since 2010 there has been 30% nonresidential buildings inflation, which adds zero to volume growth and zero need for new jobs. A 43% increase in spending could lead companies to erroneously act to staff up to meet spending, or revenue, more than needed for the 12% volume increase.
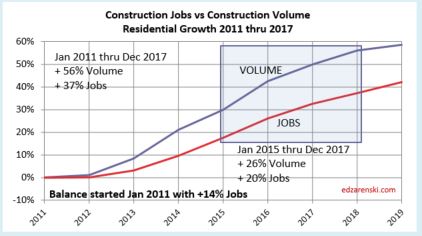
This plot for residential work shows from 2011 to the end of 2017, we’ve experienced a 20% growth deficit in jobs. How many residential jobs does this 20% growth deficit represent? From Jan 2011 through Dec 2017, residential jobs increased from approximately 2,000,000 to 2,700,000. So the base on which the % growth increased over that time is calculated on 2,000,000. An additional 20% growth would be a maximum of 400,000 more jobs needed to offset the seven year deficit. But what about the imbalances that existed when we started the period?
During the residential recession from just 2005 through 2010, residential volume declined by 55%, but jobs were reduced by only 38%. For the entire period 2001-2010, total volume of work declined by 14% more than jobs were reduced. Some of the surplus jobs get absorbed into workforce productivity losses and some remain available to increase workload. It’s impossible to tell how much of that labor force would be available to absorb future work, so for purposes of this analysis an estimate of at least 5% seems not unreasonable. That would mean for 2011-2017, instead of a need for an additional 20% more jobs, the need could be reduced by 5% or 100,000 jobs.
This analysis shows a current deficit of 300,000 to 400,000 residential construction jobs. While it does also show nonresidential buildings jobs far exceed the workload and there are more than enough surplus jobs to offset the residential deficit, there would be several questions of how transferable jobs might be between sectors.
- Are there highly technical specialty jobs in Nonresidential Buildings that would not be transferable to Residential?
- What is the incidence of specialty workers engaging in work across sectors? i.e., job is counted in one sector but working in another sector.
- What has been the impact of losing immigrants from the construction workforce?
- Is the ratio of immigrant workers in Residential much higher than Nonresidential?
- Is the pay more attractive in Nonresidential construction?
- What, if any, percentage of the Residential workforce is not being counted? Day labor?
One thing is known for certain, high-rise multifamily residential buildings may often be built by a firm that is classified primarily as a nonresidential commercial builder. Therefore, some jobs that are counted as nonresidential are really residential jobs.
I think most of these would have a more negative impact on Residential jobs. However, there is some possibility that the overall deficit may not be quite as high as available data show (points 2 and 6). And there is always the possibility that we’ve crossed a threshold that has led to new gains in productivity, although to some extent, the stark differences between Residential and Nonresidential Buildings data might counter that proposition.
These two following report references both document that there is a large unaccounted for shadow workforce in construction. This workforce is probably mostly residential.
NAHB’s HousingEconomics.com “Immigrant Workers in the Construction Labor Force”
and these more recent reports adds volumes of data on immigrant labor
NAHB’s Jan 2018 Report on Immigrant Labor in Construction
Pew – U.S. Unauthorized Immigrant Total Dips to Lowest Level in a Decade NOV 2018
Unemployment and productivity includes only jobs counted in the official U.S. Census Bureau of Labor Statistics (BLS) jobs report. Both these reports document a large, unaccounted for shadow workforce in construction. By some accounts, 40% or more of the construction workforce in California and Texas are immigrant workers. Immigrants may comprise between 14% and 22% of the total construction workforce. It is not clear how many within that total may or may not be included in the U.S. Census BLS jobs report. However, the totals are significant enough that they would alter some of the results commonly reported.
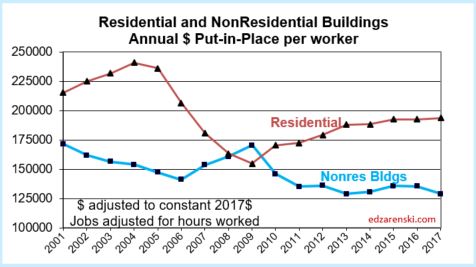
The best way to see the implications that the available data do show is to look at productivity. The simplest presentation of productivity measures the total volume of work completed divided by the number of workers needed to put the volume of work in place, or $Put-in-Place per worker. In this case, $ spending is adjusted for inflation to get a measure of constant $ volume, and jobs are adjusted for hours worked.
As the Residential jobs deficit increases vs workload, this plot shows that $PIP is increasing. That makes sense. The workload continues to increase and the jobs growth is lagging, so the $PIP per worker goes up. For Nonresidential Buildings, the rate of hiring is exceeding the rate of new volume and therefore the $PIP is declining.
In boom times, residential construction adds between 150,000 and 170,000 jobs per year and has only twice since 1993 added 200,000 jobs per year. In the most recent several years expansion, residential has reached a high of 156,000 jobs in one year but has averaged 130,000 per year over 5 years. So it’s pretty unlikely that we are about to start adding residential construction jobs at a continuous rate of 200,000+ jobs per year.
If residential jobs growth were to increase by 50,000 jobs per year over and above current average growth, it would take 6 to 8 years to wipe out the jobs deficit in residential construction.
This problem is not going away anytime soon.
For more history on jobs growth see Is There a Construction Jobs Shortage?
For more on the imbalances of Res and Nonres jobs see A Harder Pill To Swallow!
For some hypotheses as to why nonresidential imbalances continue to increase see Construction Spending May 2017 – Behind The Headlines

One additional thing worthy consideration that might be obscuring the analysis of labor availability relative to value and volume of residential construction is the relative mix between single-family new construction, multi-family new construction, and remodeling … which over the past 10 years shifted meaningfully, with $ spent on new single family homes losing % share of total residential spend while new multi-family and remodels gaining share.
I don’t have enough expertise to do the analysis, but I believe it’s likely that there could be meaningful differences in worker productivity ($ put in place/worker) between workers focused on single family homes vs. multi-family units (especially those working on luxury apartment buildings) vs. remodels.
Hence, significant differences in worker productivity (if true), combined with shifts in share $ spent on new single-family, new multi-family, and remodel might meaningfully affect the analysis of residential labor shortage
LikeLike
Hi, Ed – always appreciate this work that you do & share! The base year matters a lot! I recall you’ve done a prior post with a different base year, which showed a residual surplus of residential workforce relative to res volume. Please see the website link for a FRED graph that shows this.
LikeLike
Thanks. the link is here
https://fred.stlouisfed.org/graph/?graph_id=452928
Not sure why it didn’t post in your comment but it came thru in the submitted comment. Another article I wrote deals with total construction $ vs Total jobs. That showed a surplus of jobs. This is the one that breaks out the residential to show the residential jobs deficit.
LikeLike
The article “A Harder Pill to Swallow” also breaks out nonres and res. I think the plot in this article shows it better.
LikeLike
Hi EdZ,
First time posting here. Can you elaborate on ” it now takes more workers to do the same job that took fewer in the past”? When I initially read this I thought that the reason behind this would be mostly two-fold: a) a higher percentage of unskilled or low-skilled labor relative to before the boom, 2) construction companies being stretched to the limits of their capacity in handling multiple projects thus making them less efficient per project.
What is your take?
Thx Tom
LikeLike
Hi Thomas. I would consider both your reasons valid. I did suggest a few possibilities in this link.
See the last few words in this post and the link.
“For some hypotheses as to why nonresidential imbalances continue to increase see Construction Spending May 2017 – Behind The Headlines”
edz
LikeLike
Tom,
see the comments I added immediately following the NonBldg Infra and Nonres Bldgs plots. Jobs growth in some instances follows the pattern of spending growth, not volume growth. I’ve seen this pattern in data prior to the recession.
edz
LikeLike
That is taken into account in these plots. Spending is corrected for inflation to get volume. Inflation for residential incorporates a constant value index.
LikeLike
How does a change in overall home value affect the $put-in-place for residential? According to Zillow, the average home price from a low in Dec 2011 of about $150K to over $200K by the end of 2017, and increase of 30%. If the overall home price increased over this period, would the change in $put-in-place not be adjusted downward? Or maybe you took this into account.
LikeLike