3-8-18
What data are analysts comparing to show construction jobs shortages?
There are numerous articles circulating in the industry regarding the difficult growth of construction jobs. Some compare the percent growth in jobs to the percent growth in construction spending, often citing that spending has increased far more than jobs.
Well yes, that’s true. BUT…
In the 5 years 2013-2017 jobs increased by 1.3mil or 23%. Spending increased by 45%. The industry, for 5 years, has been saying it is difficult to find skilled workers to fill jobs. And yet total construction jobs added in last 5 yrs = 1.3 million, near all-time high growth.
Only 3 times since 1970 have 5-year jobs totals increased by more than the most recent 5-year period 2013-2017. All of the top jobs growth occurred between 1994-2000.
Only 5 times has 3-year jobs growth exceeded the most recent 3-year period. The period 2004-2006, with the highest 3-year jobs growth, also represents 50-year peak construction volume, although closely rivaled for both jobs growth and peak volume from 1999-2001.
But, comparing jobs growth to spending growth is an invalid comparison. Jobs must be compared to volume. Spending is not volume.
Construction spending includes inflation. Inflation does not support jobs growth. If spending is increasing 6%/year and inflation increases 4%/year, then real construction volume is increasing only 2%/year. Balanced jobs growth would then increase 2%/year.
Spending is measured in current $, always current to the year, which includes inflation from year to year. Volume is reported in constant $, constant to the baseline year, which adjusts for inflation. Jobs should be compared to constant $ volume growth.
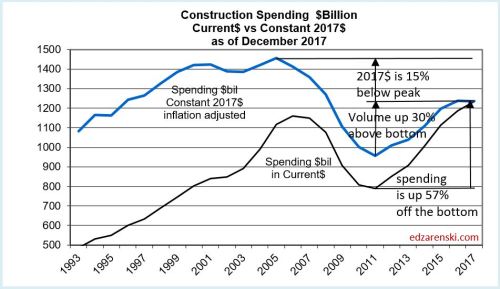
For the 5-year period 2013-2017, although spending increased 45%, inflation was near 4%/year for all 5 years. Real construction volume increased only 22%. Jobs, up 23%, just slightly exceeded volume growth during this period.
Update 3-6-19 – Jobs increased 324,000 in 2018, the largest increase since 2006. For the six years 2013-2018 jobs increased 1.6 million up 29%. Spending increased 50%. But after inflation volume increased only 25%. Jobs growth is exceeding volume growth.
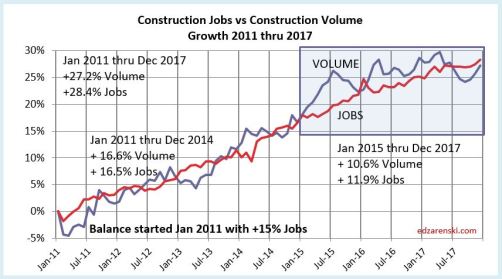
I’ve written a series of articles on jobs vs spending/volume, comparing growth back to 2001. Links to the entire series can be found at the bottom of this post. Several things seem apparent from the analysis, among them, potentially hiring to match spending growth and hiring lags spending growth.
A benefit of the series is that it shows, although jobs/volume growth is nearly even, severe jobs imbalances exist within sectors. Nonresidential and Non-building show excess jobs while residential shows a severe jobs deficit.
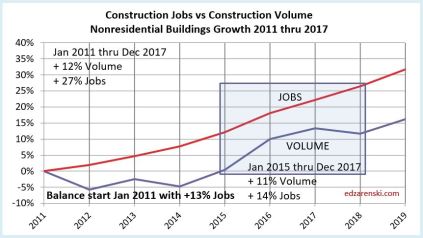
Nonresidential buildings has had the largest jobs growth in excess of volume growth. This raises the question, are jobs being added in response to spending growth, which is almost 4%/year higher than real volume growth.
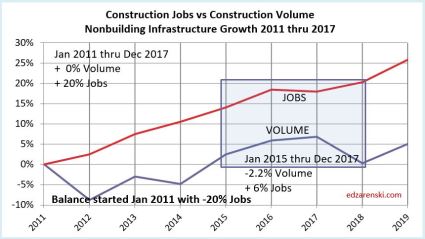
Non-building Infrastructure recent growth is similar to Nonres Bldgs, but it started 2011 with a large deficit.
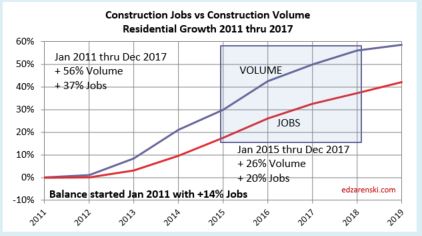
Residential comparisons uncover some hidden factors. In this Residential plot, spending increased by 100% since Jan 1 2011, but after inflation volume increased by only 57%. Jobs lag 20% behind at only 37%.
But, are all residential jobs being counted? Several studies suggest that a large portion of residential construction jobs may be held by uncounted immigrant or day labor. So it’s possible the residential jobs deficit may not be as large as shown.
In addition to uncounted immigrant labor, some labor is mis-classified. Take for example, a high-rise multi-use building with commercial retail, office and residential space. Census definitions of spending classifications break out spending into the 3 market sectors, but the building is built by high-rise contractors (probably normally classified as commercial), not a residential contractor. This then is residential space built using labor classified as non-residential commercial. BLS writes this: “Establishments are classified into industries on the basis of their primary activity… For an establishment engaging in more than one activity, the entire employment of the establishment is included under the industry indicated by the principal activity”
The series of articles explains much more detail including productivity (annual $ put-in-place), jobs/workload balance and hiring patterns.
Residential Construction Jobs Shortages 2-3-18
Construction Jobs / Workload Balance 11-7-17
Jobs vs Construction Volume – Imbalances 8-8-17
Construction Jobs Growing Faster Than Volume 5-5-17
A Harder Pill To Swallow! 4-8-17
Is There a Construction Jobs Shortage? 3-10-17
Behind The Headlines – Construction Jobs 2-16-17
Construction Spending vs Jobs 2-9-17
Saturday Morning Thinking Outloud #5 – Jobs Growth 12-3-16
Saturday Morning Thinking Outloud #3 – Construction Jobs 11-19-16
Construction Jobs – Behind The Headlines 10-13-16
Construction Jobs Show 3rd Qtr Growth 10-7-16

The Census Dept., numbers do not include labor, just the estimated cost of the building. There is a shortage of construction labor that has driven the real cost of construction higher because of the high demand for a limited pool of qualified people.
LikeLike
Hi Doug. Could you explain what you mean by this (The Census Dept., numbers do not include labor, just the estimated cost of the building.)
Census spending figures include ALL spending, including labor.
here’s a link to Census Construction Spending Definitions
https://www.census.gov/construction/c30/definitions.html
VALUE OF CONSTRUCTION PUT IN PLACE
The “value of construction put in place” is a measure of the value of construction installed or erected at the site during a given period. For an individual project, this includes—
1. Cost of materials installed or erected.
2. Cost of labor (both by contractors and force account) and a proportionate share of the cost of construction equipment rental.
LikeLike