9-13-18
New Construction Starts is powerful data if used properly. Understand how to use the data and you have an excellent forecasting tool.
New Construction Starts is incorrectly used when the data is referred to as construction spending. It cannot be used to look at the year over year (yr/yr) or month over month (mo/mo) trend in values to predict % change in construction spending. This misrepresents how to use New Starts data.
Care must be taken to use Starts properly. It is sometimes misinterpreted in common industry forecasting articles. Starts dollar values represent a survey of about 50% to 60% of industry activity, therefore Starts dollar values cannot ever be used directly to indicate spending. Also, Starts do not directly indicate changes in spending per month or per year. Projected starts data cannot be used to directly forecast expected construction volume.
Only by including an expected duration for all Starts and producing a forecast Cash Flow from Starts data can the expected pattern of spending be developed. Finally, it is the rate of change in Starts Cash Flows that gives an indication of the rate of change in spending.
Cash flow is the best indicator of how much and when spending will occur. Cash flow from starts gives a prediction over time of how spending from each month of previous starts will change from all projects in backlog. Cash flow totals of all jobs can vary considerably from month to month, are not only driven by new jobs starting but also old jobs ending, and are heavily dependent on the type, size and duration of jobs.
New Starts for the month or the year is the total value of new project revenues that came under contract in that period. Since the values reported for Starts are a sampling survey of about 60% of the industry totals, the total dollar volume is not comparable to actual spending. However, the percent change in values is very useful.
The entire value of a project enters backlog when the contract is signed and work begins. That’s a new start. Projects booked on or before December 31st, that still have work remaining to be completed, are in backlog at the start of a new year.

Simply referencing total new starts or backlog in the year does not give an indication of spending within the year or next calendar year. Projects, from start to completion, can have significantly different duration. Whereas a residential project may have a duration of 6 to 12 months, an office building could have a duration of 18 to 24 months and a billion-dollar infrastructure project could have a duration of 3 to 4 years. New starts within any given year could contribute spending spread out over several years. Total Cash Flow in the Year, or Spending, could include spending from projects that started years ago.
Backlog at the start of the year could include revenues from projects that started in December or several years ago. For a project that has a duration of several years, the amount in starting backlog at the beginning of the year is the amount remaining to complete the project or the estimate to complete (ETC). And all that ETC may not be spent in the year following when it started, dependent on the duration remaining to completion.
The only way to know how much of total starts or total backlog that will get spent in the current year and following years is to prepare an estimated cash flow from start to finish for all the projects. The sum of the amounts from all projects ongoing in each month gives total cash flow in that month, or monthly spending in that year. Spending in any given month could have input from projects that started many months ago. The sum of the cash flow is what shows the expected change in spending.
The following table clearly shows there is not a correlation between starts in any year with spending in the following year. The practice of using construction starts directly to predict spending in the following year can be very misleading in an industry that relies on data for predictive analysis to plan the future. Not only does it not predict the volume of spending in the following year, it does not even consistently predict the direction spending will take, up or down, in the following year. It’s a false indicator and it’s not a good use of data.
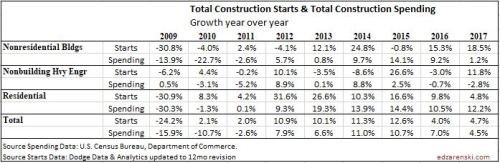
Construction spending is strongly influenced by the pattern of continuing or ending cash flows from the previous two to three years of construction starts.
Current month/month, year/year or year-to-date trends in starts often do not indicate the immediate trend in spending.

Power market starts and spending provides a good example.
Power starts peaked in 2015 at an all-time high, up 140% from 2014 and more than the prior two years combined. Yet Power spending was down 6.5% in 2015 and down 1.5% in 2016. This happened because Power starts were also at an all-time high in 2012, just below the 2015 level, and those starts drove 2014 spending to an all-time high, but then tapered off in 2015. Those peak starts from 2015 will still be contributing spending for several years to come, long beyond typical jobs, and that drives typical spending growth because it adds more than typical number of months that contribute spending.
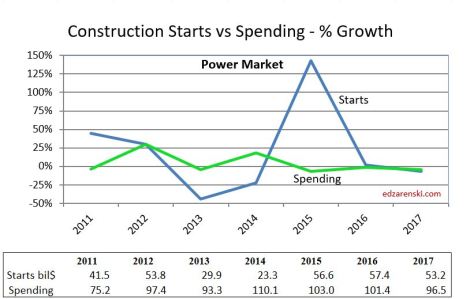
Power starts gained only 1.5% in 2016, dropped 7% in 2017 and are expected to finish 2018 down 12%. The pattern of cash flows from starts is indicating growth in spending for 2018 and 2019. Starts from 2015 and 2016 with longer than average duration contribute spending out to 2020 & 2021, breaking the average balanced cycle of one month of old jobs ending for every new month of jobs starting. That drives the pattern in spending.
The following example shows what happens to monthly spending growth when a long duration job first influences spending past the typical duration and then when it ends. In the example table presented below, starts grow at 1% per month and have a typical duration of 5 months. But one unique month has an unusually large project start that will last for 10 months.
A typical month of spending has cash flow from 5 months of starts, but the long duration project creates 6 months of cash flows for the period beyond typical duration. Notice what happens and when it occurs.
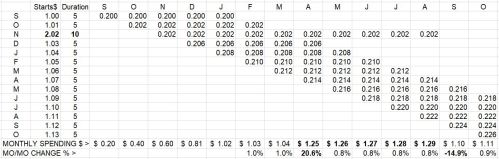
When the large project starts it has no unusual effect on spending. But when it first extends beyond typical duration, it has a massive +20% growth effect on spending, even though starts had only been increasing at 1%/month for the previous 5 months. When it ends it has a similar downward effect, again, even though starts had been increasing at 1%/month.
Spending growth (or declines), both when an extra-large job causes it to increase and then when the extra-large job ends, is almost entirely influenced by the long duration project, not by normal monthly starts growth rate. This same example can be over months or over years.
Spending patterns are far more influenced by projects with unusual duration. Construction spending is strongly influenced by the pattern of continuing or ending cash flows from the previous two to three years of construction starts. Cash flow is the best indicator of how much and when spending will occur.
All construction starts data in this report references Dodge Data & Analytics Starts data.

Hi Ed,
How are you calculating backlog? Or is there a source/methodology that you reference? Thanks,
LikeLike
See the section on Starting Backlog in this post. https://edzarenski.com/2020/02/10/2020-construction-economic-forecast-jan-2020/
Staring backlog at any point in time is the unspent estimate to complete of all ongoing projects. I cash flow new starts every month. So the backlog could be the sum of the estimate to complete for projects from the last 20 or 30 or 40 months, all at different stages of completion.
LikeLike