1-28-20 This original post, Inflation excerpt from the complete economic report – Construction Analytics 2020 Construction Economic Forecast – Jan 2020
SEE Construction Inflation 2023
8-25-20 See also Pandemic #14 – Impact on Construction Inflation
1-27-21 See 2021 Construction Inflation
Click Here for Link to a 20-year Table of 25 Indices
Construction Inflation
The level of construction activity has a direct influence on labor and material demand and margins and therefore on construction inflation.
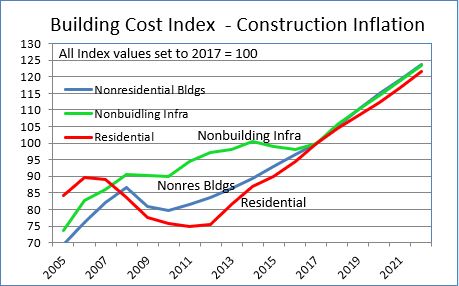
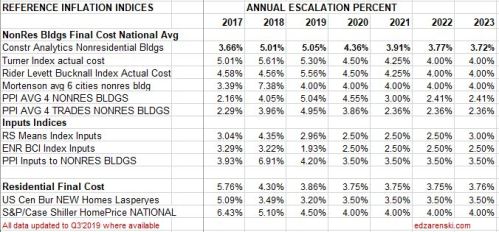
Nonresidential buildings inflation, after hitting 5% in both 2018 and 2019, is forecast for the next three years to fall from 4.4% to 3.8%, lower than the 4.5% average for the last 4 years.
Residential construction inflation in 2019 was only 3.6%. However, the average inflation for six years from 2013 to 2018 was 5.5%. It peaked at 8% in 2013 but dropped to 4.3% in 2018 and only 3.6% in 2019. Forecast residential inflation for the next three years is level at 3.8%.
Nonresidential Buildings and Non-building Infrastructure backlog are both at all-time highs. 75% to 80% of all nonresidential spending within the year comes from starting backlog. Most spending for residential comes from new starts in the year.
2020 starting backlog is up 5.5% across all sectors. However, while a few markets will outperform in 2020 (transportation, public works, office), predicted cash flow (spending) from backlog is up only 1% to 2%. Long duration projects added to backlog and will spread spending out over the next few years.
Residential new construction starts in 2019 (number of units started) gained 4% over 2018. In 2018, starts dropped every quarter after Q1, but then increased every quarter in 2019 and closed out the 2nd half of 2019 at 9% higher than the average of the previous six quarters. New starts measured in dollars dropped slightly in 2019. Spending from new starts fell 5% in 2019 but is forecast up 6% for 2020. Residential construction volume (spending after inflation) in 2019 dropped 8%, the largest volume decline in 10 years. Volume in 2019 dropped to a 4-year low. A volume gain of 2% in 2020 leaves residential still at a 4-year low.
General construction cost indices and Input price indices that don’t track whole building final cost do not capture the full cost of inflation on construction projects.
To differentiate between Revenue and Volume you must use actual final cost indices, otherwise known as selling price indices, to properly adjust the cost of construction over time.
Selling Price is whole building actual final cost. Selling price indices track the final cost of construction, which includes, in addition to costs of labor and materials and sales/use taxes, general contractor and sub-contractor margins or overhead and profit.
Consumer Price Index (CPI), tracks changes in the prices paid by consumers for a representative basket of goods and services, including food, transportation, medical care, apparel, recreation, housing. This index in not related at all to construction and should not be used to adjust construction pricing.
Producer Price Index (PPI) for Construction Inputs is an example of a commonly referenced construction cost index that does not represent whole building costs. Engineering News Record Building Cost Index (ENRBCI) and RSMeans Cost Index are examples of commonly used indices that do not capture whole building cost.
Producer Price Index (PPI) Material Inputs (which excludes labor and margins) to new construction increased +4% in 2018 after a downward trend from +5% in 2011 led to decreased cost of -3% in 2015, the only negative cost for inputs in the past 20 years. Input costs to nonresidential structures in 2017+2018 average +4.3%, the highest in seven years. Infrastructure and industrial inputs were the highest, near 5%. But input costs for 2019 are coming in at less than +1%. Material inputs accounts for only a portion of the final cost of constructed buildings.
Materials price input costs in 2019 slowed to an annual rate of less than 1%.
Labor input is currently experiencing cost increases. The National construction unemployment rate was recently posted below 4%, the lowest on record with data back to 2000. The average has been below 5% for the last 18 months. During the previous expansion it hit a low average of 5%. During the recession it went as high as 25%. An unemployment rate this low signifies a tight labor market. This may cause contractors to pay premiums over and above normal wage increases to keep valued workers from leaving. Some premiums accelerate labor cost inflation but are not recorded in published wage data, so aren’t easily tracked. Lack of experienced workers and premiums to keep labor drive labor cost increases higher than wage growth.
Although many contractors report shortages due to labor demand, labor growth may slow due to a forecast 2019-2020 construction volume decline. We might see a jobs decline lag spending/volume decline.
When construction activity is increasing, total construction costs typically increase more rapidly than the net cost of labor and materials. In active markets overhead and profit margins increase in response to increased demand. These costs are captured only in Selling Price, or final cost indices.
Construction Analytics Building Cost Index, Turner Building Cost Index, Rider Levett Bucknall Cost Index and Mortenson Cost Index are all examples of whole building cost indices that measure final selling price (for nonresidential buildings only). The average annual growth for all these indices over the past five years is 4.7%/year. For the last two years, average nonresidential buildings inflation is 5.3%.
- Long-term construction cost inflation is normally about double consumer price index (CPI).
- Average long-term nonresidential buildings inflation excluding recession years is 4.2%.
- Average long-term (30 years) nonresidential construction cost inflation is 3.5% even with any/all recession years included.
- In times of rapid construction spending growth, nonresidential construction annual inflation averages about 8%. Residential has gone as high as 10%.
- Nonresidential buildings inflation has average 3.7% since the Great Recession bottom in 2011. It has averaged 4.2% for the last 4 years.
- Residential buildings inflation reached a post-recession high of 8.0% in 2013 but dropped to 3.4% in 2015. It has averaged 5.8% for the last 5 years.
- Although inflation is affected by labor and material costs, a large part of the change in inflation is due to change in contractors/supplier margins.
- When construction volume increases rapidly, margins increase rapidly.
- Construction inflation can be very different from one major sector to the other and can vary from one market to another. It can even vary considerably from one material to another.
Residential construction inflation in 2019 was only 3.6%. However, the average inflation for six years from 2013 to 2018 was 5.5%. It peaked at 8% in 2013 but dropped to 4.3% in 2018 and only 3.6% in 2019. Residential construction volume in 2019 dropped 8%, the largest volume decline in 10 years. Typically, large declines in volume are accompanied by declines in inflation. Forecast residential inflation for the next three years is level at 3.8%.
A word about Hi-Rise Residential. Probably all of the core and shell and a large percent of interiors cost of a hi-rise residential building would remain the same whether the building was for residential or nonresidential use. This type of construction is totally dis-similar to low-rise residential, which in large part is stick-built single family homes. Therefore, use the residential cost index for single family but a more appropriate index to use for hi-rise residential construction is the nonresidential buildings cost index.
Nonresidential inflation, after hitting 5% in both 2018 and 2019, is forecast for the next three years to fall from 4.4% to 3.8%, lower than the 4.5% average for the last 4 years. Spending needs to grow at a minimum of 4.4%/yr. just to stay ahead of construction inflation, otherwise volume is declining. Spending slowed dramatically in 2019. However, new starts in 2018 and 2019 boosted backlog and 2020 spending will post the strongest gains in four years.
Several Nonresidential Buildings Final Cost Indices averaged over 5% per year for the last 2 years and over 4% per year for the last 5 years. Nonresidential buildings inflation totaled 22% in the last five years. Input indices that do not track whole building cost would indicate inflation for those five years at only 12%, much less than real final cost growth. For a $100 million project escalated over those five years, that’s a difference of $10 million, potentially underestimating cost.
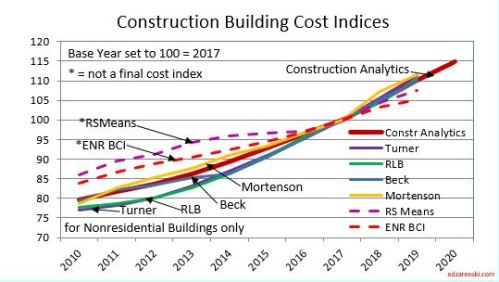
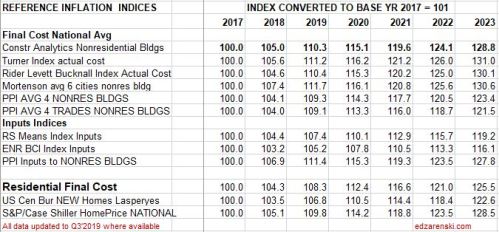
Notice in this next plot how index growth is much less for ENR BCI and RSMeans, both input indices, than for all other selling price final cost indices. From 2010 to 2019, total final price inflation is 110/80 = 1.38 = +38%. Input cost indices total only 106/85 = 1.25 = +25%, missing a big portion of the cost growth over time.
Nonresidential Buildings Selling Price Indices vs Input Indices
Non-building infrastructure indices are so unique to the type of work that individual specific infrastructure indices must be used to adjust cost of work. The FHWA highway index increased 17% from 2010 to 2014, stayed flat from 2015-2017, then increased 15% in 2018-2019. The IHS Pipeline and LNG indices increased 4% in 2019 but are still down 18% since 2014. Coal, gas, and wind power generation indices have gone up only 5% total since 2014. Refineries and petrochemical facilities dropped 10% from 2014 to 2016 but regained all of that by 2019. BurRec inflation for pumping plants and pipelines has averaged 2.5%/yr since 2011 and 3%/yr the last 3 years.
Anticipate 3% to 4% inflation for 2020 with the potential to go higher in specific Infrastructure markets, such as pipeline or highway. This link refers to Infrastructure Indices.
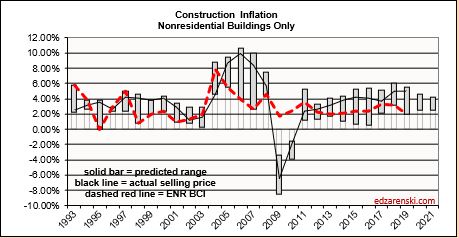
Construction Analytics Building Cost Index
In the following plot, Construction Analytics Building Cost Index annual percent change for nonresidential buildings is plotted as a line against a bar chart of the range of all other nonresidential building inflation indices. Bars represent the predicted range of inflation from various sources with the solid line showing the composite final cost inflation. Note that although 2015 and 2016 have a low end of predicted inflation of less than 1%, the actual inflation is following a pattern of growth above 4%. The low end of the predicted range is almost always established by input costs (ENR BCI is plotted), while the upper end of the range and the actual cost are established by selling price indices.
Construction Analytics Nonresidential Buildings Cost Index
vs Range of Input Indices
As noted above, some reliable nonresidential selling price indexes have been over 4% since 2014. Currently most selling price indices are over 5% inflation since 2018.
Every index as published has its own base year = 100, generally the year the index was first created, and they all vary. All indices here are converted to the same base year, 2017 = 100, for ease of comparison. No data is changed from the original published indices.
Non-building Infrastructure indices are far more market specific than any other type of index. Link here to Reference specific Infrastructure indices rather than an average.
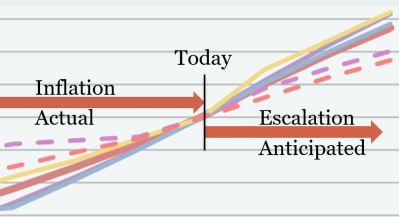
A word about terminology: Inflation vs Escalation. These two words, Inflation and Escalation, both refer to the change in cost over time. However escalation is the term most often used in a construction cost estimate to represent anticipated future change, while more often the record of past cost changes is referred to as inflation. Keep it simple in discussions. No need to argue over the terminology, although this graphic might represent how most owners and estimators reference these two terms.
This link points to comprehensive coverage of the topic inflation and is recommended reading. Click Here for Link to a 20-year Table of 25 Indices

The Turner index year-to-date (avg Q1+Q2=1183) is still 2.3% higher than the avg for 2019 (1156). Also since Q1,
the cost of lumber has increase 120%, so expect residential inflation to increase faster than nonresidential. https://eyeonhousing.org/2020/08/average-new-home-price-now-14000-higher-due-to-lumber/
the PPI for all inputs to construction has increased 1.8% ytd,
but most important, labor productivity has decreased 18% to meet COVID-19 protocols. https://www.constructiondive.com/news/study-finds-covid-19-protocols-led-to-a-7-loss-on-construction-projects/583143/
Labor is about 35% of project cost. Therefore, just this productivity loss equates to 18% x 35% = leads to 6.3% inflation. I expect the Turner Nonres Bldgs index will reflect this labor cost in the next two quarterly releases.
We can expect some cost decline due to fewer projects to bid on, which typically results in sharper pencils. But we can expect cost increases due to materials, lost productivity, project time extensions, and/or potential overtime to meet fixed end-date.
LikeLike
Turner’s Second Quarter Building Cost Index: A Busy Construction Market, Increased Competition, and COVID-19 Are Impacting Construction Costs. Second Quarter 2020 Turner Building Cost Index—which measures costs in the non-residential building construction market in the United States—has decreased to a value of 1177. This represents a -1.01% quarterly reduction from the first quarter of 2020.
LikeLike