Spending and Volume updated 1-4-22. Jobs updated 1-7-22
1-28-22 See the bottom of this post for a link to download a PDF of the complete article.
See the link at end for full report updated 2-11-22 to include year-end data.
5-6-22 The complete article has been updated and is here
Construction Forecast 2022 Update 5-6-22
The construction data leading into 2022 is unlike anything we have ever seen. Construction starts were up in 2021, but backlog leading into 2022 is down. That is not normal. Backlog is rarely down and usually when starts have been down the previous year. In this case the starts declined in 2020, but that 2020 decline was so broad and so deep, even with an increase in starts in 2021, backlog to start 2022 has not yet recovered (to the start of 2020). Spending for 2021 was up 8%, but after adjusting for inflation, real volume after inflation was down. Last time that happened was 2006 and 2002, the only two other times that happened in the last 35 years. Let’s have a look at all the data that sets up 2022.
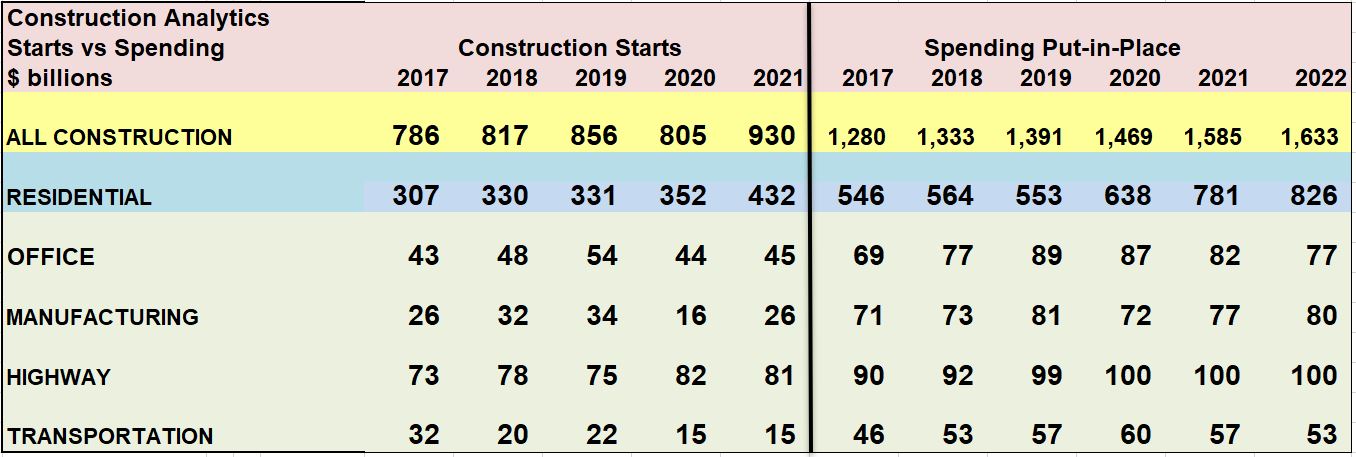
New Construction Starts for 2022, as reported by Dodge Data and Analytics, are forecast up +5% total for the year. Residential starts will be up +2%, but that is on top of a +33% gain over the previous two years. Nonresidential Bldgs starts will be up +8%, just recovering to pre-pandemic levels. Nonbuilding starts are forecast up +8%, still -6% below 2019.
Construction Backlog leading into Jan 2022 vs Jan 2021 is up only +1%, but it’s still down 8% vs Jan 2020. Residential backlog is up +21%, but Nonresidential Bldgs backlog is up only +2%, still down -14% from the start of 2020 and Non-Building backlog is down -8% yoy, now -17% below the start of 2020.
Nonresidential Bldgs starting backlog for 2022 is still down -14% from the start of 2020 and Non-Building backlog is now -17% lower than the start of 2020. That could weigh on spending for several years.
(Construction Analytics measures Backlog at the start of the year vs backlog at the start of the previous year. This is different than the ABC Backlog indicator, which measures current month’s backlog compared to previous year’s total revenue).
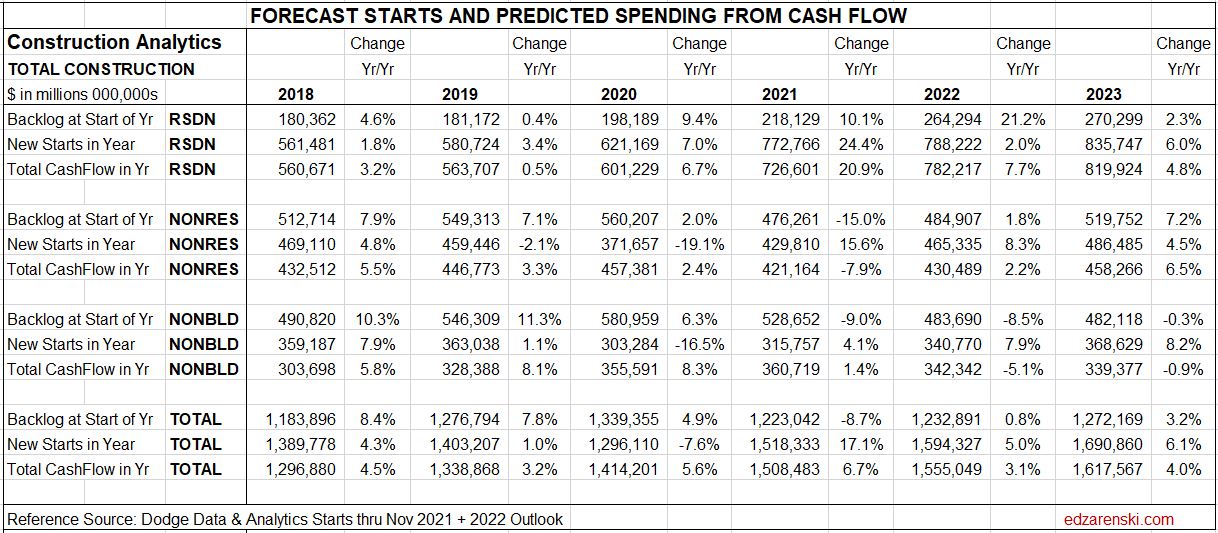
Backlog at the beginning of the year or new starts within the year does not give an indication of what direction spending will take within the year. Backlog is increasing if new starts during the year is greater than spending during the year. An increase in backlog could immediately increase the level of monthly spending activity, or it could maintain a level rate of market activity, but spread over a longer duration. In this case, there is some of both in the forecast. It takes several years for all the starts in a year to be completed. Cash flow shows the spending over time.
Spending for 2021, with 11 months actual in year-to-date, is forecast up +7.9%. However, that can be misleading. Residential spending for 2021 is up 22% while Nonresidential Bldgs is down -5% and Non-Bldg is down -1%.
In almost every data release this year, Census has revised the previous month upwards. That has been adding to my forecast throughout the year.
Spending includes inflation which does not add to the volume of work.
My current and predicted Inflation rates:
- 2020 Residential 5%, Nonres Bldgs 4.8%, Nonbldg Infra Avg 4.5%
- 2021 Residential 14.2%, Nonres Bldgs 6.8%, Nonbldg Infra Avg 7.8%
- 2022 Residential 7%, Nonres Bldgs 4.5%, Nonbldg Infra Avg 3.7%
- There is greater chance for rates to move up than down.
After adjusting for inflation, total volume in 2021 is down -2.5%. Residential volume for 2021 is up +7.4% while Nonresidential Bldgs volume is down -11% and Non-Bldg volume is down -8.1%.
Volume declines should lead to lower inflation as firms compete for fewer new projects. However, if jobs growth continues while volume declines, then productivity continues to decline and that will add to labor cost inflation. Since 2010, Construction Spending is up over 100%, but after adjusting for inflation, Volume is up only 28%. Jobs are up 41%.
Jobs average over the year 2021 increased +2.3%. Volume was down -2.5%
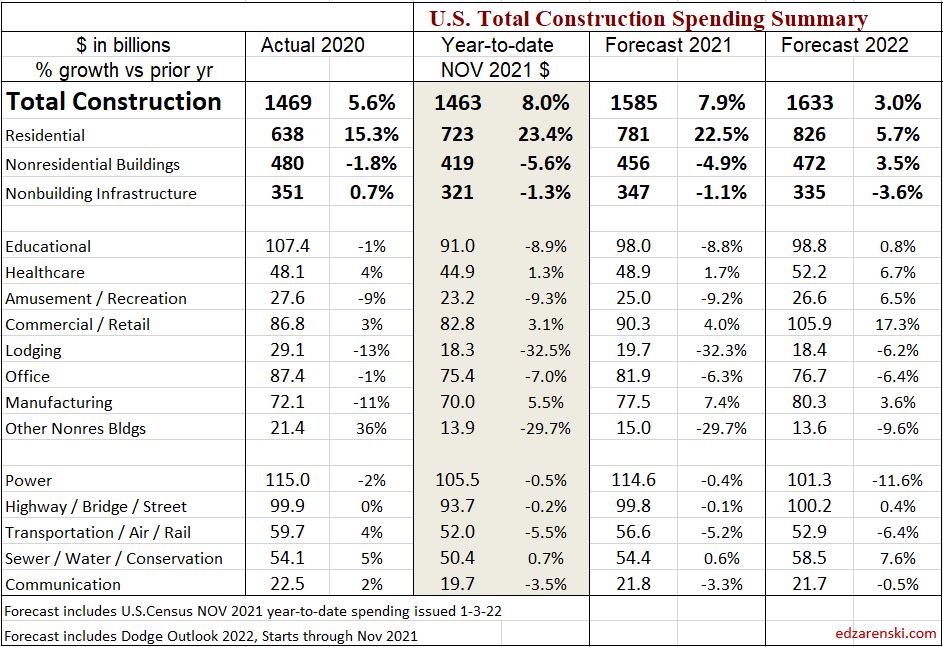
Spending Forecast for 2022 is expected to increase +3.0%. Residential spending for 2022 is forecast up +5.7%. Nonresidential Bldgs forecast is up +3.5%. Non-Bldg forecast is down -3.6%.
Some of the biggest impacts to nonresidential buildings spending are: Warehouses, 60% of Comm/Retail, new starts are up 50% since Jan 2020. Comm/Retail could post the largest gains in 2022 nonres bldgs spending. Lodging starts even with 24% growth in 2022, are still down 50% from Jan 2020. Manufacturing starts dropped over 50% in 2020 but gained nearly all of that back in 2021. Manufacturing spending in 2022 should return to the level of 2019.
Many construction firms judge their backlog growth by the remaining estimate to complete of all jobs under contract. The problem with that, for example, is that Nonresidential Buildings spending (revenues) are expected to grow +3.5% in 2022, but after adjusting for inflation the actual volume of work is down about -1%. By this method, in part, these firms are accounting for an increase in inflation dollars passing through their hands. Spending includes inflation, which does not add to the volume of work.
Total volume for 2022 is forecast down -2.5%. After adjusting for inflation, Residential volume for 2022 is forecast down -1%. Nonresidential Bldgs volume is also forecast down -1% and Non-Bldg volume is forecast down -7%.

The Non-Building Infrastructure spending forecast for 2022 is more affected by a drop of -17% in starts in 2020 (2020 starts would have generated 30% of 2022 spending) than by any increase in starts in 2022 (which would generate only 15% of 2022 spending).
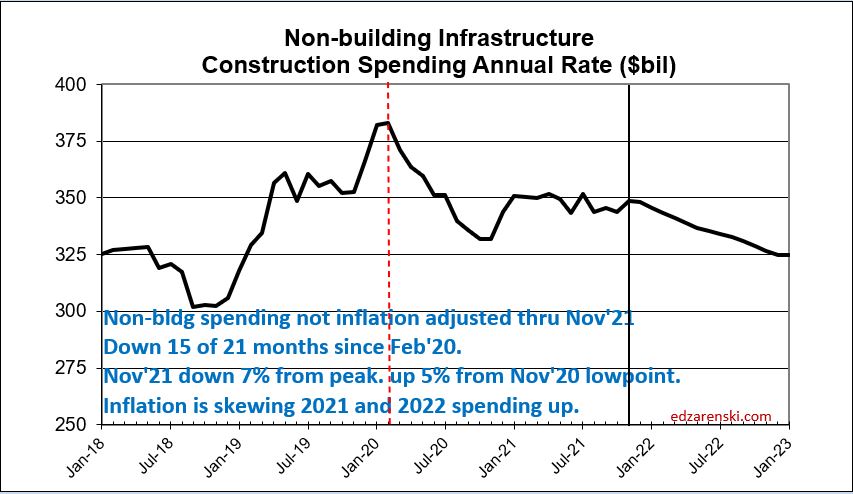
Non-building construction starts recorded 18 months (from April 2020 through September 2021) averaging 16% below the Q3’19-Q4’19 average of starts. Non-building Infrastructure Backlog beginning 2022 is down -17% from Jan 2020, the largest two-year drop on record. Non-building Infrastructure Spending has declined in 15 of the last 21 months.
Why is spending still down in Non-building? Here’s a few notes on construction starts that drive spending.
Power starts for the 3yr period 2020-2022, even with 11% growth in 2022, are expected to average 33% lower compared to 2017-2019. Transportation starts for the 3yr period 2020-2022 are expected to average 40% lower compared to 2017-2019. These two make up 50% of the Non-bldg sector and we could see spending remain depressed in both for the next two years.
Highway starts through 2020 are up 15% in 3 years. But spending in 2019 through 2021 has remained constant. This might be an example of adding new starts but it doesn’t show in spending because work is spread out over many years, or this could be indicating no real change in volume but a change in share of total market being captured in the starts.
On average about 20% of new nonresidential buildings construction starts gets spent within the year started, 50% is spent in the next year and 30% is spent in future years. (For residential the spending curve is more like 70%-30%).
Nonresidential Buildings construction starts recorded 12 consecutive months (from April 2020 through March 2021) at 20% or more below the Q4’19-Q1’20 average of starts. Nonres Bldgs spending has posted 17 of the last 21 months down and is still down 13% from Feb 2020.
Construction Analytics has been forecasting these drops in Nonresidential spending since August of 2020.

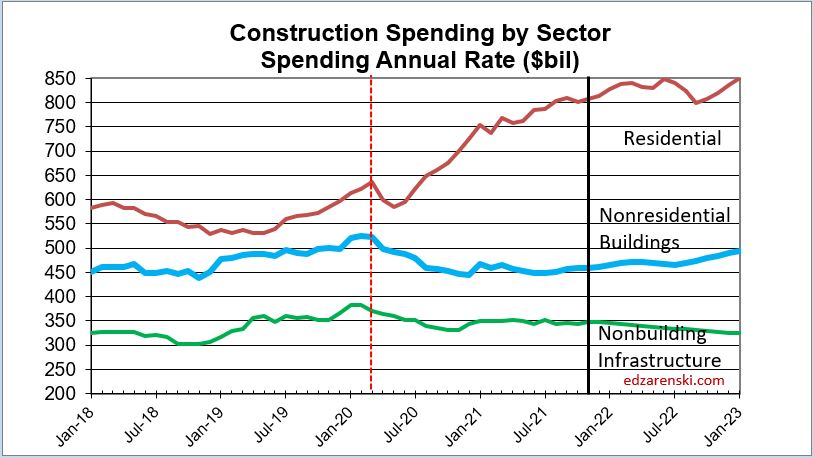
In constant (inflation adjusted) dollars, as of Nov. 2021, Nonres Bldgs spending is 20% below the Feb 2020 peak. The bottom is expected in mid-2022.
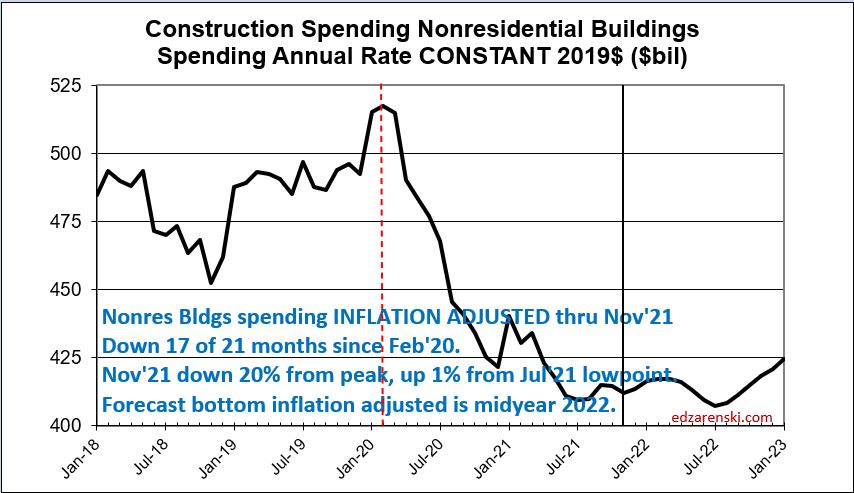
Below is the Non-building plot, inflation adjusted. Both these plots show there has been no increase since Feb 2020 in volume of nonresidential or non-building work to support jobs growth, and there is little to no help in 2022.
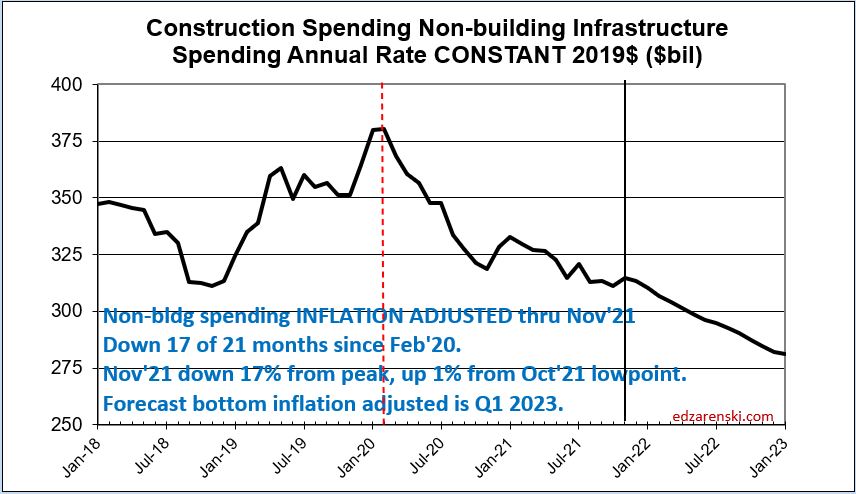
If new construction starts in 2022 post an add of $100 billion in new starts for infrastructure, only about $20 billion of that would get put-in-place in 2022. The cash flow schedule for that $100 bil of new starts would extend out over 3 or 4 years. Most of that $100 bil would get spent in 2023 and 2024.
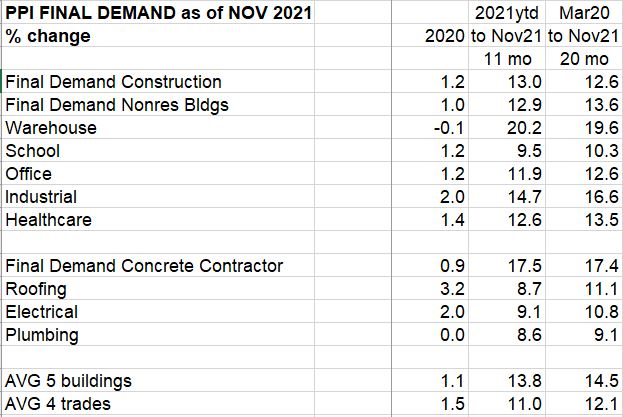
Current Final Demand pricing for Nonres Bldgs and Trades is highest on record. Prices support high inflation this year and next. Do not expect inflation to turn to deflation in 2022 or any time in the near future. The only time in 50 years that construction experienced deflation was in the period 2008 to 2011. At that time conditions were 10x worse than now.
1-7-22 Construction Jobs growth
2021 Dec21 vs Dec20 Rsdn+75k, Nonres Bldgs +61k, Nonbldg +24k
but annual averages tell a much different story
AVG21 vs AVG20 Rsdn+153k(+5.3%), Nonres Bldgs +28k(+0.8%), Nonbldg +9k(+0.9%)
Dec vs Dec simply compares jobs at 2 points in time, without the benefit of what occurred in the other 11 months of the year, so does not tell us what took place over the year. The annual average gives a much clearer indication of jobs growth over the year because it accounts for the peaks and dips of all 12 months during the year.
Jobs average over the year 2021 increased +2.3%. After adjusting for inflation, total volume in 2021 is down -2.5%. Residential volume for 2021 is up +7.4% while Nonresidential Bldgs volume is down -11% and Non-Bldg volume is down -8.1%.
If jobs are increasing faster than volume of work, productivity is declining. For example, nonres bdgs volume declined 11%, but nonres bldgs jobs increase 0.8%. That’s a 12% swing in productivity. Since labor is about 35% of the cost of a project, if productivity declines by 12% Then inflation rises by 12% x 35% = 4%. The most recent year drop in volume, while jobs increased, added 4% to nonres bldgs inflation for the year.
If jobs are increasing faster than volume of work (a negative impact) can we tell if it’s production employees or supervisory employees? BLS reports ALL construction jobs (~7.5million) and Production jobs (~5.5million). The difference between these two data sets is supervisory employees.
Looking at the average number of construction jobs in the last 4 years, the average of 2021 jobs vs the average of 2017 jobs, production jobs increased +5%, but supervisory jobs increased +12%.
Looking at 2021 vs 2019, in the past 2 years, production jobs decreased by -1.5%, but supervisory jobs increased +1.7%. During this period spending increased +3.5%, but after adjusting for inflation, volume declined -9%.
In 2011, supervisory jobs was 24% of all construction jobs. Now it is 35%. Growth in supervisory jobs has had a greater negative impact than production jobs on the spread between jobs and volume.
Jobs and Volume of work growth should move in tandem.
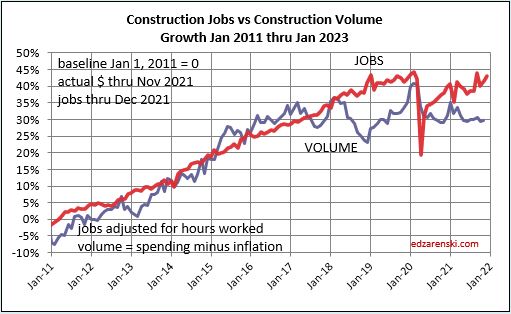
If jobs grow faster than volume, productivity is declining. When these plot lines grow wider apart with jobs on top, that is a sign of productivity decline. That’s part of inflation.

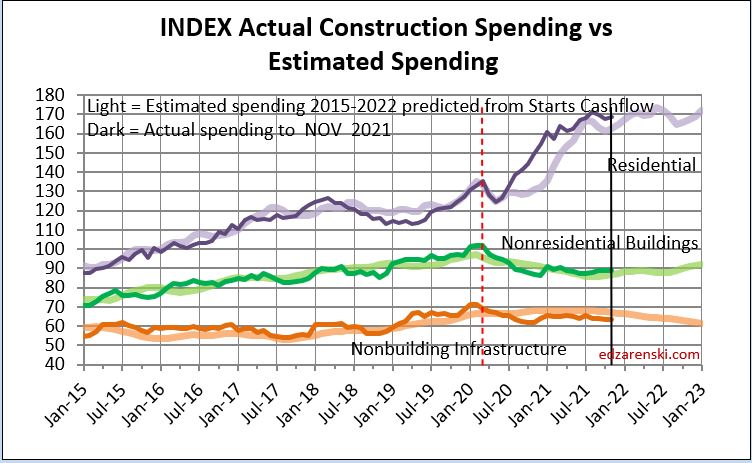
And finally, here’s one of the markers I use to check my forecast modeling, my forecasting performance tracking index. The light plot line is forecast predicted from my modeling. The dark plot line is actual construction spending. Even after any separation in the indices, the plots should move at the same slope. Almost without fail, the forecast model, estimated spending from cashflow, predicts the changes in direction of actual spending.
See the full report updated 2-11-22 to include year-end data.

Always appreciate these Ed. Question, do you think you could explain what the final demand price means? I had a professor explain to me that the final demand price increasing relatively little compared to the dramatic increase in material costs means they are gearing up for a tough market by increasing backlog of work with low bids. Have you heard of that comparison?
LikeLiked by 1 person
I don’t buy that explanation at all. Several reasons.
1st – Final demand pricing is bid price, final cost to owner.
I’ll start by saying, if a contractor’s margin is already very high, he can lower his bid prices within the range of his margins and still win some bids, although at much less profit. But construction margins are not very high. Not passing along the material cost increases seen recently is way beyond the range of construction margins.
If contractors do not eventually include all material cost increases in their bids, their bid prices will be low, and they get more work, but they lose money on every bid. Those losses will soon take a toll on their business profits. You cannot operate a business at a loss and stay in business. At least, not for long. During the 2007-2010 recession, I witnessed several long-time contractors try that. Their attitude was, I need to keep my people working. Didn’t take too long and they went out of business.
If a contractor thinks he can increase backlog of work with low bids, and later he can submit change orders to make up his losses, he will not win that battle.
Any contractor who thinks he can undercut the market by securing more work through underbidding to carry him through a rough patch is a fool practicing a very poor business plan. By underbidding to secure more work, he has created his own internal rough patch.
Keep in mind some of the dramatic increases seen in materials costs are not all absorbed by the contractor. Some is absorbed by the retailer and wholesaler.
Some material costs, steel for example, are showing price increases at basic manufacturing level (mill price steel). If the mill price of steel climbs 25%, the final cost of steel installed (which includes detailing, fabrication, delivery, equipment, installation, overhead and profit), goes up by only 5% or 6%.
Material costs is only half of total construction cost, Final demand includes labor, overhead and profit, so final demand cost increases could be considerably lower than material cost increases and all is well.
LikeLike
what makes up the commercial/retail segment?
LikeLike
Stores, Warehouses (60%) and Parking Garages
LikeLike
Thanks as always Ed Z. Couple of questions:
– how does the decline you show in Infrastructure reconcile with the $1.2T spending bill just signed into law?
– almost all (if not all) Construction Starts are expressed in $$. Do you have (and can you publish) stats on # of Construction Starts? I realize that is not as useful for many, but some of will appreciate the # stat because it equates to # of deals.
LikeLike
A Dodge study, included in this forecast, shows about $550 billion is actual construction, that’s spread over years, and my study, even $100 billion in new infrastructure starts this year would generate only $15 billion in spending this year. More next year.
The Non-Building Infrastructure spending forecast for 2022 is more affected by a drop of -17% in starts in 2020 (2020 starts would have generated 30% of 2022 spending) than by any increase in starts in 2022 (which would generate only 15% of 2022 spending).
Part2 That is a pay for service provided by Dodge.
LikeLike