Home » Uncategorized
Category Archives: Uncategorized
Inflation Sept 2023 5min Video
This is a voice over power point converted to MP4. It’s a huge file. Only 9 slides but almost 225meg, 50x more memory than the original 9 slides.
Midyear ’23 Forecast Updated 10-12-23
10-12-23 Updated PPI INPUTS added PPI plots
8-11-23 Updated PPI Inputs and Final Demand tables
8-12-23 Added Table that shows Spending, Inflation, Index, Constant$
When Census released May construction spending data on July 3 they also revised spending for all markets for the last 2 years. Largest revisions are usually in previous year. This changes % growth and baseline for the start of 2023.
Census added $50 bil to 2022, $27 bil to 2021 and $6 bil to Jan-Apr 2023. Largest revs 2022, Rsdn +$17bil, Mnfg +$7bil, Comm/Rtl +$6bil, HiWay +$4bil. Largest revs 1st 4 mo (JFMA) 2023, Rsdn +$6bil, Mnfg +$2bil. 2023 Forecast$ went up, but % increase went down, because 2022 $ revs went up by more.
My midyear forecast here would be compared to the AIA Consensus Midyear July 2023 Forecast.
AIA Consensus Midyear July 2023 Forecast.
A significant difference here is that the AIA forecasts are all compared to 2022$ before the Census revisions published 7-3-23, which are included in my forecast. That would mean that all AIA Forecast, in all markets, would be lower since Census revisions were up in every market.
Be careful out there. Here are other significant watchouts to be aware of in available midyear forecasts:
One forecast is based on a recession.
No other forecast (as of mid-July) besides Construction Analytics (this forecast) includes the Census 2021-22 updates to spending put-in-place of $27bil in ’21 + $50bil in ’22.
One forecast has public works adding 2% to 4%/yr spending the next few yrs, while new starts are up 50%.
There is a remarkable 50% spread ($52bil) on the forecast growth in manufacturing spending in 2023.
There is a 15% ($270bil) spread in forecasts for total$ in 2024.
There is a 16% ($100bil) spread just in nonres bldgs forecast for 2023.
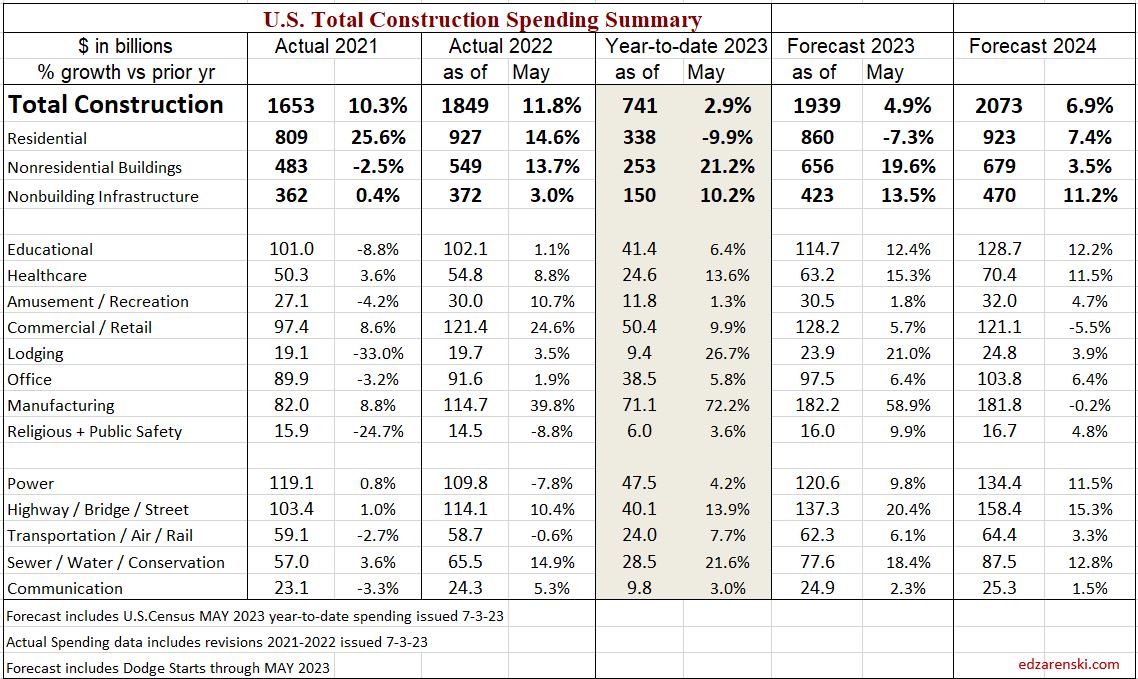
Residential Construction Spending Since Nov, Rsdn spending has seesawed up/down in a range from $840bil to $880bil. Currently at the high for the year. Will move slightly higher, but falls from peak in Q3. 2023 is currently down ytd 10%, will finish the year down 7%.
The big story is manufacturing construction spending. The average monthly expenditure on MNFG constr spending for the 4 years 2017-2020 averaged an annual rate of $78 billion, ending Dec’20 at $73bil. In 2021, spending was flat at $73bil. But by Dec’22, spending increased to $100bil. In the 1st 5mo of 2023, MNFG construction spending increased to an annual rate of $150bil.
8-12-23 Added this table, 2015-2025 Spending Inflation, Index, Constant 2019$
The path to constant volume starts with current spending. This table shows the progression of how we get there. Constant volume growth is what we compare to, for business volume or jobs growth.

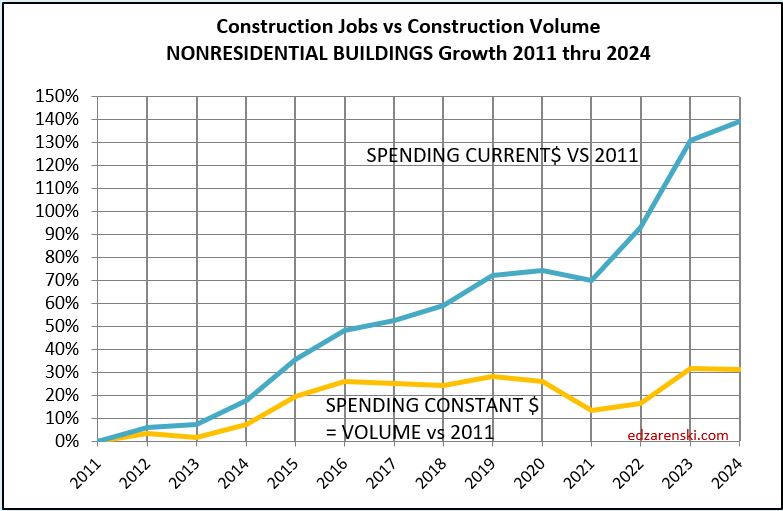
Construction JOBS continue to creep higher. From Apr’22 to Oct’22 jobs increased 1.5% but volume of work dropped 10%. Jobs and volume should track together as seen from 2011 to 2018. Since Oct’22, jobs up only 2% while volume up 7%. Volume catching up.


Construction spending, particularly nonresidential buildings, stalls for the 2nd half of 2023. Spending is up/dn thru year end, ending the year about where it is now. But by year-end, after taking out inflation, volume will be down 2%. In last 3 yrs, jobs seldom drop along with volume. I think jobs will not track volume down 2%, but finish 2023 about where they are now.
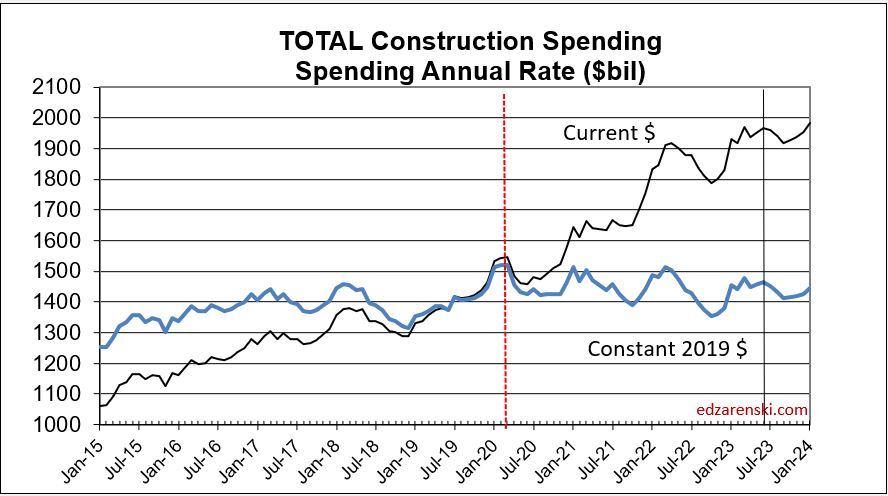
Construction Spending since Feb 2020 has increased (monthly SAAR Current $) $425bil, up 28%. But inflation increased $480bil (32%). Actual volume of work has decreased 3.5% or $55bil (monthly SAAR Constant 2019 $) since Feb 2020. The big decline in constant $ in 2020 and in 2021 is nonresidential buildings. The big decline in 2022 is residential.
PPI Data for June
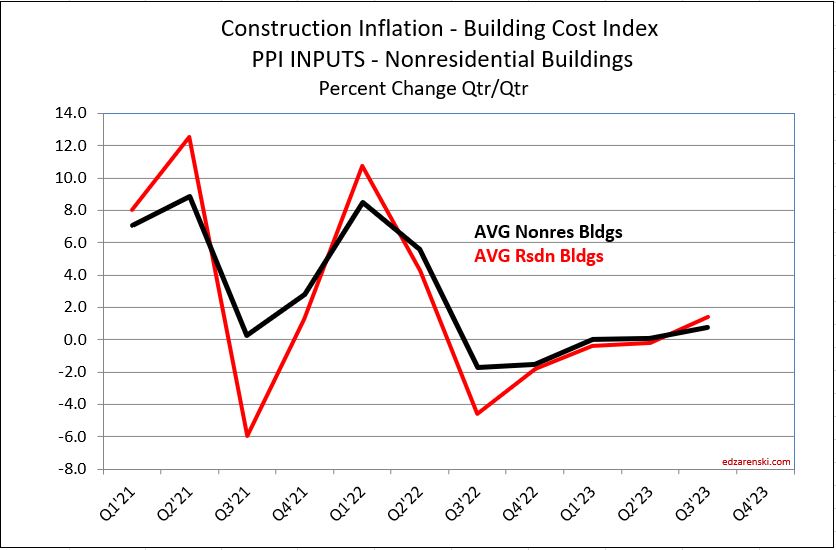
PPI Mtrl Inputs to Construction are up less than 0.1% in June, up less than 2% ytd. Cost of Inputs was up 30% over the last 2yrs. Year-to-date 2023 vs average 2022 Nonres Bldgs down 0.5%, Rsdn down 3.2%, Concrete products UP 10%-13%, Lumber/Plywood down 22%, Steel Products down 12%-15%, Diesel Fuel down 30%.
PPI Final Demand Construction for June, most Bldgs and Contractor costs peaked in March. 2nd qtr costs are not yet complete until July data gets released in mid-August. (The PPI Final costs is a three-month series that is corrected in data released for Jan, Apr, Jul and Oct.) Most costs are down 1% since Jan. Current avg all Bldgs and Trades cost are up 9% from avg 2022, but costs are headed down.
PPI INPUT TABLES UPDATED 10-13-23
The last column, YTD vs 2022avg, gives an indication of 2023 avg if current YTD costs remain constant for the remainder of the year. However, Inputs to Nonres Bldgs has been down 3 of last 4 qtrs. Res has been down 4 of last 5 qtrs. So it’s likely we will see some more downward pressure in the indices.

PPI FINAL DEMAND TABLE UPDATED 8-11-23
The PPI Final Demand index is a three-month series that is corrected in data released for Jan, Apr, Jul and Oct. Most Bldgs and Contractor costs peaked in March. With this PPI Final Demand Construction for July, 2nd qtr costs are now complete (with the July correction for MJJ). Most costs are down at least 1% since Jan. Current avg all Bldgs and Trades cost is up 8% from avg 2022, but costs are headed lower.
The Final Demand index posted declines for the two most recent adjustment months, Apr and Jul. If distributed back to the months being corrected, Apr into Feb and Mar, Jul into May and Jun, it shows all bldgs, except Office, have at least 6 months of declining cost. Office has been declining for only 3 months but Warehouse has been declining for 8 months. Buildings are down 1% to 3% so far this year.
The Avg Nonres Bldgs is down 1.4% in the last two quarters. And yet, if we hold the current index constant, keep it at today’s rate for the rest of the year, then the avg for 2023 will be up 7.8% from the avg 2022. I think, based on downward trend in costs, it will be lower than that at year end.

Speaking Engagement – ASPE
I’ll be presenting “Construction Economic Forecast 2021 – Behind the Headlines” at American Society of Professional Estimators annual summit on Friday Aug 27 in San Antonio (in-person)
https://aspenational.org/mpage/2021AnnualSummit…
there is virtual registration for this event
ARCHIVE – Construction Inflation Index Tables 2016 data
8-6-17 SEE ESCALATION / INFLATION INDICES For Current Updated Indices
10-24-16 original posted
1-27-17 updated index tables and plots
8-6-17 archived this for 1-27-17 2016 content – Linked Master Index Tables has updated data
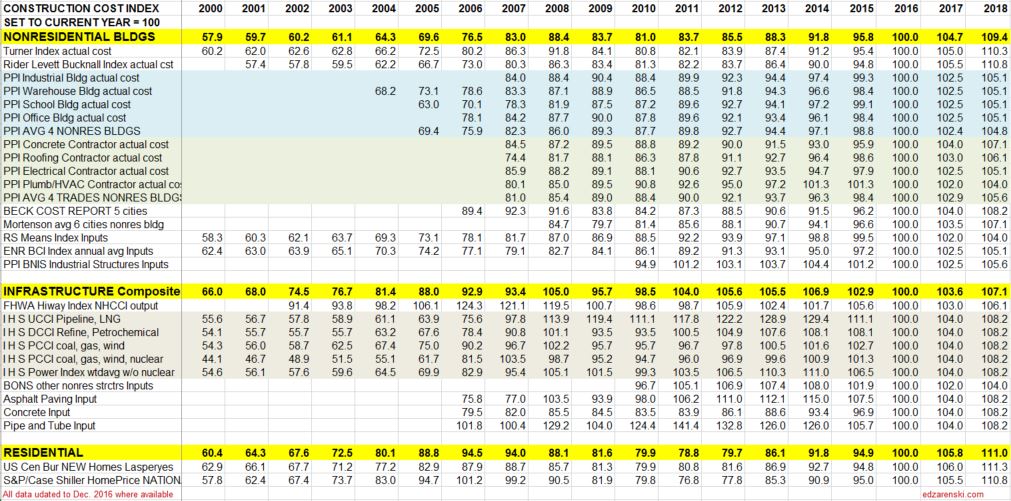
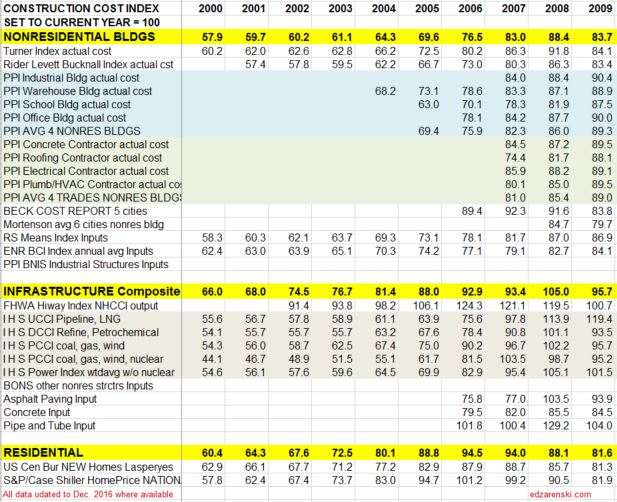
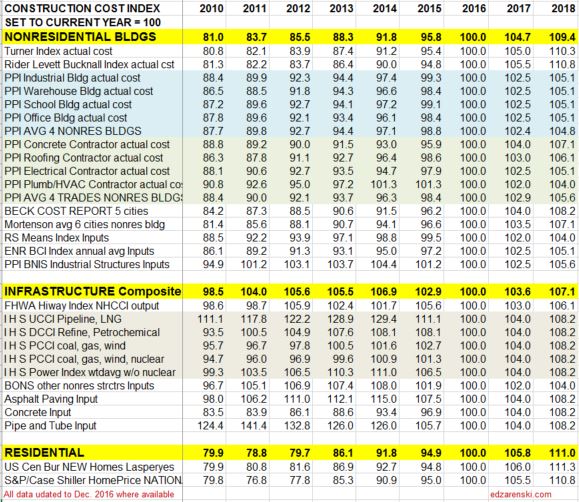
Construction Cost Indices come in many types: Final cost by specific building type; Final cost composite of buildings but still all within one major building sector; Final cost but across several major building sectors (ex., residential and nonresidential buildings); Input prices to subcontractors; Producer prices and Select market basket indices.
Residential, Nonresidential Buildings and Non-building Infrastructure Indices developed by Construction Analytics, (in BOLD CAPS), are sector specific selling price composite indices. These three indices represent whole building final cost and are plotted in Building Cost Index – Construction Inflation below and also plotted in the attached Midyear report link. They represent average or weighted average of what is considered the most representative cost indicators in each major building sector. For Non-building Infrastructure, however, in most instances it is better to use a specific index to the type of work.

Click Here for LINK to Cost Inflation Midyear Report 2016 – text on Current Inflation
All actual index values have been recorded from the source and then converted to current year 2016 = 100. That puts all the indices on the same baseline and measures everything to a recent point in time.
Not all indices cover all years. For instance the PPI nonresidential buildings indices only go back to years 2004-2007, the years in which they were created.
SEE Construction Inflation Index Tables For 2017 Tables
SEE BELOW FOR LARGER IMAGE
When construction is very actively growing, total construction costs typically increase more rapidly than the net cost of labor and materials. In active markets overhead and profit margins increase in response to increased demand. When construction activity is declining, construction cost increases slow or may even turn to negative, due to reductions in overhead and profit margins, even though labor and material costs may still be increasing.
Selling Price, by definition whole building actual final cost tracks the final cost of construction, which includes, in addition to costs of labor and materials and sales/use taxes, general contractor and sub-contractor overhead and profit. Selling price indices should be used to adjust project costs over time.
quoted from that article,

R S Means Index and ENR Building Cost Index (BCI) are examples of input indices. They do not measure the output price of the final cost of buildings. They measure the input prices paid by subcontractors for a fixed market basket of labor and materials used in constructing the building. These indices do not represent final cost so won’t be as accurate as selling price indices.
Turner Actual Cost Index nonresidential buildings only, final cost of building
Rider Levett Bucknall Actual Cost Index in RLB Publications nonresidential buildings only, final cost of building, selling price
IHS Power Plant Cost Indices specific infrastructure only, final cost indices
- IHS UCCI tracks construction of onshore, offshore, pipeline and LNG projects
- IHS DCCI tracks construction of refining and petrochemical construction projects
- IHS PCCI tracks construction of coal, gas, wind and nuclear power generation plants
Bureau of Labor Statistics Producer Price Index only specific PPI building indices reflect final cost of building. PPI cost of materials is price at producer level. The PPIs that constitute Table 9 measure changes in net selling prices for materials and supplies typically sold to the construction sector. Specific Building PPI Indices are Final Demand or Selling Price indices.
PPI Materials and Supply Inputs to Construction Industries
PPI Nonresidential Building Construction Sector — Contractors
PPI Nonresidential Building Types
PPI BONS Other Nonresidential Structures includes water and sewer lines and structures; oil and gas pipelines; power and communication lines and structures; highway, street, and bridge construction; and airport runway, dam, dock, tunnel, and flood control construction.
National Highway Construction Cost Index (NHCCI) final cost index, specific to highway and road work only.
S&P/Case-Shiller National Home Price Index history final cost as-sold index but includes sale of both new and existing homes, so is an indicator of price movement but should not be used solely to adjust cost of new residential construction
US Census Constant Quality (Laspeyres) Price Index SF Houses Under Construction final cost index, this index adjusts to hold the build component quality and size of a new home constant from year to year to give a more accurate comparison of real cost inflation
Beck Biannual Cost Report develops indices for only five major cities and average. The indices may be a composite of residential and nonresidential buildings. It can be used as an indicator of the direction of cost but should not be used to adjust the cost in either of these two sectors.
Mortenson Cost Index is the estimated cost of a representative nonresidential building priced in six major cities and average.
Other Indices not included here:
Consumer Price Index (CPI) issued by U.S. Gov. Bureau of Labor Statistics. Monthly data on changes in the prices paid by urban consumers for a representative basket of goods and services, including food, transportation, medical care, apparel, recreation, housing. This index in not related at all to construction and should never be used to adjust construction pricing.
Leland Saylor Cost Index Clear definition of this index could not be found, however detailed input appears to represent buildings and does reference subcontractor pricing. But it could not be determined if this is a selling price index.
Sierra West Construction Cost Index is identified as a selling price index but may be specific to California. This index may be a composite of several sectors. No online source of the index could be found, but it is published in Engineering News Record magazine in the quarterly cost report update.
Vermeulens Construction Cost Index can be found here. It is described as a bid price index, which is a selling price index, for Institutional/Commercial/Industrial projects. That would be a nonresidential buildings sector index. No data table is available, but a plot of the VCCI is available on the website. Some interpolation would be required to capture precise annual values from the plot. The site provides good information.
The Bureau of Reclamation Construction Cost Trends comprehensive indexes for about 30 different types of infrastructure work including dams, pipelines, transmission lines, tunnels, roads and bridges. 1984 to present.
Click Here for Link to Construction Cost Inflation – Midyear Report 2016
1-27-17 – Index updated to Dec. 2016 data
8-6-17 SEE Construction Inflation Index Tables For Updated 2017 Indices
Running Times
At age 30, I couldn’t run a 7 minute mile.
I was a pretty good runner in high school and college, but really didn’t come into my own until later in life. It wasn’t until I practiced proper nutrition and learned how to train that things really came together. All of my best post high school times were in my 40s. In fact, age adjusted, all the best times of my life were in my 40s. This should give you some perspective. You are not on the downhill when you hit 40. You have years of potential in front of you. I’d like to set a challenge for some of my younger friends. You can do what ever you want. Set goals. Break your own records.
41 – 1 mile 4:41.7 2nd 40-49 Boston, Northeastern Track USATF NE
43 – 3000m 9:24.2 Boston, Northeastern Track USATFNE 5:02 mile
41 – 4 mile 21:20 2nd 40-49 Arnold Mills July4 Cumberland RI 5:20 mile
41 – 8k (4.97mi) 27:40 3rd team 40-49 National XC Champ Franklin Park 5:34
43 – 8.1 mile 45:08 1st master 40-49 Harvey’s Lake PA 5:34
40 – 10mi 55:13 11th, 1st 40-49 Narragansett RI Blessing of the Fleet 5:31
42 – 13.1mi 72:53 11th 40-49 New Bedford MA Half Marathon NE Champ. 5:34
45 – 20mi mark in marathon 2:00:08 at Burlington Vermont marathon 6:00 mile
45 – 26.2mi marathon 2:41:17 2nd master Burlington Vermont marathon 6:07
Welcome to my Construction Economics blog
Welcome to my new blog. Here I will expand on current issues of construction economics. On Twitter @edzarenski, I will tweet updates to my most recent Construction Economic report and out of necessity I will keep it short. When issues demand further explanation, you will find it here. Thanks for visiting. edz
