Home » Behind the Headlines
Category Archives: Behind the Headlines
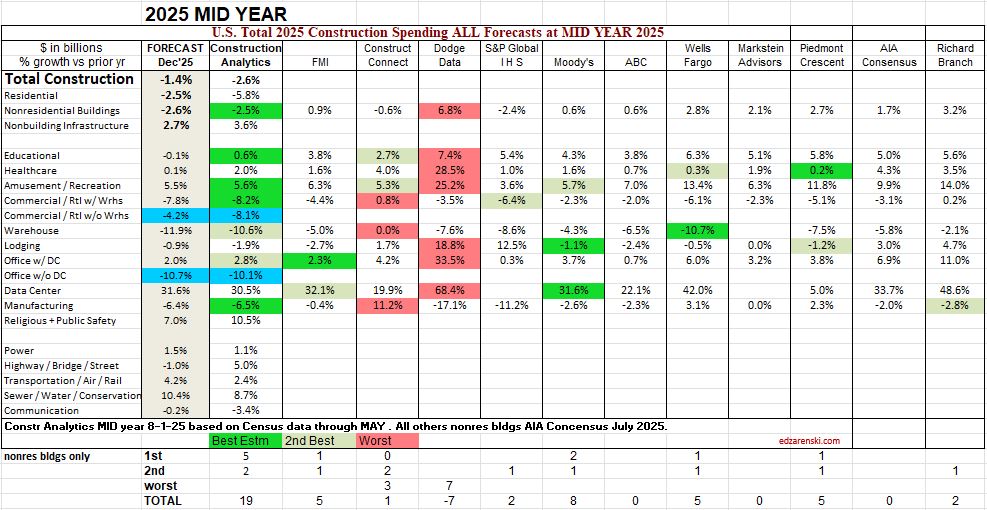
My Midyear’25 Forecast Compared to AIA Consensus
This is a simple list compiled of the percent growth forecast by each firm at Mid year 2025, then compared to the final outcome at year end. It’s a “How’d we do? comparison. The column titled Forecast’25 is the year-to-date spending through Dec. reported by Census 2-28-26, or in essence, the 1st look at final spending for 2025, the number all forecasters are trying to predict. There will still be minor revisions to this number.
To get an idea of how each firm’s forecast compares, I scored 3 points for closest forecast to actual, 2 points for 2nd closest and minus 1 point for worst forecast. Only Nonresidential Bldgs is counted here. We always see the forecasts published. We seldom, if ever, see the final outcome published.
You can search this website (search for the word Compared) for the outcome results for the last 6 years. Construction Analytics, by far, has proven to post the best forecasts. Not always, but more often than any others, particularly in the Midyear forecast where Construction Analytics, out of six years, has three of the best and two of the 2nd best forecasts.
AIA Consensus did not report Commercial/Retail w/o Warehouse, nor Office w/o Data Center. Construction Analytics did not report Comm/Rtl w/Warehouse nor Office w/Data Center, but those values were available in the file data and are shown here for comparison. The two items highlighted in blue are not used in the score.
Forecasting in a Shutdown
10-7-25 It sure doesn’t help forecasters when we can’t get fresh data. So how can we forecast when there is no current data forthcoming?
One of the data sets that my forecasting models are set to calculate is annual forecast on smaller sets of data within the year. For example: The Total Spending SAAR average for the months of AMJJAS (Apr thru Sept) when extended for a full 12 months, predicts the annual spending within +/- 1%. This calculation has been within this 1% limit 22 times in 24 years (think Drake Maye accuracy here). The other 2 years were off by 1.1% and 2.2% (in 2020). And unfortunately, we don’t have August or September data.
The last actual data we have is July. For Nonresidential Bldgs, the average predicted from AMJJ (Apr thru July) predicted the annual total Nonres Bldgs spending within 1.8% 13 out of the last 14 years (2011 to 2024), with one year being 2.6%. The average of those 14 years is less than 1% off from the actual.
This is not a simple average. Each month produces a different share of annual spending. For ex: Based on 20-year averages, January and February each produce only about 7% of annual Nonres Bldgs spending while June and July produce each about 9% of annual spending. When a small set of data is used, the spending in each of those months is compared to the 20-yr average for those months and projected out to get 100% or a full 12 months of spending.
The small data set of AMJJ, when used to predict 2025 Nonres Bldgs spending, forecasts +/- 0.9% or $730bil to $756bil. The average predicts spending on Nonres Bldgs will hit $743bil. My current forecast, which includes actual data thru July and forecast to year end, predicts spending will hit $749bil.
Residential spending, based on small data set is between $882bil and $920bil., with the average predicting $901bil. My current forecast with all actual data from Jan thru July and forecast thru year end is $892bil.
The best small data set predictor is having data for AMJJAS. This predicts total spending will come in between $2109bil and $2149bil, with the average for the year at $2133bil. My current forecast predicts spending for 2025 will total $2140bil.
Generally, I look at these small data set calculations to insure I haven’t made some kind of blunder in my forecast. In this case, the small data set gives some comfort level that the annual forecast, although based on only 7 months of actual data, may not be very far off from what to expect at year end.
Construction Briefs Sept 2025
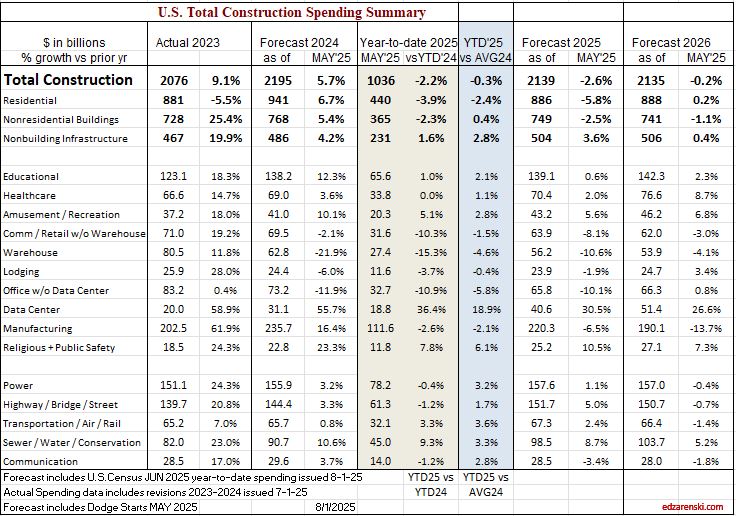
The headline construction data is the year-to-date (ytd) comparison. Through July data, ytd2025 is -2.2% compared to ytd2024. But where is it headed. Watch for this. Last year spending was increasing until it peaked in October. This year spending is falling and will continue to fall into Q3. Every month now the ytd spread gets worse, because 2025 is decreasing and 2024 was increasing. It’s significant in residential which is currently thru July down YTD 4.0% and is forecast to finish 2025 down 5.2%.
Construction Spending is down 7 out of the last 9mo, now down -3.5% or an inflation adjusted total -6.5% since October. Over that period spending is down most significantly in Residential. Residential spending peaked in October 2024. Since then it’s down 10% ($90bil). Warehouse is down -12% ($8bil). Manufacturing is down only 6% but that is $15bil. Manufacturing is experiencing the tail end of a huge volume of work that peaked also in Oct., 2024. It is expected to continue on a slowly declining spending slope for at least the next year. Spending is up the most now in Data Centers, on track to gain 32% (+$10bil) in 2025 and 31% ($13bil) in 2026.
When spending is up by just a little it looks like we are making progress. But we are always fighting inflation. If spending is up by 3% but inflation is 4%, then real business volume declined by 1%. If spending is down 5%, with 3% to 4% inflation, business volume is down 8% to 9%.
Overall, business is declining. The current data in the table below indicates constant$ spending, or business volume, drops for the next three years.

Do not overlook the impact of inflation. Residential spending for 2025 may end down only 5.2% but spending includes inflation of 4.7%. When real residential volume is compared to real volume in 2024 we find that residential volume of business declined 9.1% in 2025. This happened also in 2023, then not since 2009, when it fell 24%. Let that sink in! Residential business volume in 2025 is forecast down almost 10% ($85bil). Since the most recent peak spending in 2022, residential volume is down almost 15%, (~$150bil).

Since 2011, (excluding recession yrs) construction jobs thru Aug increased on average by 150,000 over the 8mo. For 2025, jobs thru Jul increased only 6,000, the slowest jobs growth (ex recessions) in 50 years. Residential construction jobs peaked in Sep’24. Spending was near the May peak from August to December. Since then, spending has been falling and will continue to fall. Rsdn jobs have fallen 7 out of the last 10 months. Rsdn jobs are down 1% ytd. Nonresidential and Nonbuilding jobs are both increasing slightly. The outlook for 2025 has construction jobs falling by 40,000. Jobs are expected to fall even more in 2026.


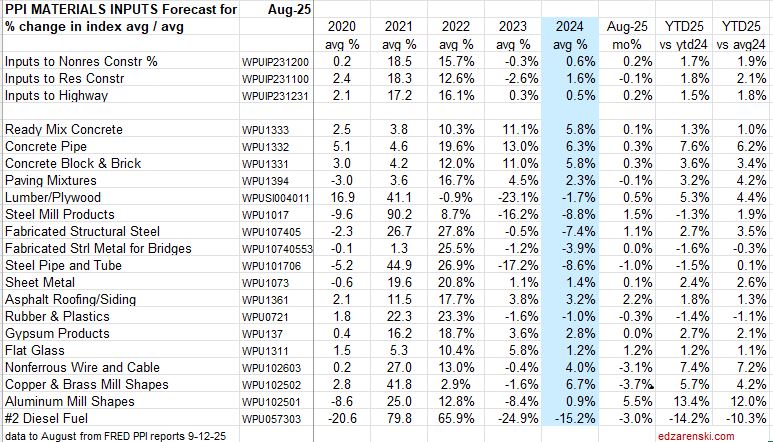
While many of the construction cost items in the PPI are tame so far, there are a few that have outsized gains. PPI YTD thru Aug vs the 2024 avg Conc Pipe +6.2%, Lumber/Plywd +4.4%, Fab Str Steel +3.5%, Nonferrous wire +7.2%, Alum Shapes +12%, Diesel -10.3%.
Final Demand pricing for Nonres Bldgs holding down at 2% or lower. Construction Analytics inflation rate for 2025, which includes inputs from eight sources, is 4.4%.
Remember, the PPI does not track imports or tariffs.

Construction Briefs Aug 2025
The biggest story in construction data right now is jobs.
Average construction jobs growth through July, last 25 years, excluding recessions, +130,000.
Average construction jobs growth through July, last 10 years, excluding recessions, +140,000.
2025 Construction Jobs growth through July, +21,000.
Not so surprising, as the Constant $ construction spending through July is down -5.7%, (compared to same months previous year), steepest decline since 2011, which was the end of the great recession. Constant $ (inflation adjusted) construction spending is now back to early 2022 level.
Construction Spending is down 5 of the last 6mo, now down a total -3.0% from Dec. Over that period spending is down most significantly in Residential, Manufacturing and Commercial w/o Warehouse. It’s up the most in Data Centers, Highway and Public Utilities. Overall, business is declining.


Construction Spending inflation adjusted is forecast to drop slightly every month for the rest of the year. Expect constant $ spending at year end down -6.3% from 2024. Uncertainty over tariffs and funding subsidies has slowed decision making on planning and moving new projects forward to construction. This is not an environment to expect jobs growth.
If jobs were to move at the same rate as business volume, with 2025 construction spending in constant$ expected to fall -6.3%, then jobs would be expected to fall -6.3%. That’s 500,000 jobs. The only times we’ve ever lost 500,000 jobs in a year was in both 2009 and 2010. In those years, after falling 17% in the previous 3 years, business volume dropped another 12% and 10% respectively.

Residential construction jobs peaked last September and are now down 1% or 35,000 jobs since then. In Constant $, residential spending is down 10% since last September. Jobs never move at the same rate as spending. This has a significant impact on productivity.
Data Centers are the bright spot in construction spending, up 17% since December and forecast to finish the year up 30%, an increase of +$10bil.

Biggest forecast declines in Current$ construction spending: Residential -5.8% (by far largest $ decline, -$55bil); Manufacturing – 6.5%, -$15bil; Warehouse -10%, -$7bil; Office (ex Data Centers) -10%, -$7bil; Comm Retail (ex Warehouse) -8%, -$6bil.
Manufacturing spending is now receding from an astronomical high. From 2019 through 2021 spending was averaging $80bil/yr. In 2024 it reached an average of $235bil, and peaked in Oct at $244bil. In June it was only $223bil and it’s expected forecast for 2025 is down -6.5% from 2024, but that is still a very high $220bil.

Construction Briefs July 2025
Construction Spending is down in each of last 5mo, now down a total -2.4% from Dec. Biggest declines are Warehouse -7.7%, Commercial w/o Wrhse -4.6%, Office w/o Data Centers -4.3%, Residential -4.2%, Transportation -3.7% and Manufacturing -3.5%.
Residential posted the biggest $ rate drop, -$40bil SAAR since Dec.
Data Centers are up 9% in 5mo, but last year DC were up 56%, increasing 15% in the 4th qtr alone. The rate of growth has slowed from near 4%/mo in the 2nd half 2024 to less than 2%/mo in the 1st 5mo 2025.
With this issue of May Construction Spending, Census revised all data back through 2023. Total spending was revised UP $52bil in 2023 and $39bil in 2024. Due to the increase in 2024, all percent growth in 2025 is slightly lower. The largest revisions up in 2024 were Residential +$11bil, Educational +$8bil and Power +$8bil. Also, in 2023, Power was revised up +$17bil and Manufacturing +$9bil.
Office vacancy rates are very high, near 20%, and in some places, like San Francisco, about double that. It’s hard to see that office construction will increase anytime soon. Office construction spending has declined every month for the last 10 months and is down 10% compared to the same 5mo 2024.
Construction Briefs June 2025
Construction Spending Explained
- New Starts + Existing Backlog generate Spending
- Spending = Revenue
- Revenue includes inflation which adds nothing to volume
- Revenue – Inflation = Business Volume
Construction spending fell slightly in April, down 0.4% from March. Spending has fallen slightly each of the last 3 months, but total spending is still at/near an all-time high with the seasonal rate at $2,200 billion. The forecast predicts spending will increase to 3% growth by year end.
Construction Forecast Update – Data Centers shows the largest % growth for 2025, forecast +33%. Manufacturing is still the largest $ contributor ($223bil/yr) to nonresidential bldgs total spending ($772bil/yr), but has fallen 6% in the last 5 months.
Peak manufacturing construction spending was posted from Sep thru Dec 2024. The avg of 1st 4mo of 2025 is down 4% from that peak. By Q4’25, avg spending will be down 10% from peak.
BTW, this is totally normal. We are beginning the tail end of an above normal huge influx of new manufacturing projects that started over the last 3 years, and the spending curve is beginning the downhill slope. Spending will continue to fall for the next 3yrs.
Data Center construction spending has not yet hit peak. Data Centers are continuing on a phenomenal streak of +45% growth in 2023 and +56% in 2024 and now 33% in 2025. The avg of 1st 4mo of 2025 is up 39% from same 4mo 2024. Spending will finish the year almost 20% higher than today. 2025 forecast +33% over 2024. Currently projecting peak spending end of 2027, or later.
Headwinds could slow new starts growth. Many economists predict current trade impacts will slow overall economic growth. That in turn could slow capital expenditures, which, in this case, is new construction starts.
Any capex pause could reduce all Data Center numbers. However, starts are up 400% since 2020 and could finish 2025 up 500%. Would take a lot of canceling or delaying to collapse these numbers. (This is going to first appear in construction starts, “firms pausing or delaying capex.” It’s already started with Data Center).
What’s propping up construction spending growth? Here’s the top growth markets.
- Market——1yr/%/$ growth ——3yr growth
- Educational 1yr/+8%/+$10bil +3yr/+30%/+$30bil
- Data Centers +56%/+$10bil +286%/+$18bil
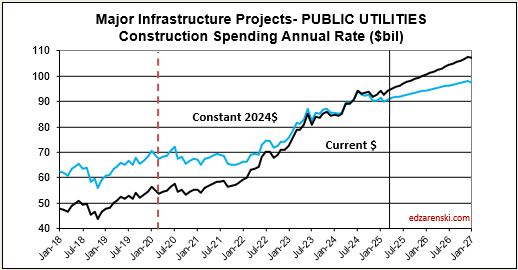
- Public Utilities +11%/+$9bil +58%/+$38bil
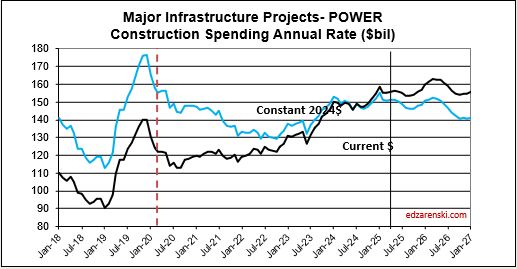
- Power +10%/+$14bil +24%/+$29bil
- Highway +4%/+$6bil +40%/+$40bil
Data Centers far and away takes the prize for highest % growth, but Data Centers is only 1.7% of all construction spending. Power is 7%, Highway is 6.6%, Educ is 6.3%, Pub Util is 4.4%
Manufacturing is notably absent from the above list, because after 3 outstanding years, Mnfg is no longer contributing growth. Mnfg spending is beginning to taper off. Mnfg is 9.3% of construction spending. The only market over the last year, or 2 or 3 years, with more $ spending than Manufacturing is Residential.
Mnfg 1yr/+20%/+$39bil 3yr/+284%/+$150bil
Mnfg 2025 forecast -10%/-$24bil


What’s holding spending growth back?


6-17-25 When May construction starts are reported later this month, I’m expecting an overall decline and a lower forecast. There are already reports of pauses in manufacturing facilities and data centers. Hiway and Public Utilities are probably immune from cuts but Power may see some reductions. Education and Healthcare are questions. Residential construction expected down slightly. Housing permits continued a downhill trend in April for the fourth month in a row. KB and Lennar report market pricing is down slightly. # of homes on the market is increasing.
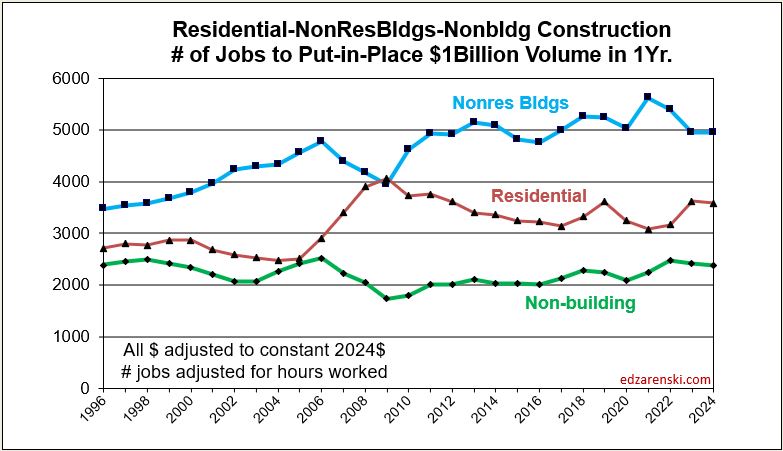
This next plot shows the number of workers required to put-in-place $1 billion of construction in 1 year. Except for Nonbldg Infra, which has remained relatively flat over time, it requires more jobs to put-in-place $1bil today than it did 10 years or 20 years ago. Total construction workforce (8,300,000) divided by # of billions$ put-in-place (2,200 billions$/yr) is the simplest way to show the decline in construction productivity. Results here broken out for major sectors.
Construction Jobs Total hours worked peaked in March, now down 0.4%. For May, jobs increased by 4,000 (<0.1%), but unemployment dropped from 5.6% to 3.5% (175,000). That would mean that 171,000 workers dropped out of the workforce.

Steel Tariffs 50%
50% of nonres bldgs are structural steel. Str Stl is 10% of total bldg final cost. Nonres bldgs construction spending = $770bil/yr., $385bil on SS nonres bldgs., $38.5bil on str stl
Struct Steel material is only 25% of steel total contract cost, so 38.5 x 25% = only $9.6 bil is mtrl used in SS nonres bldgs. So at 50% tariff = $4.8bil added cost to nonres bldgs total spending. (This assumes ALL steel increases in cost).
Above is structural steel only. When including all other steel used in a building, (rebar, studs, frames, etc), steel is 15% of total bldg cost. So added cost would be $7.7bil.
And that is just nonres bldgs. MF Rsdn uses a little steel, but Nonbldg markets, Power, Highway, Transport, Pub Util adds about another $5bil.
So, steel tariffs, IF ALL STEEL WERE TO INCREASE, adds inflation to total Nonres Bldgs and Nonbldg. Half of all Nonres Bldgs use structural steel, so inflation to SS bldgs is 4.8/385, or 1.25% on structural steel bldgs. If looking at the macro view, inflation over the nonres bldg sector, then the $4.8bil increase would be divided by the total nonres spending, or 4.8/770 = 0.625%. All other bldg steel, applied to all nonres bldgs, added another 2.9/770 = 0.4%
Nonbldg Infrastructure markets, if it is a SS building, add the same 1.25% + 0.4%. But Public Works and especially Bridge construction can add significantly more. If domestic producers also raise pricing to follow suit with tariffs, as expected, this is what happens to total Nonres inflation.
US imports 30% of steel it uses. 40% of all steel is used in construction. If 30% is balanced across all types of steel, then 30% of constr steel is imported. (It would take some concentrated effort to determine % imports for each of the individual steel uses.) IF ONLY IMPORTED STEEL WERE TO INCREASE and no domestic manufacturers raise prices, 30% of building steel increases in cost. That is not likely at all. But if so, tariffs would add only 0.4% to nonres bldgs and about 0.1% for all other steel.
Construction Forecast Update May 2025
The total construction spending forecast, now at $2,237bil, +3.7% vs. 2024, has been lowered a bit since the Outlook in Feb. ($2,272bil, +5.5%). Most of the reduction is in Residential, from $997bil, +7.2% down to $958bil, +3.0%. Nonres Bldgs was reduced by $11bil and Nonbldg increased by $7bil. Compared to the average for the year 2024, current total spending YTD is up 2.6%, but is expected to pick a little up throughout the year across all sectors.

Constant $ growth is forecast down 0.7% in 2025 and down more after that. Inflation Index shows annual percent and index to base 2024 = 100. All years, current spending / index = reported as constant 2024$, as if all constant years are the same 2024$.

Residential Single Family spending has been in a range +/- 2.5% for the last 7 months. With only a few months lower than that, this range extends back 18 months. Take out 3%/yr inflation and you can see that SF volume has been flat to down. Multi-family spending, for the last 12 months, is down 15% off recent highs in Q1’24. Reno/repair spending extended recent highs across 5 months in mid 2024, before falling off 10% in Q4, and now, in Q1’25 it has gained back most of that drop. Any spending gains in the near future would be driven by multi-family.
Manufacturing is still the largest $ contributor ($222bil/yr) to nonresidential bldgs total spending ($772bil/yr), but has fallen 6% in the last 5 months. The trend is down in most months for 2025 and down in 2026. This decline is entirely expected and you can read about it in my article, The Manufacturing Taper.
Data Centers shows the largest % spending growth for 2025, forecast +39%, continuing on a phenomenal streak of +45% in 2023 and +56% in 2024. Data Center starts increased 300% over the previous 3 yrs. and still increase in 2025 and 2026, but at a slower rate of growth. Manufacturing spending peaked in Oct’24. Data Center spending continues to increase for the next few years. Both of these forecasts take into account some cancelations or delays announced recently (see May Briefs), however do not account for any major stoppages due to recent trade impacts.
The largest $ increases in spending are Power, forecast to increase +$16bil, and Highway +$13bil. Educational spending is forecast to post the largest nonres bldgs $ growth in 2025 (+$12bil, +9%). Data Centers increase $10bil.
This same scenario that looks to occur in Manufacturing will occur also in Highway/Bridge. Normal starts were about $100bil/yr, with slow growth. But for the last 3 years, actual starts totaled closer to $500bil for the 3 years or $167bil/yr. This strong growth in starts is expected to continue at least into 2025, totaling near $650bil for 4 years. Again, consider that part of that is inflation, but the remainder is government investment growth. So a decline from the taper back to normal for Highway/Bridge may not show up at least for the next few years. But once the taper begins it will have the same effect on Nonbldg Infrastructure spending that we will see from Mnfg in Nonres Bldgs.
Typical jobs growth is 2.5% to 3.5% per year, even though spending can sometimes far outpace that. But jobs growth doesn’t track spending, it tracks volume growth. Volume is spending minus inflation. For example, for the 4 years 2021 thru 2024, spending increased 44%. But inflation increased 33%. Volume growth was only 11%. Jobs increased 12.5%. For 2025, Inflation will outpace spending growth by 1%, but jobs are still expected to increase by 1.5%. Rarely do jobs decrease. That could change.
There are 870K construction jobs in TX. 500K are immigrants and 300K are undocumented.

New starts are forecast up in 2025, but I would caution there are a lot of headwinds that could slow new starts growth. Many economists predict the current trade impacts will slow overall economic growth. That in turn could slow capital expenditures, which, in this case, is new construction starts. So far year-to-date, spending is outpacing new starts growth. That means backlog is decreasing, mostly in nonresidential buildings. We haven’t seen a decrease in Nonres Bldgs backlog since pre-2011. Residential backlog is down slightly. Nonbuilding is increasing.
See Also Construction Briefs May 2025
and Construction Briefs Apr 2025
5-15-25 all ppi DATA UPDATED TO APR See Construction Inflation 2025
I’ve increased the inflation outlook since Feb to a range of 4.5% to 5%. Inflation may be the most uncertain of all factors affecting construction this year. We have yet to see any significant impact from tariffs, and there is sure to be impacts to many construction inputs. We may not know the total impact for several more months. But I would expect, if anything, inflation will go up from here, not down.
The bees are swarming the flowers outside. At least some lifeform is content and at peace with this world.
Construction Briefs May 2025
For the 9th consecutive year, I will be speaking at Advancing Preconstruction. I will be opening the program May 22 to the plenary session with a summary of the current and expected economic conditions affecting everyone involved in construction, all geared towards one word, RISK.
Construction Spending Q1’25 vs Q4’24 notable Q/Q increases: Education, Healthcare, Amusement/Recreation and Communication are all up 2% to 3%. Highway is up+4.9%, Data Centers +5.4%, Warehouse +7.5% and Lodging +8.3%.
Construction Spending for March is down 0.5% from Feb, but that’s because Feb was revised UP by 0.5%. Jan also revised up 0.66%. YTD Total vs Jan-Mar 2024 is up 2.8% YTD. Data Centers vs Jan-Mar 2024 is up 40%.
Construction Spending Q1’25 vs Q4’24 is UP in every category except Residential, Commercial/Retail w/o Warehouse and Manufacturing (Mnfg was expected). Residential and Comm/Rtl are down only a slight 0.2% and 0.4%. Manufacturing is down 4.7% Q1vQ4. This is the beginning of the Manufacturing spending taper as early projects come to an end. I described that taper here. The Manufacturing Spending Taper
Not seeing any major indications in spending due to tariffs yet. Still early in the data (thru Mar) for that.
Construction Jobs increased 11,000 in April. However, hours worked dropped by 0.6%. Total workforce hours worked declined by an equivalent of 50,000 jobs. Jobs are now at 8,316,000, an all-time high. Jobs are up 27k year-to-date, the slowest growth for the 1st 4 months since 2012 (excld 2020). Although hours worked fell in April, total workforce hours worked increased 2.1% over same 4mo 2024. Average yr/yr growth for Jan-Apr hours worked is 3.7% for the last 10 yrs (ex 2020).
J P Morgan expects imports from China to fall 75%-80% in the 2nd half of the year. Total all imports from all sources are expected down 20%. Some products are going to become unavailable.
The U.S. imports about 30 million metric tons, about 30% of total steel used, of all types of steel annually. The U.S. imports about 6 million metric tons of steel pipe annually. Approx 2/3rds of steel pipe used annually in the U.S. is imported. If the U.S. loses its imports of steel pipe, we can’t support as many building projects. Pipe here refers to pipe and tube. That includes things like gas and oil pipelines, water pipe, steel conduit and structural square/rectangular tube sections (Trump’s Wall).
What’s frustrating this week is all the latest construction spending and jobs data just came out, and everyone wants to know, What’s the impact on the forecast?, and none of the data reflects tariff impacts or potential slowdowns. Spending is thru Mar31 and jobs are thru Apr12. Some of the inflation data is 1 to 2 quarters behind.
I am expecting, when I prepare the Midyear Forecast, that spending projections will go down, perhaps 1% to 3%, and inflation projections will go up. Currently, I’m carrying inflation between 4%-5%. Owner’s may slow or even cancel capital expenditures and material prices are broadly expected to increase.
When PPI data is released May12, that will be thru April. But remember, PPI data is domestic products only. So any inflation in the PPI data is domestic suppliers adjusting pricing to reflect pricing similar to expected increases to match imports. We might begin to see our first clues of tariff impacts/demand when the next construction starts data gets released around the end of May. How much in previous starts have been canceled/delayed? We already know of some chip plants and data centers canceled/delayed.
Construction – What to Watch: Cost to build going up; Cost to finance is up; Product availability in question; Product delivery schedule delays; Margins pressured; Small/Midsize firms squeezed; Labor let go/disappearing; Projects in planning, delayed; Project ROI not met; Projects planned, canceled.
I recommended (going back 6 yrs ago, but still relevant today) that every construction cost estimator is going to need to identify in every estimate/budget presented to an owner for every upcoming project, all items subject to price revision due to tariff. If you don’t you stand to lose your already meager profits.
I can’t even begin to know what to tell construction cost estimators to carry in budgets for increased cost due to tariffs and supply issues. Best I could suggest at this time is to carry an agreed allowance (IMO, better than contingencies), which can be visited at a later date and adjusted to actual cost. Contingencies are for unknown, unexpected, unidentified issues. Allowances are described in the basis of estimate for identified cost issues, but at unknown cost amounts. All allowances in any estimate/budget should be identified at conception with intent to revisit at later date to adjust to actual cost. (The most common allowance you may be familiar with is a rock allowance). Identify allowances up front and reach agreement on budgeted cost with all parties. This will make your contract administration go a lot smoother than trying to negotiate how much of the contingency you can use for a cost increase that was foreseen. The only unforeseen here is actual cost.
ABI – DMI – CBI Leading Construction Indicators
With exception of residential, which has short durations and for which backlog is always only about 30%-35% of previous yr revenues, for all other work, never (since 2010) was backlog shown to be less than the previous yr spending. https://edzarenski.com/2021/05/01/abi-dmi-cbi-leading-indicators/
Construction Backlog, all work under contract yet to be put-in-place, usually extends out 2 to 3 years. Backlog changes only IF new starts are greater than spending in the month, backlog goes UP. If new starts are less than spending, backlog goes DOWN. Subtract canceled projects from starts causes backlog to go down, but delays are are just moved out in time, so are still in backlog.
PPI INPUTS Q1 vs avg 2024: to Nonres Bldgs +0.9%, to Residential +1.15%, to Highway +1.0%. All these being near 1% for Q1, if growth is constant, would be near 4% for the year. Big IF! Paving mixtures +11% in Q1, Lumber Plywood +4.5%, Fab Str Steel +0.03%, Fab Str Stl Bridges -1.1%, #2 Diesel Fuel -9.6%, Steel Pipe and Tube -3.85%, Nonferrous Wire and Cable +1.8%, Copper and Brass Mill Shapes +4.7%, Aluminum Mill Shapes +7.5%.
PPI Final Demand 1st 3mo vs avg 2024: Avg Nonres Bldgs +1.3%, Educational +1.6%, Healthcare +2.7%, Roofing Contractor + 2.8%, Avg 4 trades +1.7%. Your monthly reminder, although this index is posted monthly, it is corrected quarterly. April data is the correction month for Q1.
New home construction costs have risen about 3% in the last year, from lumber down 4% to concrete up 6%, per JBREC. The US Census Constant Value Rsdn Index is up 3.5% for the 1st 3 months 2025.
The Biden admin supported the construction $200 billion in new manufacturing facilities that began in 2022 and is now tapering down. It will take a lot of jobs to fill those facilities. But will jobs grow in the current economic environment?
Just about anything that can be considered a leading indicator is pointing down. Layoffs, container ship projected offloads are down and falling, China cut shipping to US, supply chains disrupted, immigrant fears affecting labor. Expect costs up, workload down, labor tight.
I’ve been asked, Why don’t you use AI to develop economic analysis? Artificial Intelligence sometimes gets analysis really wrong. There is some percentage (40%?, 60%?) of end results that AI creates that is literally just made up. If you were to use AI to develop forecasts and analysis of construction data, without having a thorough knowledge of the data and an ability to recognize when it’s meaningful, or garbage, then how would you know when AI is right or wrong. Understand your data well enough to know when your analysis makes sense. For my part, I’d rather spend my time understanding the data and the analysis then to spend it verifying if AI is producing realistic and meaningful output.
Summer is just around the corner. The Hummingbirds returned last week.
Building Connections Podcast Apr’25
Here’s a link to the podcast, Building Connections, of my interview with Rob Ryan, CEO of Twining, Inc. We discuss how I got to where I am today, why I provide a free blog on construction economics, who uses my data and what to expect from tariffs.
Construction Briefs Apr 2025
Tariff actions are not yet reflected in Feb PPI Inputs or PPI Final Demand index. Still early. Also remember, PPI does not include imports or tariffs on imports. When we do see movement in the PPI, it reflects domestic pricing decisions following on tariffs.
Lutnick: “Foreign goods may become a little more expensive, but domestic goods do not.” FALSE see next par.
PPI Excludes Imports/Tariffs. The 2018 steel tariffs of +25% applied on imported steel. However the 2018 PPI data shows that the cost of ALL DOMESTIC steel mill products (of all types) produced in the US increased 18% in 2018, after the steel tariffs were imposed.
If tariffs, for example, affect only 10% or 20% of products used in the industry, then the PPI shows us the domestic producers reaction to tariffs, which gets applied to the other 80% to 90% of product. For instance all steel is not imported, so not all steel will experience a tariff. The point here is that tariffs impact pricing decisions on all domestically produced products, not just the imported products. Consumers pay the price.
Impacts on Construction Inflation and Spending (guesstimates).
2021 inflation was 8%-14%. 2022 it was 12%-17%. Could 2025 repeat 2022? Yes. Will it? ??? I guess it hits 6%-10%.
I’m guessing some projects contributing to 2025 spending will be canceled/postponed. So maybe spending drops 5% from here, to zero growth. Construction spending annual growth is normally in the range 4% to 10%. 2025 and 2026 were both forecast at 5% to 7%. No doubt some projects will be canceled or mothballed. So the next 3 yrs spending gets reduced, and cost gets increased.
I’m beginning to think one of the first issues we have to deal with is supply shortages. All types of imported products are not going to be available, and there aren’t enough domestic products to replace them. This will add delays and cost to building projects.
Yeears ago, when I was a construction cost estimator, a major client would run numbers on a proposed new building project. If it couldn’t balance a ROI in 7 yrs, project would not move forward. As cost to build increases, it becomes harder to hit ROI. This supports that some projects may be canceled or postponed.
- Construction – What to Watch
- Cost to build going up
- Cost to finance is up
- Product availability in question
- Product delivery schedule delays
- Margins pressured
- Small/Midsize firms squeezed
- Labor let go/disappearing
- Projects in planning, delayed
- Project ROI not met
- Projects planned, canceled
Virginia has the largest concentration of Data Centers in the U.S. Virginia is projecting energy shortages due to the extreme demand DCs put on power grids. If you don’t build out the energy grid, the data centers put too great a demand on the current grid. “There are six states in the United States where data centres already consume over 10% of the electricity supply, with Virginia leading at 25%.” https://www.iea.org/reports/energy-and-ai/understanding-the-energy-ai-nexus
In the Q1 pre-tariff outlook, Data Center spending (SAAR), began the year 16% above the avg of 2024, is steadily climbing at 1.5% to 2%/mo., and sometimes more, is now up 22% vs avg 2024. By midyear the rate of spending will be up 28%. Data Center spending increased 45% in 2023 and 56% in 2024. Forecast for 2025 +37%. Obviously, this could get reduced if/when some projects get canceled.
The New Albany (Ohio) project, projected worth $1bil, is one of the two announced DC projects that have been halted https://www.nbc4i.com/news/local-news/licking-county/microsoft-pulls-out-of-licking-county-projects/
What if: A 10%/yr reduction in forecast new Data Center starts in 2025 and 2026 would result in reduced Data Center construction spending by -3% in 2025, -7% in 2026, -7% in 2027 and -3% in 2028.
What if: A 10%/yr reduction in forecast new Data Center starts in 2025 and 2026, combined with a 10% cancelation of 2024 starts, would result in reduced Data Center construction spending by -8% in 2025, -10% in 2026, -8% in 2027 and -3% in 2028. A 10% drop in Data Center spending is $4bil/yr.
It is not clear if the two halted projects mentioned in the article above were already committed construction starts or future proposed starts.
The Fed Chair just said what every credible economist, every economics textbook, and every empirical study shows: Tariffs reduce output and raise prices. – Justin Wolfers, Econ professor at Michigan, Senior fellow, Brookings and PIIE.
Let’s not forget what initiated growth in new manufacturing facilities. New manufacturing building contract starts over the last 3yrs is just over $600bil. Normal starts without government investment would be about $300bil over 3yrs. About $100bil of spending growth over the 3 years is inflation, leaving the remainder of about $200bil in spending growth attributed to government investment. All that began, and most of it got spent, under the previous administration. https://www.forbes.com/sites/courtneyfingar/2024/12/12/manufacturing-jobs-boom-arrives-too-late-for-biden-to-benefit/
Whenever we get an unusually large increase in new construction starts and spending, the tapering off of those projects leads to a decline on the tail end. Mnfg new starts peaked in 2022-2023. We are entering the period of the manufacturing construction spending taper. Mnfg spending has fallen slightly in 4 of the last 5 months. The forecast for 2025 is down -10%.
Microsoft has announced a pullback in spending on new Data Centers. Reduced demand negates need for new facilities, kills expansion plans, lowers new construction forecast, decreases jobs growth in construction. Mothball if partially built factory, not only expensive for owner, but also negative impact to contractor’s forecast revenues.
Whenever there’s a devastating natural disaster, causing destruction to homes, property and infrastructure, the supply of contractors, laborers and materials stays the same while demand skyrockets from victims trying to rebuild. Contractors generally pick more profitable projects over less lucrative ones.
In the Construction Analytics Outlook Feb 2025 report I said, “Don’t be surprised if 2025 construction jobs growth slows a bit. Jobs are slightly ahead of volume growth, particularly in the Non-building Infrastructure sector.”
Construction gained 19k (+0.2%) jobs in Feb, BUT total hours worked declined 0.3%. Total jobs have increased but Hrs worked has gone down the last 5 months. We’ve posted minor jobs gains in both Jan and Feb, and yet unemployment has gone up from 5.2% in Dec to 7.2% in Feb.
The March jobs report shows only minor gains in the # of jobs. We’ve added only 24,000 new jobs in the 1st quarter, the slowest 1st qtr jobs growth in 13 years (except for 2020, Covid). But hours worked in March increased by 1.5%. That acts on the entire 8.3 million workforce and is equivalent to adding 128,000 more jobs.
The jobs numbers reported April 4th cover the period from Feb15-Mar15. There are not yet any impacts from tariffs reflected in the jobs numbers.
We may see the term “force majeure” come up a lot in the near future. And if construction contracts don’t have a force majeure clause, there may be a lot of contractors in trouble.
My guess is if the people of Greenland take a vote to Join the United States, it would be 99-1 No. Of course, they would say “No, thank you.” As they so eloquently put it, “We’re not assholes.”
