Home » Behind the Headlines (Page 2)
Category Archives: Behind the Headlines
Construction Forecast Update May 2025
The total construction spending forecast, now at $2,237bil, +3.7% vs. 2024, has been lowered a bit since the Outlook in Feb. ($2,272bil, +5.5%). Most of the reduction is in Residential, from $997bil, +7.2% down to $958bil, +3.0%. Nonres Bldgs was reduced by $11bil and Nonbldg increased by $7bil. Compared to the average for the year 2024, current total spending YTD is up 2.6%, but is expected to pick a little up throughout the year across all sectors.

Constant $ growth is forecast down 0.7% in 2025 and down more after that. Inflation Index shows annual percent and index to base 2024 = 100. All years, current spending / index = reported as constant 2024$, as if all constant years are the same 2024$.

Residential Single Family spending has been in a range +/- 2.5% for the last 7 months. With only a few months lower than that, this range extends back 18 months. Take out 3%/yr inflation and you can see that SF volume has been flat to down. Multi-family spending, for the last 12 months, is down 15% off recent highs in Q1’24. Reno/repair spending extended recent highs across 5 months in mid 2024, before falling off 10% in Q4, and now, in Q1’25 it has gained back most of that drop. Any spending gains in the near future would be driven by multi-family.
Manufacturing is still the largest $ contributor ($222bil/yr) to nonresidential bldgs total spending ($772bil/yr), but has fallen 6% in the last 5 months. The trend is down in most months for 2025 and down in 2026. This decline is entirely expected and you can read about it in my article, The Manufacturing Taper.
Data Centers shows the largest % spending growth for 2025, forecast +39%, continuing on a phenomenal streak of +45% in 2023 and +56% in 2024. Data Center starts increased 300% over the previous 3 yrs. and still increase in 2025 and 2026, but at a slower rate of growth. Manufacturing spending peaked in Oct’24. Data Center spending continues to increase for the next few years. Both of these forecasts take into account some cancelations or delays announced recently (see May Briefs), however do not account for any major stoppages due to recent trade impacts.
The largest $ increases in spending are Power, forecast to increase +$16bil, and Highway +$13bil. Educational spending is forecast to post the largest nonres bldgs $ growth in 2025 (+$12bil, +9%). Data Centers increase $10bil.
This same scenario that looks to occur in Manufacturing will occur also in Highway/Bridge. Normal starts were about $100bil/yr, with slow growth. But for the last 3 years, actual starts totaled closer to $500bil for the 3 years or $167bil/yr. This strong growth in starts is expected to continue at least into 2025, totaling near $650bil for 4 years. Again, consider that part of that is inflation, but the remainder is government investment growth. So a decline from the taper back to normal for Highway/Bridge may not show up at least for the next few years. But once the taper begins it will have the same effect on Nonbldg Infrastructure spending that we will see from Mnfg in Nonres Bldgs.
Typical jobs growth is 2.5% to 3.5% per year, even though spending can sometimes far outpace that. But jobs growth doesn’t track spending, it tracks volume growth. Volume is spending minus inflation. For example, for the 4 years 2021 thru 2024, spending increased 44%. But inflation increased 33%. Volume growth was only 11%. Jobs increased 12.5%. For 2025, Inflation will outpace spending growth by 1%, but jobs are still expected to increase by 1.5%. Rarely do jobs decrease. That could change.
There are 870K construction jobs in TX. 500K are immigrants and 300K are undocumented.

New starts are forecast up in 2025, but I would caution there are a lot of headwinds that could slow new starts growth. Many economists predict the current trade impacts will slow overall economic growth. That in turn could slow capital expenditures, which, in this case, is new construction starts. So far year-to-date, spending is outpacing new starts growth. That means backlog is decreasing, mostly in nonresidential buildings. We haven’t seen a decrease in Nonres Bldgs backlog since pre-2011. Residential backlog is down slightly. Nonbuilding is increasing.
See Also Construction Briefs May 2025
and Construction Briefs Apr 2025
5-15-25 all ppi DATA UPDATED TO APR See Construction Inflation 2025
I’ve increased the inflation outlook since Feb to a range of 4.5% to 5%. Inflation may be the most uncertain of all factors affecting construction this year. We have yet to see any significant impact from tariffs, and there is sure to be impacts to many construction inputs. We may not know the total impact for several more months. But I would expect, if anything, inflation will go up from here, not down.
The bees are swarming the flowers outside. At least some lifeform is content and at peace with this world.
Construction Briefs May 2025
For the 9th consecutive year, I will be speaking at Advancing Preconstruction. I will be opening the program May 22 to the plenary session with a summary of the current and expected economic conditions affecting everyone involved in construction, all geared towards one word, RISK.
Construction Spending Q1’25 vs Q4’24 notable Q/Q increases: Education, Healthcare, Amusement/Recreation and Communication are all up 2% to 3%. Highway is up+4.9%, Data Centers +5.4%, Warehouse +7.5% and Lodging +8.3%.
Construction Spending for March is down 0.5% from Feb, but that’s because Feb was revised UP by 0.5%. Jan also revised up 0.66%. YTD Total vs Jan-Mar 2024 is up 2.8% YTD. Data Centers vs Jan-Mar 2024 is up 40%.
Construction Spending Q1’25 vs Q4’24 is UP in every category except Residential, Commercial/Retail w/o Warehouse and Manufacturing (Mnfg was expected). Residential and Comm/Rtl are down only a slight 0.2% and 0.4%. Manufacturing is down 4.7% Q1vQ4. This is the beginning of the Manufacturing spending taper as early projects come to an end. I described that taper here. The Manufacturing Spending Taper
Not seeing any major indications in spending due to tariffs yet. Still early in the data (thru Mar) for that.
Construction Jobs increased 11,000 in April. However, hours worked dropped by 0.6%. Total workforce hours worked declined by an equivalent of 50,000 jobs. Jobs are now at 8,316,000, an all-time high. Jobs are up 27k year-to-date, the slowest growth for the 1st 4 months since 2012 (excld 2020). Although hours worked fell in April, total workforce hours worked increased 2.1% over same 4mo 2024. Average yr/yr growth for Jan-Apr hours worked is 3.7% for the last 10 yrs (ex 2020).
J P Morgan expects imports from China to fall 75%-80% in the 2nd half of the year. Total all imports from all sources are expected down 20%. Some products are going to become unavailable.
The U.S. imports about 30 million metric tons, about 30% of total steel used, of all types of steel annually. The U.S. imports about 6 million metric tons of steel pipe annually. Approx 2/3rds of steel pipe used annually in the U.S. is imported. If the U.S. loses its imports of steel pipe, we can’t support as many building projects. Pipe here refers to pipe and tube. That includes things like gas and oil pipelines, water pipe, steel conduit and structural square/rectangular tube sections (Trump’s Wall).
What’s frustrating this week is all the latest construction spending and jobs data just came out, and everyone wants to know, What’s the impact on the forecast?, and none of the data reflects tariff impacts or potential slowdowns. Spending is thru Mar31 and jobs are thru Apr12. Some of the inflation data is 1 to 2 quarters behind.
I am expecting, when I prepare the Midyear Forecast, that spending projections will go down, perhaps 1% to 3%, and inflation projections will go up. Currently, I’m carrying inflation between 4%-5%. Owner’s may slow or even cancel capital expenditures and material prices are broadly expected to increase.
When PPI data is released May12, that will be thru April. But remember, PPI data is domestic products only. So any inflation in the PPI data is domestic suppliers adjusting pricing to reflect pricing similar to expected increases to match imports. We might begin to see our first clues of tariff impacts/demand when the next construction starts data gets released around the end of May. How much in previous starts have been canceled/delayed? We already know of some chip plants and data centers canceled/delayed.
Construction – What to Watch: Cost to build going up; Cost to finance is up; Product availability in question; Product delivery schedule delays; Margins pressured; Small/Midsize firms squeezed; Labor let go/disappearing; Projects in planning, delayed; Project ROI not met; Projects planned, canceled.
I recommended (going back 6 yrs ago, but still relevant today) that every construction cost estimator is going to need to identify in every estimate/budget presented to an owner for every upcoming project, all items subject to price revision due to tariff. If you don’t you stand to lose your already meager profits.
I can’t even begin to know what to tell construction cost estimators to carry in budgets for increased cost due to tariffs and supply issues. Best I could suggest at this time is to carry an agreed allowance (IMO, better than contingencies), which can be visited at a later date and adjusted to actual cost. Contingencies are for unknown, unexpected, unidentified issues. Allowances are described in the basis of estimate for identified cost issues, but at unknown cost amounts. All allowances in any estimate/budget should be identified at conception with intent to revisit at later date to adjust to actual cost. (The most common allowance you may be familiar with is a rock allowance). Identify allowances up front and reach agreement on budgeted cost with all parties. This will make your contract administration go a lot smoother than trying to negotiate how much of the contingency you can use for a cost increase that was foreseen. The only unforeseen here is actual cost.
ABI – DMI – CBI Leading Construction Indicators
With exception of residential, which has short durations and for which backlog is always only about 30%-35% of previous yr revenues, for all other work, never (since 2010) was backlog shown to be less than the previous yr spending. https://edzarenski.com/2021/05/01/abi-dmi-cbi-leading-indicators/
Construction Backlog, all work under contract yet to be put-in-place, usually extends out 2 to 3 years. Backlog changes only IF new starts are greater than spending in the month, backlog goes UP. If new starts are less than spending, backlog goes DOWN. Subtract canceled projects from starts causes backlog to go down, but delays are are just moved out in time, so are still in backlog.
PPI INPUTS Q1 vs avg 2024: to Nonres Bldgs +0.9%, to Residential +1.15%, to Highway +1.0%. All these being near 1% for Q1, if growth is constant, would be near 4% for the year. Big IF! Paving mixtures +11% in Q1, Lumber Plywood +4.5%, Fab Str Steel +0.03%, Fab Str Stl Bridges -1.1%, #2 Diesel Fuel -9.6%, Steel Pipe and Tube -3.85%, Nonferrous Wire and Cable +1.8%, Copper and Brass Mill Shapes +4.7%, Aluminum Mill Shapes +7.5%.
PPI Final Demand 1st 3mo vs avg 2024: Avg Nonres Bldgs +1.3%, Educational +1.6%, Healthcare +2.7%, Roofing Contractor + 2.8%, Avg 4 trades +1.7%. Your monthly reminder, although this index is posted monthly, it is corrected quarterly. April data is the correction month for Q1.
New home construction costs have risen about 3% in the last year, from lumber down 4% to concrete up 6%, per JBREC. The US Census Constant Value Rsdn Index is up 3.5% for the 1st 3 months 2025.
The Biden admin supported the construction $200 billion in new manufacturing facilities that began in 2022 and is now tapering down. It will take a lot of jobs to fill those facilities. But will jobs grow in the current economic environment?
Just about anything that can be considered a leading indicator is pointing down. Layoffs, container ship projected offloads are down and falling, China cut shipping to US, supply chains disrupted, immigrant fears affecting labor. Expect costs up, workload down, labor tight.
I’ve been asked, Why don’t you use AI to develop economic analysis? Artificial Intelligence sometimes gets analysis really wrong. There is some percentage (40%?, 60%?) of end results that AI creates that is literally just made up. If you were to use AI to develop forecasts and analysis of construction data, without having a thorough knowledge of the data and an ability to recognize when it’s meaningful, or garbage, then how would you know when AI is right or wrong. Understand your data well enough to know when your analysis makes sense. For my part, I’d rather spend my time understanding the data and the analysis then to spend it verifying if AI is producing realistic and meaningful output.
Summer is just around the corner. The Hummingbirds returned last week.
Building Connections Podcast Apr’25
Here’s a link to the podcast, Building Connections, of my interview with Rob Ryan, CEO of Twining, Inc. We discuss how I got to where I am today, why I provide a free blog on construction economics, who uses my data and what to expect from tariffs.
Construction Briefs Apr 2025
Tariff actions are not yet reflected in Feb PPI Inputs or PPI Final Demand index. Still early. Also remember, PPI does not include imports or tariffs on imports. When we do see movement in the PPI, it reflects domestic pricing decisions following on tariffs.
Lutnick: “Foreign goods may become a little more expensive, but domestic goods do not.” FALSE see next par.
PPI Excludes Imports/Tariffs. The 2018 steel tariffs of +25% applied on imported steel. However the 2018 PPI data shows that the cost of ALL DOMESTIC steel mill products (of all types) produced in the US increased 18% in 2018, after the steel tariffs were imposed.
If tariffs, for example, affect only 10% or 20% of products used in the industry, then the PPI shows us the domestic producers reaction to tariffs, which gets applied to the other 80% to 90% of product. For instance all steel is not imported, so not all steel will experience a tariff. The point here is that tariffs impact pricing decisions on all domestically produced products, not just the imported products. Consumers pay the price.
Impacts on Construction Inflation and Spending (guesstimates).
2021 inflation was 8%-14%. 2022 it was 12%-17%. Could 2025 repeat 2022? Yes. Will it? ??? I guess it hits 6%-10%.
I’m guessing some projects contributing to 2025 spending will be canceled/postponed. So maybe spending drops 5% from here, to zero growth. Construction spending annual growth is normally in the range 4% to 10%. 2025 and 2026 were both forecast at 5% to 7%. No doubt some projects will be canceled or mothballed. So the next 3 yrs spending gets reduced, and cost gets increased.
I’m beginning to think one of the first issues we have to deal with is supply shortages. All types of imported products are not going to be available, and there aren’t enough domestic products to replace them. This will add delays and cost to building projects.
Yeears ago, when I was a construction cost estimator, a major client would run numbers on a proposed new building project. If it couldn’t balance a ROI in 7 yrs, project would not move forward. As cost to build increases, it becomes harder to hit ROI. This supports that some projects may be canceled or postponed.
- Construction – What to Watch
- Cost to build going up
- Cost to finance is up
- Product availability in question
- Product delivery schedule delays
- Margins pressured
- Small/Midsize firms squeezed
- Labor let go/disappearing
- Projects in planning, delayed
- Project ROI not met
- Projects planned, canceled
Virginia has the largest concentration of Data Centers in the U.S. Virginia is projecting energy shortages due to the extreme demand DCs put on power grids. If you don’t build out the energy grid, the data centers put too great a demand on the current grid. “There are six states in the United States where data centres already consume over 10% of the electricity supply, with Virginia leading at 25%.” https://www.iea.org/reports/energy-and-ai/understanding-the-energy-ai-nexus
In the Q1 pre-tariff outlook, Data Center spending (SAAR), began the year 16% above the avg of 2024, is steadily climbing at 1.5% to 2%/mo., and sometimes more, is now up 22% vs avg 2024. By midyear the rate of spending will be up 28%. Data Center spending increased 45% in 2023 and 56% in 2024. Forecast for 2025 +37%. Obviously, this could get reduced if/when some projects get canceled.
The New Albany (Ohio) project, projected worth $1bil, is one of the two announced DC projects that have been halted https://www.nbc4i.com/news/local-news/licking-county/microsoft-pulls-out-of-licking-county-projects/
What if: A 10%/yr reduction in forecast new Data Center starts in 2025 and 2026 would result in reduced Data Center construction spending by -3% in 2025, -7% in 2026, -7% in 2027 and -3% in 2028.
What if: A 10%/yr reduction in forecast new Data Center starts in 2025 and 2026, combined with a 10% cancelation of 2024 starts, would result in reduced Data Center construction spending by -8% in 2025, -10% in 2026, -8% in 2027 and -3% in 2028. A 10% drop in Data Center spending is $4bil/yr.
It is not clear if the two halted projects mentioned in the article above were already committed construction starts or future proposed starts.
The Fed Chair just said what every credible economist, every economics textbook, and every empirical study shows: Tariffs reduce output and raise prices. – Justin Wolfers, Econ professor at Michigan, Senior fellow, Brookings and PIIE.
Let’s not forget what initiated growth in new manufacturing facilities. New manufacturing building contract starts over the last 3yrs is just over $600bil. Normal starts without government investment would be about $300bil over 3yrs. About $100bil of spending growth over the 3 years is inflation, leaving the remainder of about $200bil in spending growth attributed to government investment. All that began, and most of it got spent, under the previous administration. https://www.forbes.com/sites/courtneyfingar/2024/12/12/manufacturing-jobs-boom-arrives-too-late-for-biden-to-benefit/
Whenever we get an unusually large increase in new construction starts and spending, the tapering off of those projects leads to a decline on the tail end. Mnfg new starts peaked in 2022-2023. We are entering the period of the manufacturing construction spending taper. Mnfg spending has fallen slightly in 4 of the last 5 months. The forecast for 2025 is down -10%.
Microsoft has announced a pullback in spending on new Data Centers. Reduced demand negates need for new facilities, kills expansion plans, lowers new construction forecast, decreases jobs growth in construction. Mothball if partially built factory, not only expensive for owner, but also negative impact to contractor’s forecast revenues.
Whenever there’s a devastating natural disaster, causing destruction to homes, property and infrastructure, the supply of contractors, laborers and materials stays the same while demand skyrockets from victims trying to rebuild. Contractors generally pick more profitable projects over less lucrative ones.
In the Construction Analytics Outlook Feb 2025 report I said, “Don’t be surprised if 2025 construction jobs growth slows a bit. Jobs are slightly ahead of volume growth, particularly in the Non-building Infrastructure sector.”
Construction gained 19k (+0.2%) jobs in Feb, BUT total hours worked declined 0.3%. Total jobs have increased but Hrs worked has gone down the last 5 months. We’ve posted minor jobs gains in both Jan and Feb, and yet unemployment has gone up from 5.2% in Dec to 7.2% in Feb.
The March jobs report shows only minor gains in the # of jobs. We’ve added only 24,000 new jobs in the 1st quarter, the slowest 1st qtr jobs growth in 13 years (except for 2020, Covid). But hours worked in March increased by 1.5%. That acts on the entire 8.3 million workforce and is equivalent to adding 128,000 more jobs.
The jobs numbers reported April 4th cover the period from Feb15-Mar15. There are not yet any impacts from tariffs reflected in the jobs numbers.
We may see the term “force majeure” come up a lot in the near future. And if construction contracts don’t have a force majeure clause, there may be a lot of contractors in trouble.
My guess is if the people of Greenland take a vote to Join the United States, it would be 99-1 No. Of course, they would say “No, thank you.” As they so eloquently put it, “We’re not assholes.”
Tariffs Create Unknown Costs to Construction
Assessing the impact of tariffs on the cost of construction accurately has now become a nearly impossible task. Tariffs can be on PARTS used in the manufacture of goods. Who (architect?, engineer?) will identify which parts included in which products used in the building are subject to tariff? Is only 10% of the whole product subject to tariff?
For example, look at something simple like light fixtures. The shell, the ballast, the reflector, the shade, the lamps or the wiring could be made in China. Who’s job will it be to identify where parts are made? How much is the cost of the part in question? Who now estimates the share of tariff increase on those parts to determine tariff impact on cost of manufacturing the entire light fixture?
Expand that issue to a pump assembly with valves and pressure gauges. Who identifies which parts in the pump assembly come from what country? How does an estimator determine the cost of manufacturing the pumps, valves and gauges and determine what fraction of total cost has a tariff?
This will inevitably lead to inflation, but it will be hidden inflation, hard to determine if a manufacturer’s price increase for a product is substantiated. This is not like the tariff on mill steel, a 25% tariff on mill steel which represents 25% of final structural steel bid, which represents 10% of the building cost.
At the conceptual or schematic design phase of construction, all the products are not even identified. And the project start date might be a year or two years out. It can’t possibly be determined with certainty what factor should be carried to cover cost increases due to tariffs.
Inflation factors and contingency factors will need to increase to cover known unknown costs. This increases the share of the budget that is unidentified, always a contentious issue with owners. Then instead, identify the known tariffs, but the unknown value of end-cost, and carry as an allowance. Frankly with the margins general contractors or construction managers get for services on a large construction project, these unknown factors, if understated in cost factors or left unaddressed, could wipe out the total fee or profit for the job.
This is not a good position to be in, but I don’t yet see how it would be any different.
PS Here we are in Feb. 2025. I wrote this six years ago. https://edzarenski.com/2019/08/01/next-level-of-tariffs-will-be-unknowns/
Los Angeles Fires – Reconstruction
This is a preliminary estimate of what it might take to rebuild buildings and infrastructure lost to the incredible firestorms we are witnessing in Los Angeles. We don’t yet know precisely the vast extent of damages, but there has been some early projections of 10,000 buildings lost and $150 billion in damages. So, there is a lot of estimation here, but also some necessary information on which to base this estimate of reconstruction.
Census tracks employment by metro areas. Although all cities and towns are not listed, the total employment is captured within these sometimes broad areas. To understand how many construction jobs currently exist in the LA metro area, I’ve included all Census defined metros around LA. The Los Angeles metro area, to approximately a 50 mile radius, which includes Los Angeles, Long Beach, Glendale, Anaheim, Santa Ana, Irvine, Santa Barbara, Oxnard, San Bernardino and Riverside, currently has approximately 400,000 construction jobs. https://www.bls.gov/regions/west/california.htm#tab-1
In the most recent years, 2021, 22, 23 and 24, this entire pool of jobs had annual growth of 1%/yr., or only about 4,000 jobs per year. From 2011 thru 2019 the jobs growth rate averaged 6%/yr, or about 15,000 to 20,000 jobs per year. Once in 20 years (2015) jobs increase 10%, which at that time was about 25,000 jobs and that occurred in a year when volume posted the largest increase ever. Jobs have not increased more than 4%/yr since 2017.
Nationally, jobs growth (excluding the losses in 2020) has averaged 3.5%/yr since 2011. Growth has not exceeded 5%/yr since 1999.
We need to predict jobs growth at a reasonable rate of growth. With recent LA metro construction jobs growth at 1%/yr., not more than 4% growth in the last 8 yrs., and national average growth of 3.5% over the last 15 years, but currently with excessive demand influencing growth, I will use a future growth rate of 5%/yr. Currently that works out to adding 20,000 jobs per year.
The Harvard Joint Center for Housing Studies recently posted that In Texas, California, New Jersey, and the District of Columbia, immigrants make up more than half of construction trade workers. This analysis will make no effort to discuss the potential impact of immigrants in the workforce, but we must recognize the makeup of who is filling these jobs. Keep in mind after this analysis reaches some conclusions that this aspect may weigh heavily on the outcome.
We do not know the average value of the buildings destroyed, nor do we know how many are residential buildings and how many are civic or retail buildings, but we have a preliminary estimate of 10,000 buildings lost and $150 billion in damages. As of yet we don’t know how much of that $150 billion is buildings. We do know some is autos and some is public utilities, but we don’t know how much. Expecting we will know some of this information at a future date, at best, all we can do is predict for a portion of that lost that will be easily used to expand our estimate at a later date.
Rather than work with a quantity of buildings, which creates some difficulty because buildings have different total value, we can work with the dollar value of the damage estimates, because we have some historical information of how much in dollar value can be put-in-place by some number of jobs.
Let’s work with an increment of $10 billion dollars of damaged buildings and determine how much labor might be available to rebuild those losses and how long it would take. Recognize that $10 billion is very likely low when compared to the total estimated value of damage, but it gives us an easily workable increment to adjust our estimate in the future when we know more about the true extent.
Historical construction data shows it takes 4000 to 5000 jobs for 1 year to put-in-place $1 billion worth of construction. Therefore we would need 40,000 to 50,000 jobs 1 year to replace $10 billion in reconstruction. This is a combination of residential and nonresidential buildings and infrastructure.
You can see why I went with calculating labor to replace a dollar value. Home values in those areas can range from $1mil to $5mil+. Value per unit dwelling is variable. But I know it takes at least 4,000jobs/$1bil to put-in-place construction work.
The area damaged is certainly less than the total metropolitan areas used to develop our labor pool estimate of 400,000 jobs. We must recognize that the largest part of that pool remains occupied on planned workload in backlog in the remaining areas not affected by the fires. But, to fill the reconstruction need, let’s assume that 10% of the existing workforce of 400,000 plus expected annual growth of 20,000 is available to work on replacing buildings lost. So, we take 42,000 jobs away from normal construction over the surrounding metro area. That’s a big hit to the remaining metro areas. Seldom, if ever, that labor in your area falls 10%. That also means those surrounding areas, since they may see a reduction in jobs, may also see a reduction in work put-in-place.
Some of these jobs may be filled by workers traveling into the area from afar to take advantage of the expected workload. That would mean a lower demand on reconstruction jobs supported from the existing 400,000 workforce. But those workers came from somewhere, just not this metro area.
If I can’t get the labor (minimum 40,000 jobs) to replace $10 bil/year, it’s not the cost that changes, the timeline moves out. It’s not likely there would be more labor available, but there could be less.
So we have 42,000 jobs available to support a reconstruction effort. The growth rate of 2,000 jobs/yr. can be assumed to fill the gap over a few years in the range of 40k to 50k jobs per year needed. This sits well with the above estimate that it would require 40k to 50k jobs 1 year to replace $10 billion of damaged buildings.
As you can see, the labor pool may support $10 billion of reconstruction in one year. If the estimates of building damage turns out to be $100 billion, the labor pool available for reconstruction, based on this estimate, would require 10 years to accommodate that extent of workload.
This does not include demolition and removal of damage. Nor does it address logistics or demand and supply. Expect increased demand and potentially longer than normal waits for all residential building products; lumber, doors, windows, roofing, siding, drywall, flooring, HVAC, plumbing, electrical and appliances, primarily or exclusively in the affected areas. This estimate does not address inflation, which, even if normal, is a lot over 10 years. So, damage estimates today will take more than today’s value to reconstruct. Furthermore, it is not intended to address insurance issues which may have an impact on how much damaged property does or does not get rebuilt.
1-11-25
This link points to a recorded interview (36min) conducted by @EconstratPB (a mutual follower on X(twitter) and BlueSky) and hosted on his Substack, where we discuss in a little more detail how the above estimate was prepared and some of the issues that will pose difficulties to accomplish this rebuilding effort. www.pinebrookcap.com/p/after-the-…
1-24-25
This link points to a Wall Street Journal brief article referencing their discussion with me regarding this article. https://www.wsj.com/livecoverage/stock-market-today-dow-sp500-nasdaq-live-01-21-2025/card/how-many-workers-will-it-take-to-rebuild-burned-out-los-angeles–ubf4wXyri8Xcflb24AO8
6-12-25 This original article was written Jan. 11, 2025. In light of recent events in June in Los Angeles , I expect the conclusions reached in this reconstruction analysis will be extended further out in time as there will not be as many workers available to complete the work needed.
Construction Briefs – As We Begin 2025
We are close enough, now in mid-January, to see where the numbers will end up for 2024. Construction spending as of Nov is up 6.5% year-to-date vs same 11 months in 2023. We are up 6.0% ytd vs the average of 2023. My forecast predicts we end 2024 up 6.2%, but growth is only 3.4% in 2025.
In February of 2024, with the Dec 2023 data in hand, my forecast for 2024 spending was $2,190 billion, only 1.8% higher than my current (Nov’24 data) forecast of $2,150 billion. Most of that early higher estimate was due to what I carried for my residential forecast, which I have since lowered by 3.6% from the initial forecast at the beginning of 2024. You can see in this monthly summary table that the Nonresidential Bldgs and Non-building forecasts have varied very little and the Total forecast has not varied up or down by more than 0.4% over the last 4 months.
edit 2-3-25 updated table to include Dec data. See the line comparing actual to the SEP data forecast.

Single family construction spending reached a post-2006 high in Q4’21 thru Apr’22 ($480bil). From Apr’22 to the lowpoint in May ’23 ($360bil) spending dropped 25%. By year-end 2023 it had recovered almost 3/4ths of that drop. It fell again in mid-2024 to $410bil, but has since recovered to the year-end’23 level ($450bil). That drop is reflected in the difference between the current forecast and the earlier forecast.
NAHB – Cost of Constructing a Home 2024 excellent summary www.nahb.org/-/media/AB4E…
Construction spending in 2024 will hit near $2.15trillion, another new high, up 54% since 2019.
Caution: the following table, showing Constant$ analysis, now shows Constant$ with base year at 2024. Since Q1-2020 I have used the base year at 2019. This update changes the Constant$ amount, but not the Constant$ percent growth. Slight changes in prior years inflation resulted in some minor changes in Constant$ growth.

The last time construction spending declined was 2011. But construction spending includes inflation, which adds nothing to the volume of work put-in-place. Construction volume, (spending minus inflation) will finish the year up only 10% since 2019.
My construction spending forecast for 2025 Nonres Bldgs is down 0.7%. But it’s driven by projects ending in Manufacturing (and Warehouse). In the last 3 yrs, there were $230bil Mnfg starts, most in 2022, $130bil above normal, now some are ending. Without Mnfg, nonres bldgs 2025 spending would be up 4.5%. So while outward appearance may be that nonres spending is declining, in large part it is due to mega spending on Manufacturing buildings (and Warehouse) tapering down upon completion, creating very large annual declines, but normal. See The Manufacturing Spending Taper
Last year at this time, many of the Nonres Bldgs and Non-bldg line items showed Nov-Dec spending was already several points higher than the 2023 average. This was an indication leading into 2024 that those markets were on track to start the year already up. This year,most markets show a decline from the 1st half of the year into the 2nd half. Two notable declines are Warehouse and Office w/o Data Centers. Both start 2025 down 5%+ from the average in 2024.

I didn’t realize how much impact there was with the inclusion of (increasing) Data Centers in the (decreasing) Office construction spending values. I’ve now separated Data Centers from Office and Warehouse from Commercial/Retail. Office spending was pretty strong near it’s highs until 2h’22. Early in ’24 it had fallen to 8%-12% below ’22. Office spending is now 15%-18% below 2022. On the other hand, Data Center spending as of Nov is up 30% from the same months in 2023, and is up more than 60% above the average of 2023 and 120% above 2022. It will continue to increase into 2025.
In 2014-2015, Data Centers was less than 5% of total Office+DC construction spending. Today it is approaching 30%. Next year it will approach 40%. In 2015, Warehouse was 25% of total Commercial spending. By 2022 it had climbed to 54%. In 2025, it will fall back to 45%. Warehouse spending is now decreasing after climbing 100%+ since 2019.
Dodge reports as of Nov construction starts for 2024 up 5% YTD. Residential starts up 7%. Nonresidential Buildings starts up 4%. Non-building starts up 5%.
Construction Jobs do not get compared to construction spending. Spending includes inflation, which adds nothing to business volume. Compare jobs growth to Volume growth.

Construction Jobs counts here are the average for the year. That accounts for months during the year, other than Dec/Dec, with higher (or lower) percentage of yr/yr growth. For instance, total jobs Dec24 vs Dec23 increased only by 196k jobs or 2.4%. If you based annual growth on Dec/Dec, it would indicate 2024 increased by 2.4%. However, during the year, jobs growth in Mar-Apr-May were all greater than +3% compared to same month prior year. In fact, every other month during the year had a higher yr/yr growth rate than Dec/Dec. Yearly average of all 12 months shows total jobs annual average up 226K or 2.8%.
Dec/Dec shows a snapshot in time of one month compared to same month last year, without taking into account what might have happened in any of the other 11 months. YR24avg/YR23avg shows the change in the number of jobs over the whole year and accounts for all activity in the year.
Jobs 2024 AVG thru DEC. Rsdn+61k +1.9%. Nonres Bldgs+134k+3.7%. Nonbldg +29k+2.6%
Construction Volume AVG thru NOV Residential +2.9% Nonres Bldgs +3.3% Nonbldg +4.3%.
From 2012-2019, we added a yearly average 245,000 jobs/yr. In 2024 we added 226,000 jobs, but from 2021-2024, we added an average of 247,000 jobs/yr. We add the most jobs in Feb and Mar. We add the least jobs in Apr and Jun. We add more jobs, by far, in the 1st qtr. than any other qtr.
Don’t be surprised if 2025 construction jobs growth slows a bit. Jobs are slightly ahead of volume growth. Since 2019, both Jobs and Volume increased 10%. But that includes 2020, when volume increased 4% but jobs fell by 250k, or 3%. Over the period of 4 years 2021 thru 2024, Jobs increased 13%. Volume of work increased only 6%.
The unemployment rate in construction goes UP in the 1st qtr every year, by 2% to 3% (data since 2011). Now, your 1st thought may be, if unemployment is increasing, that is probably because jobs are falling. Well, construction has ADDED jobs in the 1st qtr. every year since 2011 (excluding 2020), by an avg of nearly 30% of all jobs added annually. More recently, since 2020, we’ve added almost 40% of total annual jobs in Q1. Construction unemployment is not going up in winter months because we lose jobs in winter. So how can the unemployment rate still go up? There’s only one number left in the equation. It goes up because the entire workforce increases by greater than the number of jobs added.
For an example of how this employment timing information can be useful see Employing Correlation – Using construction industry employment data as a proxy for flatbed demand
Harvard Joint Center for Housing Studies posted that In Texas, California, New Jersey, and the District of Columbia, immigrants make up more than half of construction trade workers.
Nov PPI for Construction Mtrls little changed from Oct Inputs YTD to Nonres +0.6%, to Rsdn +1.7%, to Hiway +0.6% Concrete products up 6%, Steel products down 7%-8%, Lumber/Plywood down 2%, Copper up 6%, Diesel down 14%. Final Demand YTD (all in) Nonres Bldgs all up 0.5% or less. Trades up 1%-2%.
We can’t always tell what affect changes in the cost of construction materials will have on the final outcome of annual construction inflation. PPI materials index does not account for productivity or margins and varies on stage of input. A good example of stage of input is PPI for Steel Mill Products. That does not include delivery from mill to fabricator, detailing, fabrication, shop painting, delivery to jobsite, shakeout, lifting, installation and finally overhead and profit, in all about 75% of the cost of structural steel installed.
Construction Analytics Nonres Building Cost Index is a weighted average of eight final cost indices.

NAHB estimates that $184 billion worth of goods were used in the construction of both new multifamily and single-family housing in 2023 and that $13 billon of those goods were imported. eyeonhousing.org/2024/12/impo…
Steel Statistics Cost Increase Effect on Construction? written 2016 US is world’s largest steel importer at 30MMT/yr. 50% from our top suppliers, Canada, Brazil, South Korea and Mexico. China supplies less than 2%. The U.S. annually imports about $2bil from Mexico.

One quarter of all annual Brussel Sprouts consumption occurs around the Christmas holiday.
Construction – More Thoughts Dec’24
The PPI data for November released 12-12. Nov PPI for Construction Materials shows very little change from Oct. Inputs YTD to Nonres are +0.6%, to Rsdn +1.7%, to Hiway +0.6%. Concrete products +6%, Steel products -7% to -8%, Lumber/Plywood -2%, Copper +6%, Diesel -14%. Material Inputs will contribute less than 1% to 2024 Inflation (1.7% for Rsdn) as shown in the Final Demand (Nonres) prices. Final Demand YTD (all in cost) to Nonres Bldgs shows all building types up +0.5% or less. Warehouses, and Industrial Bldgs show -0.1% to -0.25%. Concrete, Roofing and HVAC/Plumbing Trades are up +1% to +2%. Electrical trades are down slightly.
The economists watching residential permits and starts number of units are indicating current poor performance and are predicting a gloomy outlook for 2025. So far, the Dodge Construction Network, which tracks dollars starts, has residential starts up 7% year-to-date 2024, when compared to same 10 months 2023. Dodge is forecasting starts up next year. When I spread those starts out over time, the cashflow (spending) is stacking up pretty well at 7%/yr. There could be some downward changes to 2025 forecast due to immigration issues and tariffs.
I’ve been wondering, Should the duct tape be given as much value as the banana? Without the duct tape this whole banana art thing just doesn’t hold up.
Construction – Brief Thoughts Dec’24
Construction spending in 2024 will hit near $2.15 trillion, another new high, up 50%+ since 2019. (The last time constr spending declined was 2011. Construction volume, (spending minus inflation) will finish the year up only 10% since 2019.
Construction Spending for OCT is up 0.4% mo/mo. Aug & Sep rvsd up ~1%/mo, mostly Rsdn. Spending now essentially flat for last 4mo. YTD’24 vs YTD’23 now +7.2%, falling slightly as expected for last few mo, because spending was rapidly increasing in late months of 2023 and is flat in 2024.
Real Manufacturing Construction Starts over last 3yrs is just over $600bil, whereas normal starts without any influx of government investment would be about $300bil for the same 3yrs. Most of those starts were posted from Q3’22 thru Q4’23. By far the highest period of growth in new starts was the 2nd half 2022. About $100bil of that spending growth over the 3 years is inflation, leaving the remainder of about $200bil in excess (but welcome) spending growth attributed to government investment in new manufacturing facilities. Now some of these projects are ending or soon to end. My latest construction spending forecast for 2025 Nonresidential Bldgs is down 0.5%. But this decline is driven by projects ending in Manufacturing. Without Manufacturing, Nonresidential Buildings 2025 spending would be up 4%.
The same effect on spending by the tapering off of Manufacturing Bldgs ending will happen in Infrastructure spending due to the current increases in Highway/Bridge, only ending a few years later.
Construction jobs increased to 8.313 mil in NOV. Since SEP, last two months barely increased, only +12k jobs. But perhaps more important, hours worked, since SEP, decreased 0.75%, equiv of 60k jobs. However, ytd’24 vs ytd’23, jobs are up 2.9%, total hrs worked is up only 2.7%
The unemployment rate in construction goes UP in the 1st qtr every year, by 2% to 3% (data here since 2011). Now, your 1st thought is that if unemployment is increasing, that is probably because jobs are falling. Well, construction has ADDED jobs in the 1st qtr. every year since 2011, by an avg of 24% of all jobs added annually, and more recently by over 30% of total annual jobs. Construction unemployment is not going up in winter months because we lose jobs in winter. It goes up because the entire workforce increases by greater than the number of jobs added.
To properly inflation adjust the cost of construction, use a Final Cost Inflation Index. General construction cost and Input price indices that don’t track whole bldg final cost do not capture the full cost of escalation in construction.
Will vacant office space to residential conversions be the construction spending that ignites the 2025 fire? Residential is forecast now to spring ahead 8% in 1H’25, then hold steady thru 2H. If conversions jump, that percent goes up and we could see a shortage of residential labor. (not addressing deportations).
There are 870K construction jobs in TX. 500K are immigrants and 300K are undocumented.
Sweet potatoes should be steamed only just soft enough to slice (long way preferred) about 1/2″ thick, then griddle fried in butter and maple syrup until there is some blackening (important). This was my dad’s recipe. No other recipes are allowed.
The Manufacturing Spending Taper
11-21-24 My construction spending forecast for 2025 Nonresidential Bldgs is down 1.5%. But this decline is driven by projects ending in Manufacturing. In the last 3 yrs, there were $230bil Mnfg new starts, most in 2022, about $130bil above normal for 3yrs. Now some are ending. Without Mnfg, Nonres Bldgs 2025 spending would be up 4.5%. (This original article written 11-21-24)
(edit 4-15-25 only to update forecast. Mnfg data has not changed) Construction spending for 2025 Nonres Bldgs is forecast up 2.9%. Manufacturing is expected to fall 9%, from $233bil in 2024 to $212bil in 2025. Mnfg is forecast to drop to $174bil in 2026. Without Mnfg data, Nonres Bldgs 2025 spending would be forecast up 8.2% in 2025. Tariffs and/or recession would (will) lower this forecast.
Now, let me clarify. The spending I reference is Census PIP current$ spending. It doesn’t matter if we look at current$ or constant$ (inflation adjusted), by the end of 2025 spending on Mnfg bldgs will be down 25%. The new starts above are those reported by a firm that tracks construction starts. But, only about 40% of actual starts are captured in that number. Real Mnfg starts over last 3yrs is just over $600bil, whereas normal starts without any influx of government investment would be about $300bil/3yrs. Most of those starts were posted from Q3’22 thru 2023. By far the highest period of new starts was the 2nd half 2022. About $100bil of that spending growth over the 3 years is inflation, leaving the remainder of about $200bil in excess (but welcome) spending growth attributed to government investment.
Mnfg projects can have a longer spending curve (on average) than most nonres bldgs, so obviously end dates are pushed out further. The average spending for all nonres bldgs is spread out over a spending curve of approximately 20:50:30, where 20% of all the starts in the year gets spent in the year started, 50% in the 2nd year and 30% over the 3rd and 4th yr. The spending curve for Mnfg is more like 17:40:30:13. We will see declining spending from this pool that will impact total nonres bldgs spending at least for the next 2-3 years.
So while the outward appearance in the data may be that nonres spending in total is declining, in large part it may be due to mega-spending on mnfg bldgs tapering down upon completion, creating large, but normal, annual declines. This may have the effect of offsetting gains in other nonres bldgs markets. That influx of spending is unlikely to be repeated. So, as we see mnfg spending begin to taper off, we should not expect additional support from new mnfg starts. We should expect mnfg starts to return to a more normal growth rate.
edited 2-4-25 added next paragraph and following Mnfg spending plot
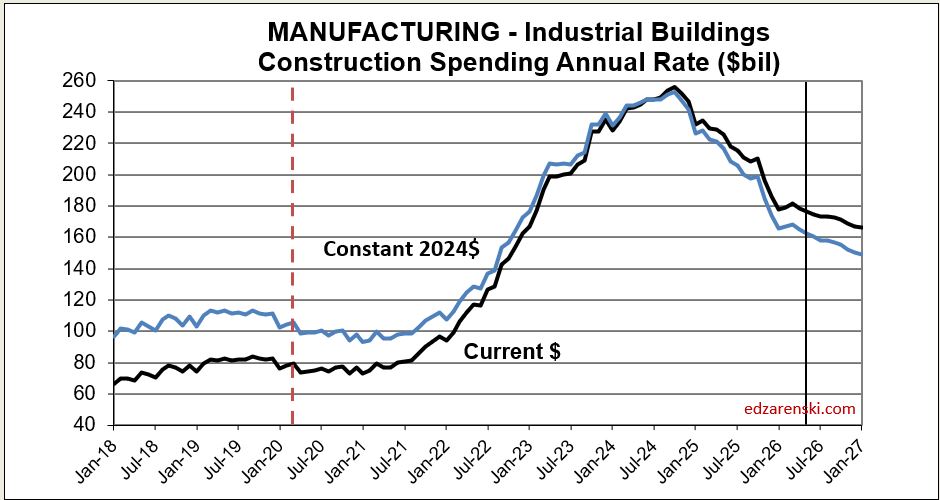
Whenever we get an unusually large increase in new construction starts and spending, the tapering off of those projects leads to a decline on the tail end of the timeline. Peak spending was near the midpoint of projects, so after that it’s all declining. Mnfg new starts peaked in 2022-2023. Here’s what the manufacturing spending taper may look like.

edited 4-11-25 added Warehouse Plot and text
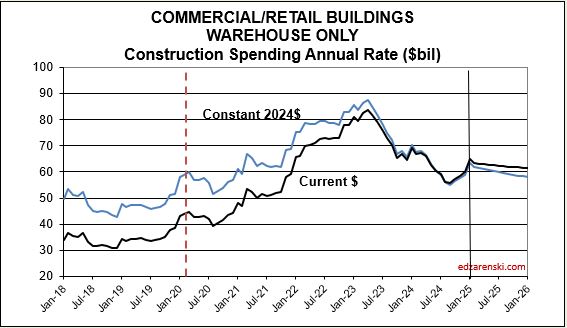
This is exactly what happened in Warehouse spending. Warehouse contract starts began to rise in 2020, but rose rapidly in 2021 and 2022. Therefore, the rate of spending began to rise in late 2020, then rose substantially from late 2021 well into 2022, when project spending would have been expected to peak. New starts began to fall back in 2023 and more-so in 2024. Peak spending was reached in Q1 2023 and spending has fallen in 18 of the last 24 months. The current rate of spending is now back to the level of 2021.
This same scenario will occur in Highway/Bridge. Normal starts have consistently been about $100bil/yr, with slow growth. But for the last 3 years, actual starts were closer to $500bil for the 3 years. This strong growth in starts is expected to continue at least into 2025, totaling near $650bil for 4 years. Again, consider that part of that is inflation, but the remainder is government investment growth. So a decline from the taper back to normal for Highway/Bridge may not show up at least for the next few years. But once the taper begins it will have the same effect on Nonbldg Infrastructure spending that we will see from Mnfg in Nonres Bldgs.
If you know in advance what to expect, there should be no surprises when it occurs.
7-1-2026 updated to include this 2026 plot of Manufacturing spending, mirroring the one above original to this post. Looks to me I had it forecast pretty on the nose. In each respective chart everything to the left of the vertical black line is actual$. Everything to the right is forecast. 18 months ago I forecast the spending would drop and at this rate of decline.