Home » Behind the Headlines (Page 3)
Category Archives: Behind the Headlines
Hurricanes & Residential Construction
Over the next few years there could be many billion$ of construction spending to “repair” hurricane damaged homes. That spending will NOT be reported in Census construction spending reports. According to Census definition, renovations to “repair” natural disaster damage are not recorded in construction spending.
Construction spending to “replace” homes entirely lost to hurricane damage (wiped completely off the foundation) IS reported in Census spending, but it is reported as renovations/repair, not new SF or MF construction. These are not “new” homes and do not add to the new home count. The work is to replace an existing home.
There will be billions$ of residential construction and the associated labor that will fall outside posted Census data. Some of that spending and labor will be diverted from the growth in residential construction tracked by the Census Rsdn$. So, it is conceivable that Census tracked residential spending could slip slightly from current projections, and yet the work is being done, only unaccounted for.
(All of this is true also for nonresidential).
Expect increased demand and potentially longer waits for all residential building products; lumber, doors, windows, roofing, siding, drywall, flooring, HVAC, plumbing, electrical and appliances, primarily or exclusively in the affected regions.
If your business is in a region that is currently outside the affected region and slow for residential construction, consider that anybody with a hammer and a pick-up truck may be traveling to the affected regions to work. That could mean that many slow regions may lose some available labor, as the labor will move to the affected area.
For every $1billion of work needed to replace damaged buildings it requires 4000-5000 construction workers for one year. That could also be stated as 1000 jobs for 4 to 5 years. Very early damage projections due to Helene and Milton range from $50-$175 billion, but not all of that is construction. If even $10 billion of work is construction to repair/replace damaged buildings, that would require 10,000 jobs for a period of 4 to 5 years (or 20,000 jobs for 2 to 2 1/2 years).

Construction Data JULY Briefs 9-5-24
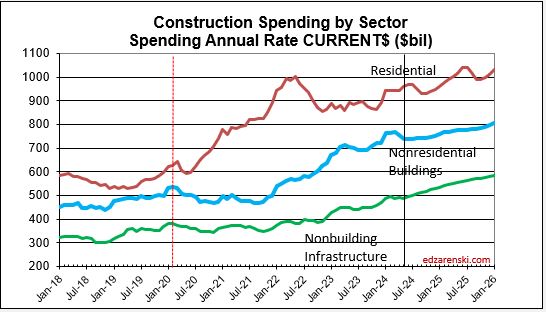
Construction spending 2024 through July is still on track to finish the year up 7.7%. Residential is forecast up 8.5%, Nonresidential Buildings up 6.0% and Non-building up 8.9%.
We still have 3 or 4 more months of slightly declining construction spending, driven mostly by residential, but also by Manufacturing. This is not a long term trend. Sit tight. Oct or Nov, trend tuns back up. You can see the dip in this Current $ spending plot.
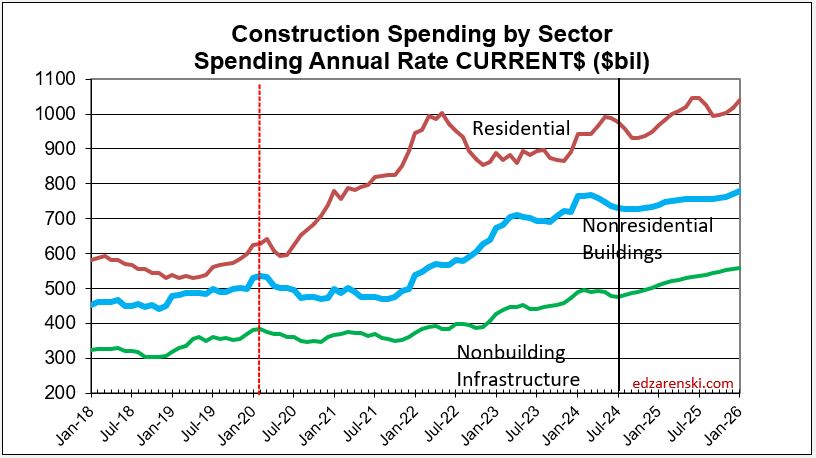


Construction spending total for 2024 expected up 7.7%. With inflation at a 4yr low (3%-4%), the amount of spending that is real volume growth is up this year, highest since 2016. It just edge out 2020.
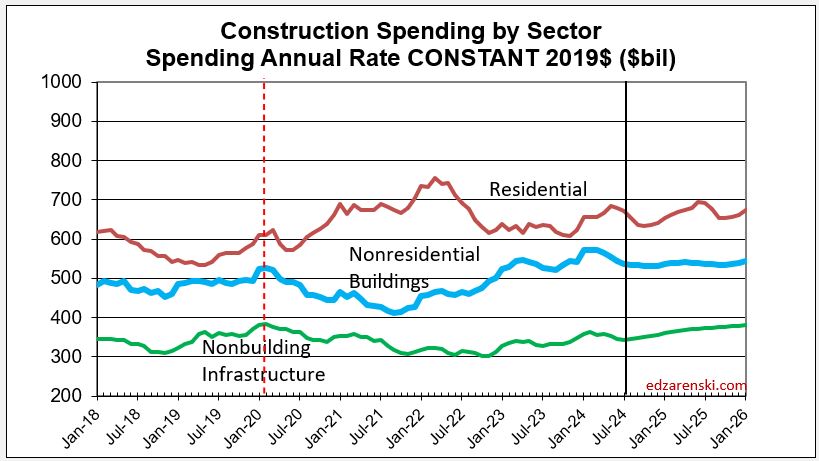
I’m forecasting residential construction spending total for 2024 at $952b ,+8.5%. But three other indicators I calculate to compare to my forecast are telling me it could come in between $960b and $970b. I’m leaning towards higher, but I’d like to see Aug data, and Sept data.
And then there’s this. Census SAAR avg YTD (the average of the reported rsdn monthly SAAR for the 1st 7 months) is $939b. My YTD SAAR avg is $964b. Some down months will lower that slightly by year-end. .
Statistically, YTD spending through July for Rsdn and Nonres Bldgs is 57% of the total annual $ spent. This is indicating year-end total $ for residential will be $963b and $744b for Nonres Bldgs.
JOBS REPORT
Jobs are up by 34,000, 0.4%, in August, up by 80,000 in the last 4 mo., for a total up 1%/4mo. Year-to-date construction jobs are up 160,000 or 2%. Of those, 100,000 were for Nonresidential Buildings. Typical growth is 3.5%/year or about 250,000 to 300,000 jobs/year.

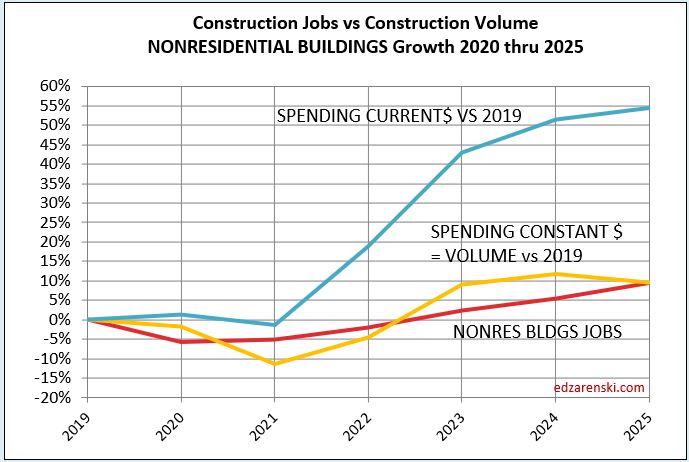
In this last month volume fell 1%. In the last 3 months, business volume fell 2.5%. Volume is falling and jobs are still increasing. There will be a slow patch for the next few months where volume will still fall another 1% to 2%. But jobs did not fall recently, and I don’t expect jobs to fall in the next few months.
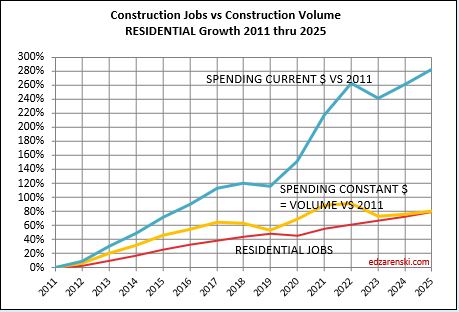
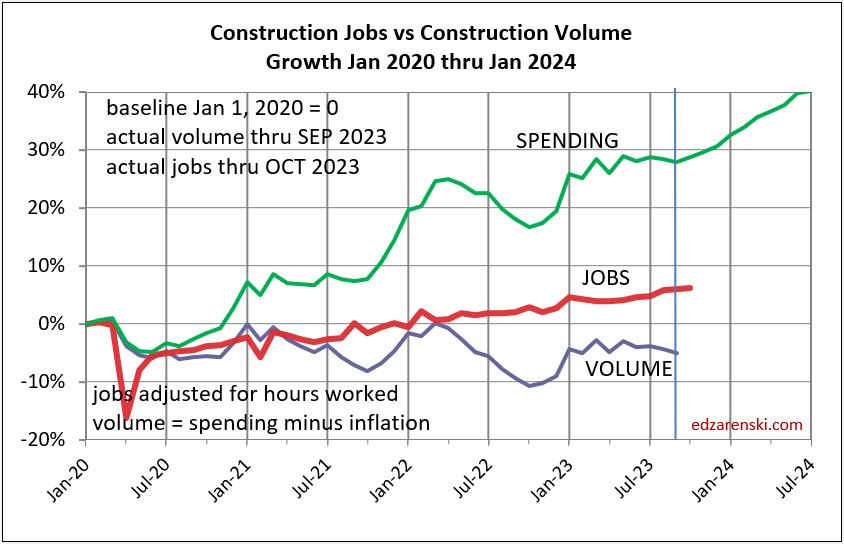
The plot above from Jan2020 to Jan2026 is just enlarged view from this plot below, which shows how consistent jobs growth has been over the last 14 years. After the 2020 dip, the slope of jobs growth is about the same as Jan2011-Jan2020.

These next three plots break out the major sectors.


Can We Increase Residential Construction by 3 Million Units in 4 Years?
Here’s a look at the residential construction industry. Except for the first mention of Current $, All $ in this analysis are inflation adjusted Constant 2019$, so all years can be compared on equal terms. All numbers are rounded slightly.
Currently in 2024 $, residential construction spending is $940 billion/year, 43% of all construction. Only 60% of that ($560 billion) is spending on new housing units. The other 40% is Reno.
Currently for 2024, residential construction supports 3,350,000 jobs. Only 60% of the jobs (2,000,000) are for new units.
30 years ago residential construction spending was $550 billion/year and there were 2,200,000 jobs. On average over 30 years (including all up or down years) we’ve added $14 billion/year in spending and 38,000 jobs per year.
The 30 year (1995-2024) average growth in residential spending, counting only 21 up years, (eliminating all 9 down years) is +$36 billion/year. There were 2 years that we added +$70 billion/year in spending (one of those in 2021) and including those, there were only 7 years over +$50 billion/year.
The 30 year (1995-2024) average growth in residential jobs, counting only 21 up years, (eliminating down years) is +125,000 jobs/year. In 1999, we added 270,000 residential jobs. Since 2011, the most we’ve added in a year is 170,000 jobs in 2021. That’s for ALL residential construction.
In 30 years, we’ve never added more than $70 billion/year in residential construction spending nor more than 270,000 residential jobs in a year. Since 2011, the most residential spending increased was $70 billion in a year and the most residential jobs increased was 170,000 jobs in a year, both in 2021.
Only 60% of all residential spending and jobs is associated with building new housing units. The other 40% is renovations, not associated with new construction. That must be considered when reviewing all the historical data noted above. So the following is just to look at the data without renovation.
Reduce the data by 40% to eliminate spending and jobs associated with renovation and look at just the data associated with building new housing units: In 30 years, we’ve never added more than $40 billion/year (2004,2021) in residential construction spending on new units nor more than 160,000 residential jobs in a year (1999,2005). This is for New Units construction only.
Since 2011, the most spending increased for new units was $40 billion in a year (in Constant 2019$) and the most jobs increased was 100,000 residential jobs, both in 2021.
The last time residential jobs for new units increased by 100,000 or more in a year was 2005. Best growth ever was 2004-2005-2006, when we averaged +120,000 jobs/yr for 3 years, just for new units. In fact, the only times residential jobs for new units increased by more than 100,000 were 1999, 2004, 2005 and then finally again in 2021. But 2004-2006 was a time when the construction unemployment rate averaged 7.5%-8.5%. In 2021, construction unemployment averaged 6%. Now the unemployment rate is averaging 4.5%.
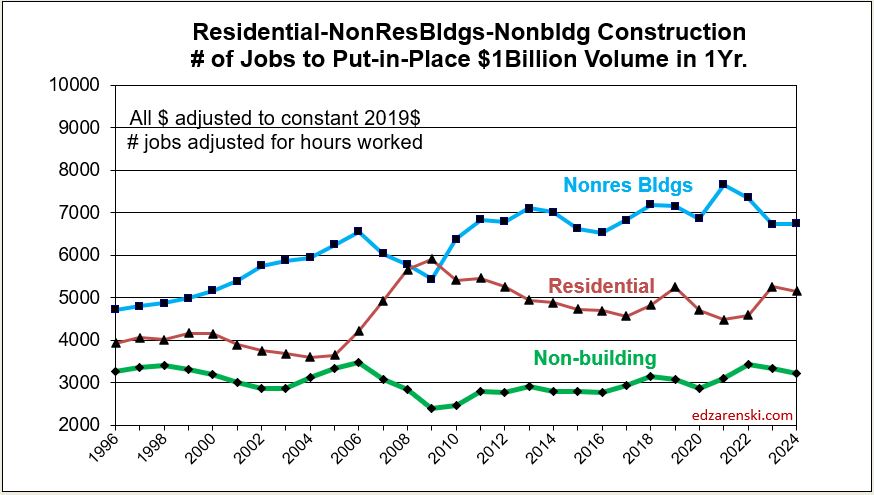
(It would be wise to use post-2011 data for the jobs analysis. The construction industry, especially residential and nonres bldgs, experienced a labor base reset in the period 2006-2010, a period from which we have never fully recovered. Notice in this plot that residential was nearly level at 4000 for 10 years, then from 2005-2009, it shot up to over 5000. It’s remained near 5000 since 2010.).
If we were to match the maximum growth rates since 2011 (and in the case of spending, since 1994) we would increase new residential units construction spending by $40bil/$390bil = 10% and we would increase new residential jobs by 100,000/2,000,000 = 5%. Spending maxed at 10%, but jobs max growth at 5%.
The number of new housing units built in a year varies, but for this post I’ll use 1,500,000. Currently it’s a bit less than that. Increasing new units by 5% to 10% per year on a base of 1.5 million units/year would net a growth between 75,000 to 150,000 added units per year. Let’s use 100,000 new units in the first year. That would be 6.7% growth, already more than the 5% jobs. We would continue the growth, so we increase that by another 100,000 in the 2nd year, and again in the 3rd and 4th years. Leave no doubt, growth of 100,000 units/yr would mean adding jobs to match or exceed the best single-year growth rate in the residential new units construction industry since 2005, and keep matching that growth rate for four consecutive years.
CORRECTION: 8-21-24 The Corrections (now fixed) above raise the upper limit of potential growth based on spending from 7% to 10%, or 150,000 units/yr, but only if we take the result to be dependant on the upper limit % spending growth. I had divided by current $ when I should divide by constant $. Spending can vary a lot more than jobs. While some years of jobs growth reach 6%-7%, average residential jobs growth is just over 4%. Jobs never grow at 10%/year.
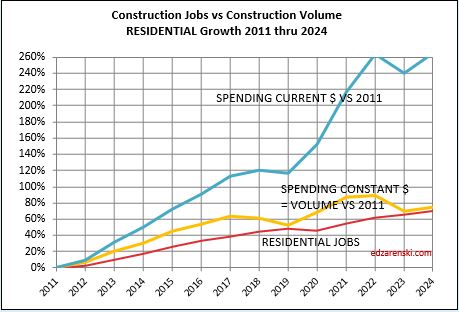
This plot shows the steady growth in residential jobs, 75% over 15 years. Compounded that’s about 4%/yr. So, it seems much more likely the limiting factor here is jobs, not spending.

In this analysis, the number of units was chosen at 100,000/yr., an increase of 6.7%/yr., well below potential spending growth but already more than jobs growth. The jobs increase in 2021 was 5%/yr. In 2004-2005, jobs growth was 8%/yr. So, this 6.7% is near the high end of potential jobs growth. This implies an add of 130,000 jobs.
So we would increase new units by 100,000 + 200,000 + 300,000 + 400,000 or 1,000,000 total new affordable residential units over the next 4 years.
By this rough analysis, to increase new residential units by 3 million over current production over the next 4 years would require that we increase residential construction and jobs by 3x greater than the best performance achieved in the construction industry in the last 30 years, and keep it up for the next 4 consecutive years. That’s more jobs than the entire construction industry gains in one year and the new units subset of construction is only 25% of all construction.
Although there has been times past when jobs increased by 120,000/year, that was a time when unemployment was much higher and there were more workers available to readily go back into the workforce. It’s not impossible that jobs can grow faster, and therefore also the number of new units, but it is unlikely.
If a substantial portion of the current 1,500,000 unit production (500,000 units a year for the next 4 years) were shifted over to affordable units, the picture changes considerably. But I wouldn’t expect that current demand to just go away and shift to lower cost units. So, this leaves current demand as is and adds jobs.
A Proposal: If some amount of the funds to be invested in this program is directed towards trades training programs, within two years, and every year after, we could potentially be turning out some of the extra 260,000 additional workers we would need every year to achieve 3 million new housing units. This approach would create both good jobs and new affordable homes. Incentivize the training program somehow. Paid internship. Perhaps with a guarantee in return to work for 2-3yrs. If we don’t invest in training workers for this effort, we cannot build more than the labor we have. Here’s a thread on my training proposal. https://x.com/EdZarenski/status/1828778915055468816
Construction Data MAY Briefs 7-1-24
With the July 1 release every year, Census issues spending revisions to prior years, in this case to 2022 and 2023.
For 2022, Census added +$54bil (3%), mostly to Nonres Bldgs. The largest revisions in 2022 are Comm/Rtl +$10bil (+8%), Mnfg +$10bil (+8%), Power +$12bil (+11%).
For 2023, Census added +$44bil (+2%). The largest revisions are Comm/Rtl +$10bil (+7%), Amuse/Rec +$4bil (+11%) and Power +$12bil (+9%).
Along with 2022 and 2023, Census also revised Jan-Apr 2024. For the first four months of 2024, Census added +$14bil (2.2%), mostly to Residential +$7bil (+2.6%) and Power +$4bil (+8.4%).
Overall, total construction spending, including the May data for 2024, is now forecast +8.5% over 2023. With the upward revisions to Jan-Apr, Rsdn spending forecast is now +7.7% for 2024. Nonres Bldgs (+6.9%) and Nonbldg (12.7%) growth over 2023 is down from prior forecasts not because 2024 spending went down, but because 2023 revisions were higher.
Compare this forecast to the forecasts issued in July in the AIA Consensus Construction Forecast.

From 2012 to 2024, construction spending has been up every year, averaging +8.2%/year. It’s been as low as +4% and as high as +15% in that time. Well, after taking out inflation, construction volume of business really increased only on average +3.2%/year. The low years were +0.2% to -0.2%. The highs were 2014 and 2015 when volume increased +7% and +9%. All other years were +5% or lower. The table below shows the percent volume growth for recent history and forecast.

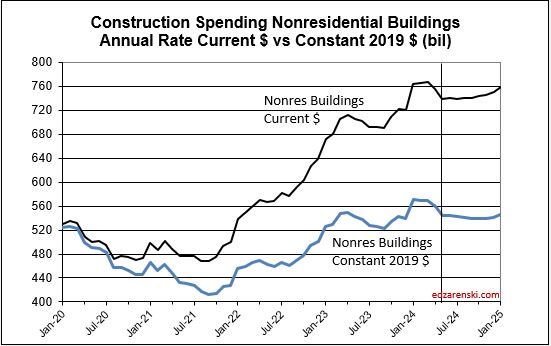
So far, through May, the inflation rate for all building types is much lower than most of the recent years. All inflation at this point is projected to finish 2024 between 3.5% and 5%. 2024 spending in constant$ will be the highest rate of volume growth since 2020. Keep in mind, the Constant$ in the table above (and in all the plots below) represents 2019$. If reported in 2024$, then 2024 would be constant and all total annual dollars would be higher. The percent Constant$ change from year to year would not change.


While the first 5 months of 2024 show no new highs for residential starts, the average of the first five months is higher than the average for 2023. Starts in 2022 still hold the highest monthly and highest annual average for residential starts.




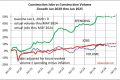
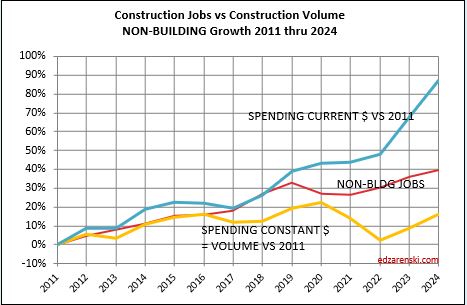
The jobs plots below show a steady rate of growth in jobs before the spike down, as well as after. It’s just that the pattern was delayed for two years until jobs caught back up to where they were. Jobs move somewhat independent of the volume of work being put-in-place, at a very steady long term growth rate.
Since 2011, jobs have increased at an average of 3.3%/yr., several times reaching 4%/yr., seldom hitting 5%/yr. In the last 12 months jobs are up 3.6%. Year-to-date jobs are up 1.5% for the 1st six months.
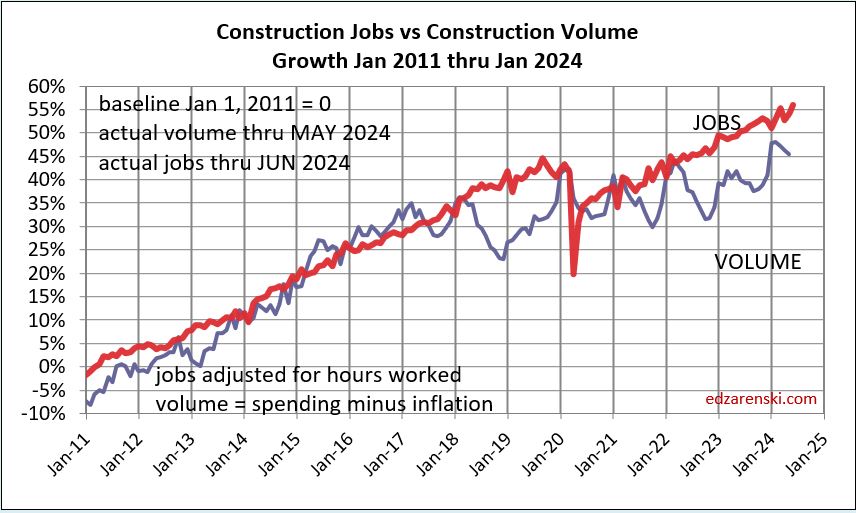
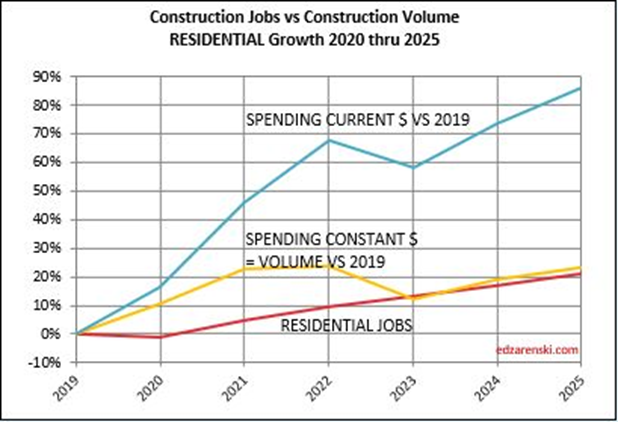
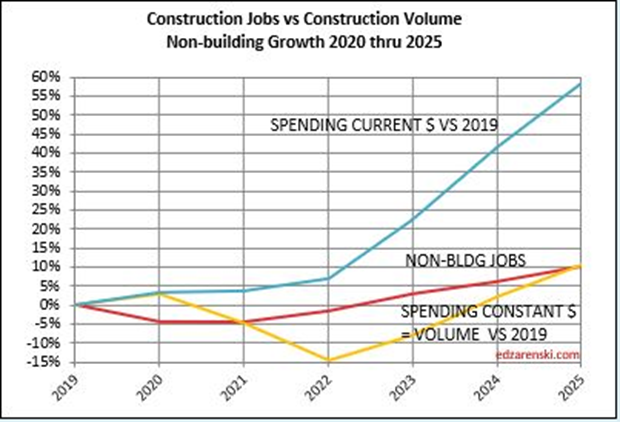
This enlarges the 2020-2025 portion of the plot above. Volume growth has spent much of the last three years still lower than needed to balance with jobs growth, but has made rapid recent gains. But look at the Volume plot, down midyear in 21, 22 and 23. My data file shows the next 4-5 month, a stall in spending, but we are at all-time highs, (so, it doesn’t hurt much) then followed by 15 months of growth.


JOBS Year-to-date:
- Residential jobs are up 1.0%. Volume is up 6.4%
- Nonres Bldgs jobs are up 2.0%. Volume is up 1%.
- Non-Bldg jobs are up 1.4%. Volume is up 1.3%
- Total all construction jobs is up YTD 1.5%. Volume is up 3.3%
JOBS In the last 12 months and last 24 months:
- Residential jobs are up 2.6%. Volume is up 4.1%. Over two years, jobs are up 4.4% while volume is up 6.9%.
- Nonres Bldgs jobs are up 4.8%. Volume is up only 0.4%. But look back over two years and jobs are up 8% while volume is up 18%.
- Non-Building jobs are up 3.1%. Volume is up 2.9%. Over two years, jobs are up 6.9% while volume is up 12%.
JOBS Since the onset of the Pandemic (May 2024 compared to Dec 2019):
- Residential jobs are up 15.0%. Volume is up 13.4%
- Nonres Bldgs jobs are up 5.4%. Volume is up 10.6%.
- Non-Bldg jobs are up 6.0%. Volume is down 5.8%
- Total Construction Jobs are up 9.2%. Total Volume is up 7.6%.
Non-Bldg Infrastructure volume is forecast to increase 10% in the next 12 months. Nonresidential Bldgs volume expected to increase 1.7%. Residential expected to increase 1.0%. I expect total volume to increase by 4% to 4.5% in 2024, I expect total construction jobs to increase about 3.5% to 4% in 2024. Total jobs through June are up 1.5%.
Construction Analytics 1,000,000th view, Apr data Briefs 6-10-24
Updates to Forecast, spending, starts, inflation, jobs will follow next few days, so revisit this post for Apr data updates.
SEE ALSO Construction Analytics Outlook 2024
Today, 6-10-24, this blog recorded the 1,000,000 view. That doesn’t count scrolling from the home page, where a visitor might scroll down to read 3 or 4 articles, and there are 500 landings on the home page every week. So, the counter hit 1,000,000 but including scrolling, the actual total views could be higher. Nearly 500,000 people read on average 2.1 articles every visit. Inflation articles draw the most attention, with a read rate of about 1000 times a week on a slow week and 2,000 on a busy week.
Thank you to all my visitors, and to the 1,000,000th viewer. Keep reading! edz
April construction data update
Total construction spending for 2024 is forecast up 9%, down slightly since last update. Residential was reduced, expect now only +4%. Nothing else changed much. Nonres Bldgs forecast up 11%. Nonbuilding up 15%.
Jobs growth from May’23 thru May’24: Total Jobs +3.2%; Nonres Bldgs + 4.7%; Nonbldg Infra +3.6%; Residential +2.9%. In all cases most of the growth was in 2023.
Residential construction spending cash flows indicate a drop of 4% over the next 6 months, but then a slow steady climb of +10% in the following 12 months.
Nonresidential Buildings construction spending cash flows indicate we have settled in a temp flat top for the next 6 months, down 2% from the Feb’24 peak. Then we get a 5% annual rate of increase for the next two years.
Non-building Infrastructure cash flows are not showing any monthly pullback for the next two years. Spending adds 8% from now until year end and then adds 10% in 2025.

Baseline Spending Adjusted to Constant 2019$

Since the end of 2019, (in Dec 2019 spending hit $1,464T) total construction spending as of APR’24 is up 46%. The real Volume of Business is spending minus inflation. Inflation adds nothing to the volume of business. After inflation, Volume is up only 6%. Total jobs are up 9%.
Since the end of 2019, Residential volume is up 7%. Rsdn jobs are up 15%. Nonres Bldgs Volume is up 12%. Nonres Bldgs jobs are up 5%. Nonbuilding volume is down 8%. Nonbldg jobs are up 5%.
A follower commented to me they thought total adjusted spending would be higher. At the time, we were referencing Constant2019$. When we set base year to 2024, all other years would be compared in Constant2024$. All years would appear higher, but the percent change yr/yr would be the same. Here’s the same data as the table above, except the Index year has been changed to Constant 2024$.
Baseline Spending Adjusted to Constant 2024$

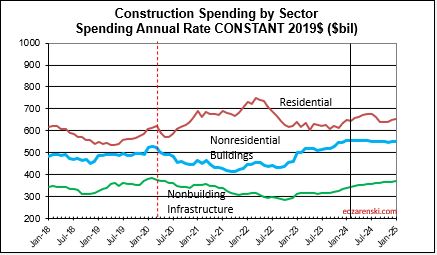
Nonresidential Bldgs volume (spending after adjusting for inflation), increased 28% in the last 18 months. Nonres Bldgs jobs increased only 7%, and hours worked (OT) did not increase. That leaves 21% of Nonres Bldgs volume that was put-in-place without a balancing increase in jobs. The added work got absorbed into the existing workforce. That’s a very hard fact left unexplained by the argument that there are jobs shortages. As one reader commented, there are some reasons why more $ value of work is counted at the jobsite with less jobs, i.e., prefab, but not 21% of all Nonres Bldgs work.
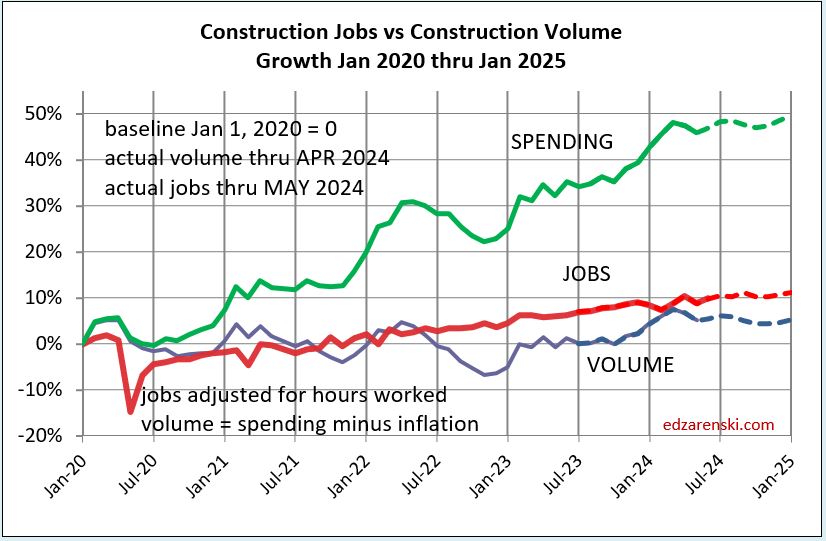
This plot below removes spending, shows a better scale comparison of Jobs to Volume.

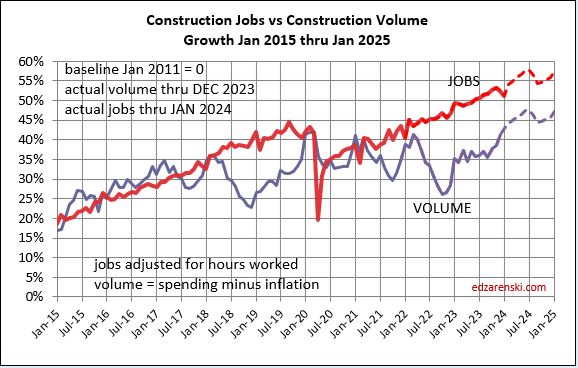
The above plot is taken from this 2011-2025 plot below. Looking back to 2011 shows how consistent jobs and volume growth was from 2011 thru 2019. This plot shows Construction Jobs growth since mid-2020 occurring at the same slope (rate of growth) as 2011-2019. Construction jobs grow avg 3.5%/year, even if volume growth varies. The Pandemic set jobs growth back by almost 2 years.
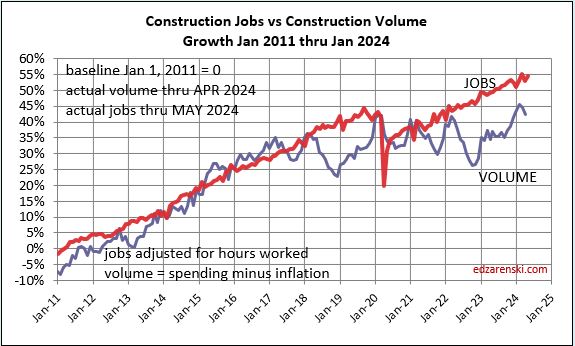
The next three plots Jobs vs Volume Growth, are set to zero start at Dec 2019. Last month, MAR data, I showed these same plots going back to start Jan 2011. Here’s a link to Mar data for those 2011 plots.
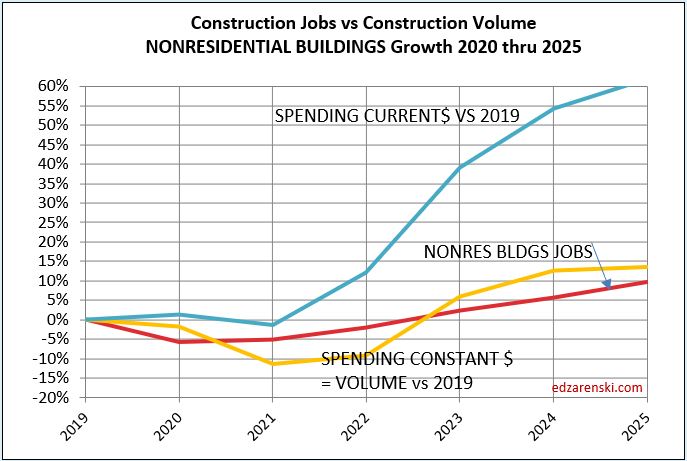

I’ve recently read comments on Twitter X that a slowdown in new residential starts is causing a drop in residential employment, and that leads a recession. Well, residential jobs are up 1% year-to-date, up 2.5% from May’23 to May’24, and right in line with average jobs growth since 2011. There is a slowdown in the rate of growth of constant $ volume. Although May starts are the lowest since November, that slowdown from May to December is only 3.5%. This may not be a big enough drop in volume to initiate a drop in jobs. We’ve seen other years (2018) where a small volume drop is not followed by a drop in jobs and never does the drop in jobs equal the magnitude of the drop in volume.


Construction Data MAR Briefs 5-5-24
Updates to Forecast, spending, starts, inflation, jobs
SEE ALSO Construction Analytics Outlook 2024
A side note, before I begin with the economic data, sometime within the next few weeks, I expect by May 31st, this blog will record the 1,000,000 view. Nearly 500,000 people read on average 2.1 articles every visit. Inflation articles draw the most attention, with a read rate of about 1000 times a week on a slow week and 2,000 on a busy week. Thank you to all my visitors. Keep reading!
2024 construction spending will be measured to the avg of 2023, $1980 bil. The average Seasonally Adjusted Annual Rate (SAAR) for 2023 is the total spending for 2023, but is was lower in Jan and higher by Dec. By Dec the SAAR was already 6% higher than the average for 2023. So we began 2024 with Dec spending at a SAAR 6% above avg 2023.
As of MAR, the total SAAR is 8.1% above 2023. Rsdn is +5.4%, Nonres Bldgs +10.0%, Nonbldg +10.8%. If growth stalls at the current level for the rest of the year, meaning, if we were to end the year with the SAAR unchanged from today, then we would finish with these gains for 2024. The trend in most cases is up, so I expect end of year we will be a little higher than today.
5-24-24 Construction Starts $. Even though Nov and Mar were low, the last 9 months of Nonresidential Bldgs new starts $ was by far the 2nd strongest period of new Nonres Bldgs starts on record, averaging an annual rate (SAAR) of $435 bil. Best since 2nd half 2022 (avg $490 bil.). The last 9 months of Residential $ starts (annual avg $395 bil.) was the best since 1st half 2022 (avg. $438 bil.).
2024 construction spending for Nonres Bldgs, as of MAR, measured to the 2023 avg, is now up +10.0% and trending up. We began 2024 with Nonres Bldgs Dec spending at a SAAR 6% above avg 2023. The American Institute of Architects (AIA) Consensus for Nonres Bldgs, published at the beginning of the year, averages +4% growth over 2023. Only one of the 10 forecasts for Nonres Bldgs spending in the AIA 2024 Consensus is still above the current reading. So, I think it’s safe to say, the AIA Consensus was low right from the very start.
The trend in Nonres Bldgs construction spending is up 18 of the last 19 months and continues up for the next 12 months. To fall to the AIA Consensus average of +4% for the year from the current SAAR, up +10.0%, the remaining 9 months of 2024 would need to fall from the current +10% to average only +2% higher than 2023. It may not be apparent, but that is a continuous decline of more than 1.5% every month for the next 9 months. That’s like falling off a cliff next month and not being able to get up. That’s unrealistic. Unless something sets off a deep recession similar to 2009, that will not happen.
At the beginning of 2007-2010, the first sign of recession for construction was a decline in 2007 of 25% in residential starts. Then in 2008 residential starts fell 40%. In 2009, both residential starts and nonresidential buildings starts fell 30%. Nonbuilding starts fell only 6%. By 2010 starts were increasing. But spending lags starts. Residential spending fell 60% from 2006 to 2009. Nonresidential buildings spending fell 33% from 2008 to 2010.
Although nonres bldgs starts fell 18% in 2020 and residential starts fell 11% in 2023, neither led to a devastating drop in spending as recovery occurred quickly. There is nothing in the current outlook to indicate recession, on any horizon. This forecast does not anticipate a recession.

Since the end of 2019, (in Dec 2019 spending hit $1,464T) total construction spending as of MAR’24 is up 46%. After inflation, Volume is up only 6%. The real Volume of Business is spending minus inflation. More than 85% of the spending growth since Dec. 2019 is inflation. If current projections hold, the total business volume through year 2024 will have grown 10% since 2019. ALL business plan forecasts and labor demand should be based on this 10% growth. Inflation adds nothing to business volume.


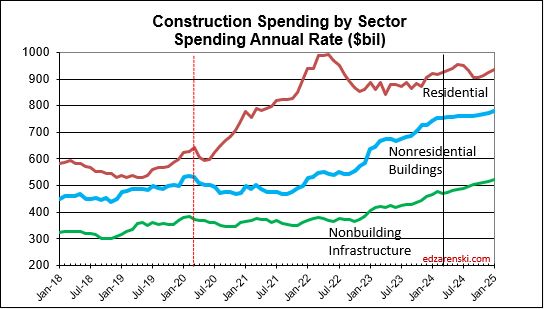

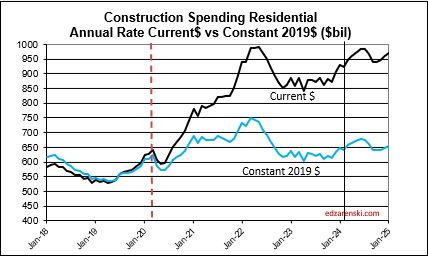
Over the last 9 months, residential new starts (as reported by Dodge) averaged the highest since the peak high in the 1st half of 2022. For Q1’2024, residential starts are 27% higher than Q1’2023. Currently, residential starts for 2024 are averaging 8% higher than the total in 2023. Residential spending peaked at an all-time high in Q2’22. Spending has been level or increasing the last few months at a rate 6.5% lower than the peak, but at a rate 55% higher than Dec 2019. Due to the short durations in residential building, fluctuations in starts are more quickly apparent in spending. Expect both nominal and real (inflation adjusted) spending to continue increasing thru the 1st half 2024, then drop back slightly in the 2nd half 2024. Spending is expected to increase 7% in 2024 over 2023. Volume after inflation should grow 3%.
Single Family spending YTD through Mar. is up 16% from Q1’2023. Single Family rate of spending through Mar. is up 11% over the average (total) spending in 2023. Multi-family spending for Q1’24 is up 6% from Q1’23 and is 2.5% lower than peak spending in Aug ’23, however it’s still up 1% over the avg spending in 2023. These are all nominal values, so real growth is lower. But residential inflation for 2023 was only 3%, so not much lower.


An avg spending curve for long-duration Non-bldg Infra is 15:30:30:20:5. The greatest spending impact does not show up until year two and three after the year in which the projects start. Example: If 2024 posts $100bil in new starts for Infrastructure, only $15bil of that gets put-in-place in 2024. $30bil would get put-in-place in 2025 and 2026.

Plots below compare volume growth to jobs growth. Notice the slope of the increase in jobs is fairly constant, regardless of changes in volume growth.
In the past 18 months, Nonresidential Buildings construction spending increased 37%. Nonres Bldgs JOBS increased only 7%. Normally, this would be explained by inflation, but in this case after adjusting for inflation volume still increased 28%. 18 months, +28% volume, +7% jobs.
Jobs and volume of work should be moving together, evenly. The construction industry has been saying jobs shortages, and yet over an 18mo period, the nonresidential bldgs sector added 20% more volume of work than added jobs. Seems to me that would indicate that volume was absorbed by existing jobs. If there were a significant jobs shortage, either the existing crew would need to work overtime, hours worked would have increased, or the work would not have been put-in-place and would potentially have been delayed or postponed. Neither happened. The fact that the work was put-in-place would indicate that the existing workforce readily absorbed the excess workload.


Since 2016, TOTAL construction spending has increased 63%, but after inflation, business volume increased only 6%, or 1%/yr. From 2016 to 2023, jobs increased 2.5%/yr. When jobs are increasing at a greater rate than the volume of work, productivity is declining. That is shown on these plots when the jobs line is above the volume of work line. Volume and jobs should be moving together.
In 2024, construction volume may increase 6%. Don’t expect jobs to increase 6%.

Since 1980, the fastest rates of growth in construction jobs were 1983-85 avg 6.0%/yr. and 1994-99 at 5.4%/yr. All other plus years averaged +3.2%, with only six years above 4%.
Since 2000, (excluding negative yrs, all associated with recessions) construction jobs growth is 3.3%/yr. and average real volume growth is 3.4%. I would expect future jobs growth to remain within the historical averages, somewhere in the 3%-5% range.
Construction Data FEB Briefs 4-3-24
Updates to Forecast, spending, starts, inflation, jobs
SEE ALSO Construction Analytics Outlook 2024
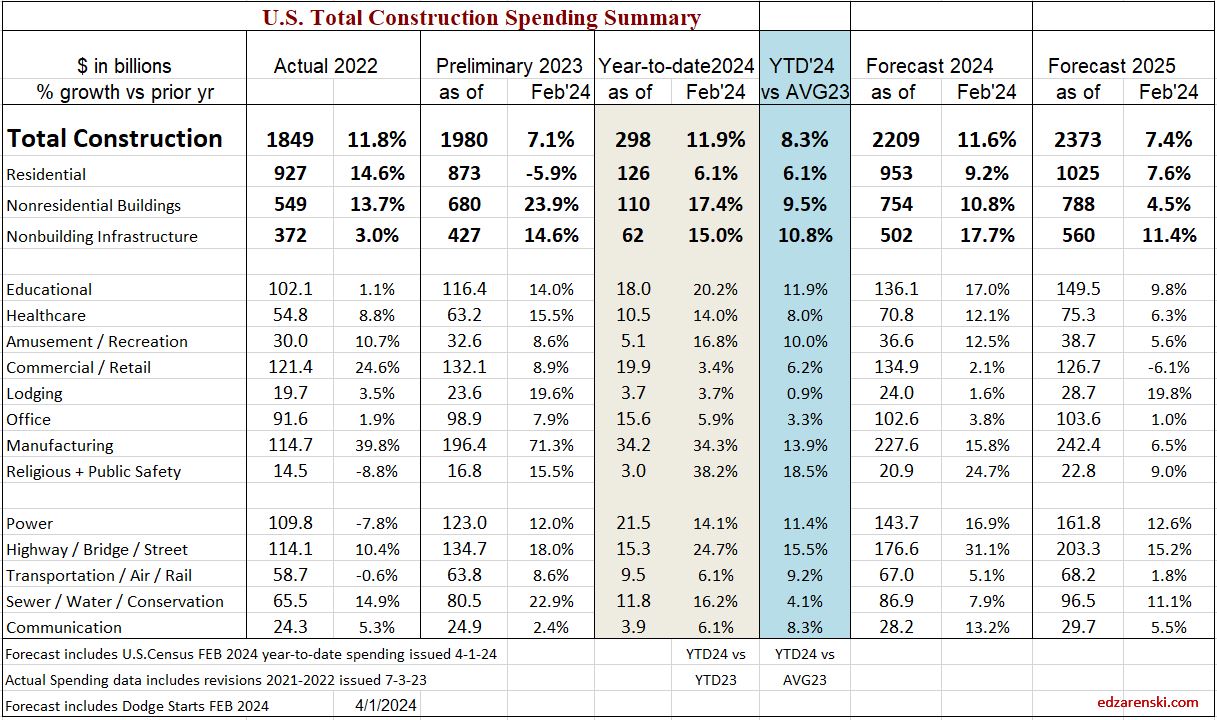
2024 construction spending will be measured to the avg of 2023, $1980 bil. The average Seasonally Adjusted Annual Rate (SAAR) for 2023 is the total spending for 2023. By Dec the SAAR was already 6% higher than the average for 2023. So we begin 2024 with Dec spending at a SAAR 6% above avg 2023.
As of Feb, the SAAR is 8.3% above 2023. Rsdn +6.1%, Nonres Bldgs +9.5%, Nonbldg +10.8%. If growth stalls here for the year, if we were to end the year with the SAAR unchanged from today, then we would finish with these gains for 2024. The trend in most cases is up, so I expect end of year we will be higher than today..
2024 construction spending, as of FEB, measured to the 2023 avg for Nonres Bldgs, is now +9.5% and trending up. The American Institute of Architects (AIA) Consensus for Nonres Bldgs averages +4%. Only one of the 10 forecasts for Nonres Bldgs spending in the AIA 2024 Consensus is still above the current reading.
The trend in Nonres Bldgs construction spending is up 17 of the last 18 months and continues up 9 of the 10 remaining months in 2024. To come close to most of the forecasts in the AIA, Nonres Bldgs spending for next 10 months of 2024 would need to decline drastically. To fall to the AIA Consensus average of +4% from the current SAAR, up +9.5%, all of the remaining 10 months of 2024 would need to fall from +9.5% to only +3% higher than 2023. Unless something sets off a recession, that will not happen.
Since 2019, spending is up 42%. But after inflation Volume is up only 5%. Almost 90% of the spending growth since 2019 is inflation.

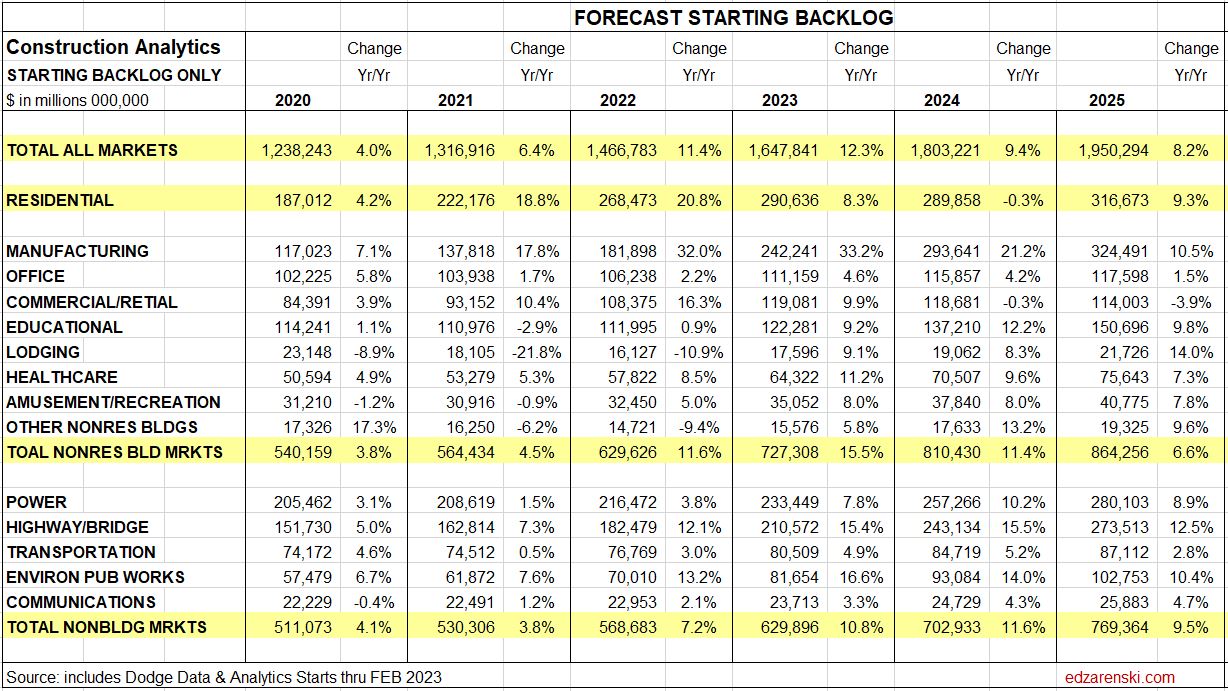
Construction Backlog, the amount of work under contract that is yet to be put-in-place, increased 9% to begin 2024. Nonres Bldgs and Nonbldg both increased over 11%. Although spending is at an all-time high, backlog increases if new starts exceed spending for the year. That could happen if spending decreased, but that is not the case here. It shouldn’t come as a surprise, but manufacturing construction backlog to begin 2024 is up 21%. Highway is up 15%. Environ Pub Works is up 14%.
Don’t try to correlate my Backlog calculation to the Associated Builders and Contractors (ABC) Backlog Indicator. They do not measure the same thing. ABC BI measures current backlog as a percent of previous fiscal year revenues, then multiplies that x12 to get what they refer to as the current remaining backlog months of support. I measure the backlog as the value under contract remaining to be completed at the start of this year compared to the backlog at the start of last year.
Neither of these give any indication of WHEN backlog gets spent. Backlog is never an indication of the amount of work to be completed in the given year. Some backlog gets spent over long duration projects that may go yet for several years.



An avg spending curve for long-duration Non-bldg Infra is 15:30:30:20:5. The greatest spending impact does not show up until year two and three. Example: If 2024 posts $100bil in new starts for Infrastructure, only $15bil of that gets put-in-place in 2024. $30bil would get put-in-place in 2025 and 2026.
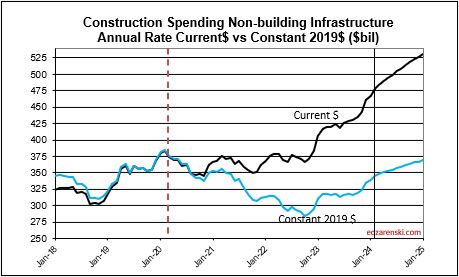
Manufacturing construction spending increased 80% in the last 18 months. After inflation volume increased 70%. Mnfg is 30% of all Nonres Bldgs spending, but generated 60% of the increase in Nonres Bldgs spending over the last 18 months.

In my forecast, every major sector ticks up each of next 3mo. All markets tick up each of Feb-Mar-Apr, except for Commercial/Retail. Warehouse starts, which comprise 60% of Comm/Rtl, fell 20% in 2023 and are forecast down 10%+ in 2024.

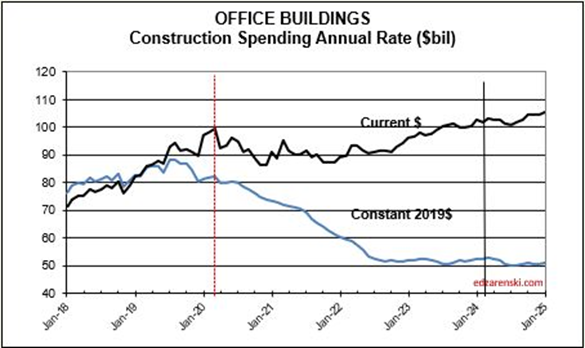
Looking at the Office Bldgs plot, keep in mind, the Office Bldg market includes Data Centers, where spending has increased.

In the past 18 months, Nonresidential Buildings construction spending increased 37%. Nonres Bldgs JOBS increased only 7%. Normally, this would be explained by inflation, but in this case after adjusting for inflation volume still increased 28%. 18 months, +28% volume, +7% jobs.
Jobs and volume of work should be moving together, evenly. The construction industry has been saying jobs shortages, and yet over an 18mo period, the nonresidential bldgs sector added 20% more volume of work than added jobs. Seems to me that would indicate that volume was absorbed by existing jobs.
In 2023 Nonresidential Building construction jobs increased 3.6%. In that same time Nonres Bldgs spending increased 24%. After inflation volume of business increased 17%. I wouldn’t be surprised if construction job openings remain elevated all through 2024.

Since 2016, construction spending has increased 63%, but after inflation, business volume increased only 1%/yr. From 2016 to 2023, jobs increased 2.5%/yr. Volume and jobs should be moving together.
In 2024, construction volume may increase 7%.
Construction Jobs increased every month since last Mar. In fact, there’s been only 2 down months in last 2 yrs. But in both Dec and Jan, avg hrs worked fell more than jobs added, so total hrs worked declined. Overall avg hrs worked for 2023 is up 4%. Volume is increasing.


Construction Analytics Outlook 2024
Construction Analytics Economic Outlook 2024 includes Construction Data – DEC 2023 Data 2-7-24
2-22-24 At the bottom of this article is a downloadable PDF of the complete 2024 Outlook
Here is a summary of construction spending through December 2023, Inflation through 4th qtr. or Nov where available, and resulting constant dollar volume. 2023 spending will be revised three times in 2024, Mar1, Apr1 and Jul1, and then again on Jul1 2025. Historically, almost all revisions are up.
Construction spending preliminary total for 2023 is up 7.0%. But nearly 80% of that total is inflation. Except for Nonresidential Bldgs, spending increased 23%, so inflation is only 25% of that. Even deducting inflation still leaves 75% of spending as volume growth Most of that growth is in Manufacturing buildings.
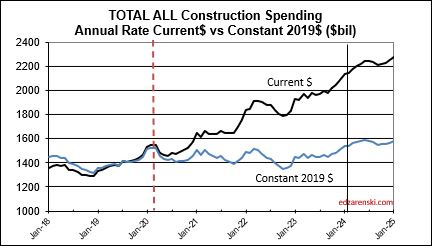
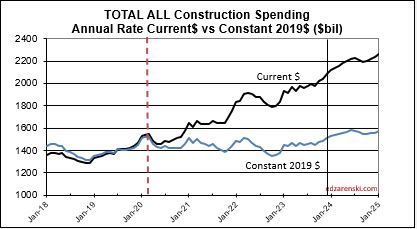
Spending is up a total of 42% since 2019; up 8% in 2020, 10% in 2021, 12% in 2022 and now 7% in 2023. But volume after adjusting for inflation is up only 5% total. You can see the Constant$ line, with one lower dip in 2022, has ranged between Constant$1400bil. to $1500bil. since mid-2019.
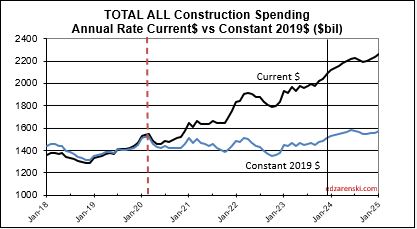
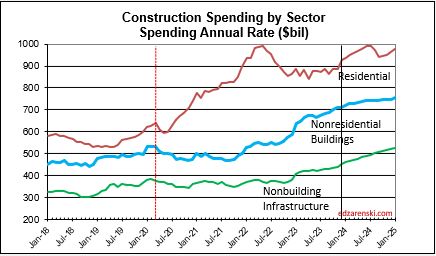
Construction spending total forecast for 2024 is up 10.7%. Nonresidential Buildings is forecast up 8.8%, Non-building Infrastructure up 15.8% and Residential up 9.7%. Lower inflation in 2024 means more of that spending is counting towards real volume growth. I’m expecting only 4% to 5% inflation for 2024, so real volume growth could reach 6% for the first time since 2015. From 2012-2016, volume growth averaged 6%/yr. For the last four years, 2020-2023, 42% spending growth vs 37% inflation growth netted only 5% total real volume growth. Since 2017, volume growth averaged less than 1%/yr. Non-building Infrastructure volume could increase 10%+ in 2024.

New Construction Starts
Dodge Construction Network (DNC) monthly news article of construction starts by sector provides the data from which the following is summarized.
Total construction starts for 2023 ended down 4%, but Nonresidential Buildings starts finished down 7% and Non-building Infrastructure starts were UP 16%. Residential starts decreased 12% in 2023.
Total construction starts for 2024 are forecast up 7%. Nonresidential Buildings starts are forecast up 5% and Non-building Infrastructure starts up 8%. Residential starts are forecast up 10% in 2024.
In recent years, Nonres Bldgs new starts averaged $300 billion/year. In the 2nd half of 2022, starts averaged near $500 billion/year. For the 1st half 2023 starts dropped to a rate of $390bil./yr., which is still well above the recent average. Then, for 2nd half 2023, starts came back up to average $430 billion/year, the 2nd highest half year average. A 50% increase in new nonresidential building starts in 2022 has a positive impact on the rate of construction spending in 2023 and 2024. It will continue to add lesser impact into 2025. Projects starting in 2nd half of 2023 could have midpoint of construction, point of peak spending, in 2024 or into 2nd half of 2025, some real long duration starts even later. So, the major spending impact from starts is sometimes one or two years later.
Residential construction (Dodge) starts posted the five highest months ever, all in the 1st 6 months of 2022. In the second half of 2022, residential starts fell 15%. In Q1 2023, residential starts dropped another 12% below 2nd half 2022, the lowest average since Q1-Q2 2020. Finally in July and August, starts regained some strength coming in 33% higher than the lows in Q1. Residential starts finish 2023 down 12% vs 2022. Forecast is up about 10% in 2024.
Nonresidential Buildings, in 2022 posted the largest ever one-year increase in construction starts, up 50%. Some of these starts will be adding to peak spending well into 2025. Nonres Bldgs starts in the 2nd half 2022, averaged 67% higher than any other 6mo period in history. Starts fell 20% in the 1st half 2023 but still posted the 2nd highest 6mo average ever. After two years of outstanding growth, Nonres Bldgs starts close 2023 down 7%. Although 2023 is down 7%, that’s still by far the 2nd best year ever. The forecast for 2024 is +5%.
Manufacturing starts, the market with the largest movement, gained 120% from 2020 to 2023. Manufacturing projects can have a moderately long average duration because some of these are multi-billion$ projects and can have schedules that are 4 to 5 years.
Educational, Healthcare, Lodging and Public Buildings all had starts of 20% or more the last two years.
Non-building starts for the 6 month period Mar-Aug 2023 posted the best 6 months on record, up 30% from the average of 2022. The 2nd half 2022 was up 50% over 1st half 2022. For 2023, Highway/Bridge and Power have the strongest gains. Total Non-building Starts for 2023 are up 16% and they were up 25% in 2022. These starts will help elevate spending through 2025. Non-building starts for 2024 are forecast up 8%.
Power starts are up 25% the last two years. Highway starts and Environmental Public Works are both up 33% the last two years and up 50% the last three years.
Starts data captures a share of the total market or only a portion of all construction spending, on average about 60% of all construction. The easiest way to understand this is to compare total annual construction starts to total annual spending. National starts in recent years about $800 billion/year, while spending in this period ranges from $1,300 billion/year to $1,500 billion/year. From this simple comparison we can see starts captures a share of about 60% of the total market. The actual share for each market varies from as low as 35% to as high as 70%. Before using starts data to forecast spending, starts here were first adjusted for market share.

Starting Backlog
Starting backlog is the estimate to complete (in this analysis taken at Jan 1) for all projects currently under contract. The last time starting backlog decreased was 2011. If new construction starts in the year are greater than construction spending in the year, then for the following year starting backlog increases. It’s when new starts don’t replenish the amount of spending in the year that backlog declines.
80% of all nonresidential spending in any given year is from backlog and could be supported by projects that started last year or 2 to 4 years ago. Residential spending is far more dependent on new starts than backlog. Only about 30% of residential spending comes from backlog and 70% from new starts.
The table below, Forecast Starting Backlog, is model generated by Construction Analytics. Adjusted starts are spread over time to generate cash flow. A sum of spending each month/year, subtracted from start of year plus new starts provides Backlog.

Construction Backlog leading into 2024, in every sector, is at all-time high, in total up 46% from Jan 2020. For the years 2022 and 2023, backlog is up 11% and 12%. Reaching new highs in Backlog could mean contractors are comfortable adding some backlog, or it could mean not enough labor, subcontractors or suppliers to support advancing growth so quickly, so growth advances slower and more of the work is retained in backlog for longer, essentially dragging out the timeline, or it could be long term workload, 4yr.-6yr. long projects from new starts, such as Manufacturing, where a very large amount enters backlog and gets spent over 4-6yrs., so, although the monthly drawdowns reduce the amount remaining in backlog, it remains in backlog for a long time.
Residential backlog in 2024 is down 0.5%, but from such a previous high, essentially, starts are riding flat along the top. Starts are up 55% since Jan 2020.
Nonresidential Bldgs starting backlog for 2024 received a boost from all the starts in 2022 and 2023. Backlog is up 12% from 2023 and up 50% from Jan 2020.
Nonbuilding Infrastructure starting backlog is up 12% each of the last two years boosted by strong starts in 2022 and 2023. For 2024, backlog is up 40% from Jan 2020.
Manufacturing backlog increased nearly 300% from 2020-2024, from $117bil going into 2020 to $300bil beginning 2024. No other market has ever been close. Manufacturing was responsible for 60% of all the Nonres Bldgs spending growth in 2023. It was also responsible for 60% of the Backlog growth leading into 2024. Nonres Bldgs has a total 3.6 million jobs and has never increased by more than 150,000 jobs in one year. Manufacturing is 30% of all Nonres Bldgs spending, so assume 30% of Nonres Bldgs jobs. That’s 1.2million jobs supporting just Manufacturing projects. So Backlog of $300bil, at 5000 jobs per billion per year, would need 1,500,000 jobs for a year. With a 1,200,000 jobs share of the workforce, that backlog would provide support for 15 months. Of course, new starts add to support throughout the year, but the calculation of how long backlog would support that market segment is valuable.
Backlog at the beginning of the year or new starts within the year does not give an indication of what direction spending will take within the year. Backlog is increasing if new starts during the year is greater than spending during the year. An increase in backlog could immediately increase the level of monthly spending activity, or it could maintain a level rate of market activity, but spread over a longer duration. In this case, there is some of both in the forecast. It takes several years for all the starts in a year to be completed. Cash flow shows the spending over time.
Current Rate of Spending
The current seasonally adjusted annual rate (SAAR) of spending gives an indication of how spending will perform in the following year. As we begin 2024, the current rate of spending (SAAR) for Nonresidential Buildings in Q4’23 is $709bil., already 4.5% higher than the average for 2023 ($677bil). If spending stays at the current level and no additional growth occurs, Nonresidential Bldgs spending will finish 2024 up 4.5%. Spending would need to have more monthly declines than increases to finish the year up less than 4.5%. The current forecast shows a monthly SAAR rate of growth for Nonresidential Bldgs. averaging about 0.5%/mo in 2024, so we have a minimum, but we can expect 2024 total spending to rise considerably higher than the current rate.
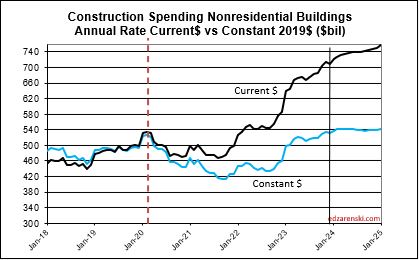
Non-building Infrastructure current rate of spending is now 3.7% higher than the average for 2023, however the forecast is indicating steady growth of 1%/mo for all of 2024.

Residential current rate of spending is 2.4% above the 2023 average and is forecast to average an increase of just under 1%/mo for 2024.

2024 Construction Spending Forecast
Starts lead to spending, but that spending is spread out over time. Starts represent a contract award. Spending takes the amount of that contract award and spreads it out by a cash flow curve over the duration of the job. An average spending curve for the sum of nonresidential buildings is 20:50:30 over three years. Only about 20% of new starts gets spent in the year started. 50% gets spent in the next year and 30% in YR3/4. An average spending curve for Non-building Infrastructure is more like 15:30:30:20:5. The effect of new starts does not show up in spending immediately. For example: If 2024 posts an additional $100 billion in new starts for Infrastructure, only about $15 billion of that would get put-in-place in 2024. The cash flow schedule for that $100 bil of new starts would extend out over 3 to 5 years. Most of that $100 bil would get spent in 2025 and 2026.
Total Construction Spending $2,190 billion +10.7% over 2023.
Nonresidential Buildings $737 billion +8.8% over 2023.
Non-building Infrastructure $493 billion +15.8% over 2023.
Residential Buildings $960 billion +9.7% over 2023.
This forecast does not include a recession.
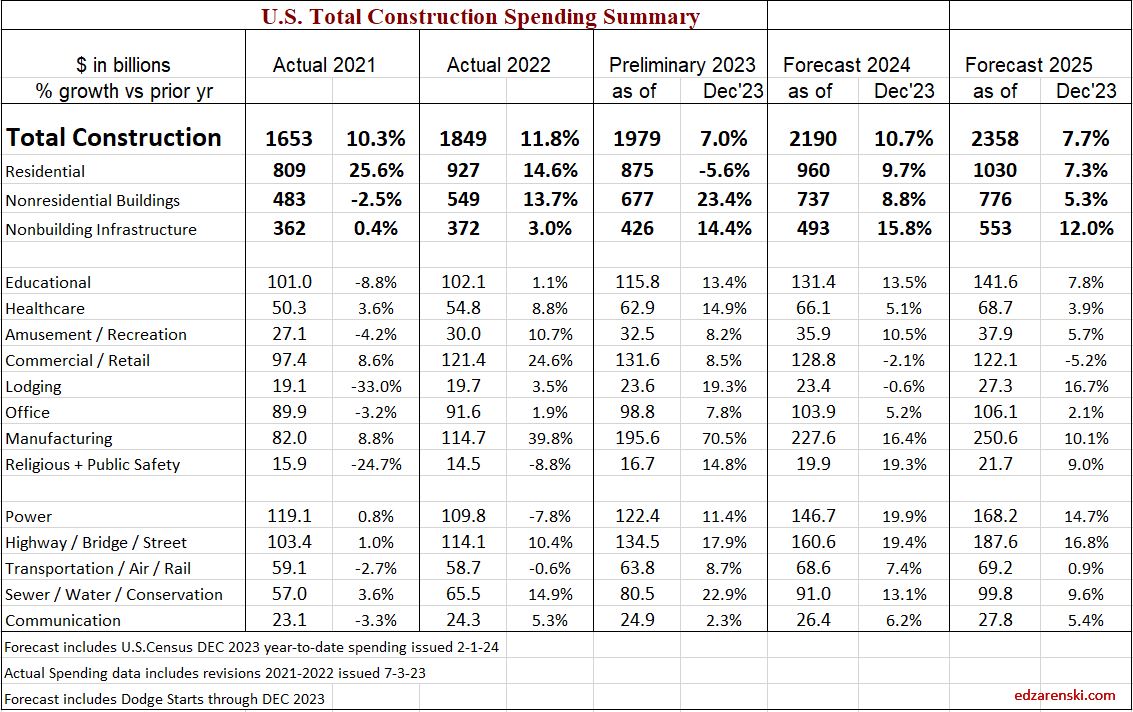
The largest increases to construction spending in 2023 are Manufacturing +$80bil, Highway +$20bil, Public Utilities (Sewage and Waste, Water Supply and Conservation-Rivers-Dams) +$15bil and Educational +$14bil.
Residential regains the top growth spot in 2024 with a forecast spending increase of +$68bil. Manufacturing is forecast to add +$32bil. Highway gains +$26bil, Power +$24bil and Educational gains +$15bil.
One big question is how did the forecast for Manufacturing increase so much since the beginning of 2023. Since January 2023, the starts forecast for 2023 increased by 35%. How much of that 35% is real growth in starts vs an increase in the capture rate of data gathering is yet to be determined, but has an impact of 2023-2024 spending. Also, starts for future years were increased by 50%. Starts (contract awards) drives up the spending forecast, since spending is a function of the future monthly cash flow (spending) of starts.
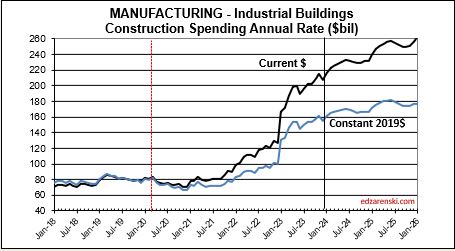
As we begin the year, Manufacturing SAAR current rate of spending is already 8% higher than the average for 2023. The current rate of spending is increasing at an average of near 2%/month for the next 6 months, then slows or dips slightly for the remainder of the year, indicating total spending for 2024 will finish well above the current rate of 8%. I’m forecasting 16% growth for the year.
Highway SAAR rate of spending begins the year 6.5% higher than the average for 2023, with the current rate increasing at an average of 1%/month for all of 2024, indicating total spending for 2024 will finish well above the current rate of 6.5%. Starts have increased +15%/yr the last three years. My forecast is for 19% growth in 2024 spending.

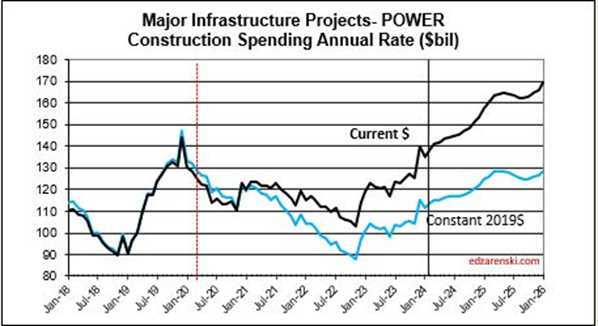
Power SAAR rate of spending begins the year 4% higher than the average for 2023, with the current rate increasing at an average over 1%/month for 2024, indicating total spending for 2024 will finish much higher. My forecast is for 20% growth in 2024.

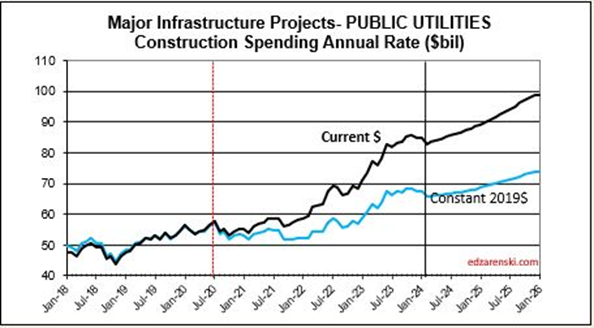
Public Utilities SAAR rate of spending begins the year 6% higher than the average for 2023, with the current rate increasing at an average over 1%/month for 2024. Public Works averaged +15%/yr new starts the last three years. My forecast is for 13% spending growth in 2024.

Residential regains the top spot in 2024 with a forecast spending increase of $68bil. Residential SAAR rate of spending in Q4’23 was up 2.5% over 2023, but December was up 5%. So we begin the year 2.5% to 5% higher than the average for 2023. The rate of spending is forecast to increase 1%/month for 6 months, then fall 0.5%/mo for H2 2024. My forecast is for 10% growth in 2024.

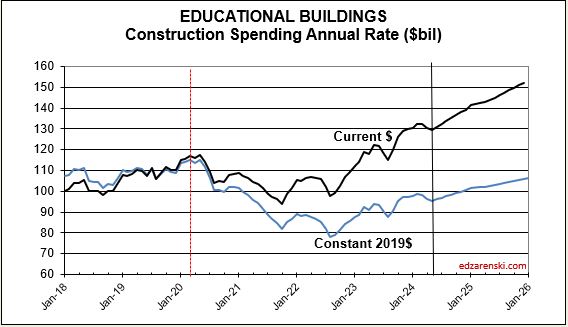
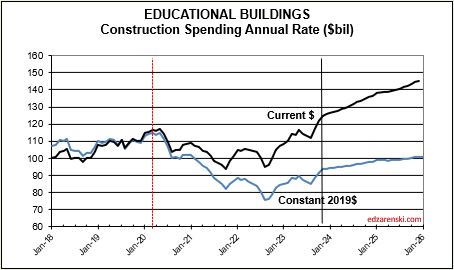
Educational SAAR rate of spending begins 2024 7% higher than the average for 2023, and the current rate is increasing at an average of 0.7%/month for 2024. My forecast is for 13% growth.
Inflation
Construction Inflation differs from other common types of inflation, i.e., Consumer Price Index. It must be accounted for in order to make reasonable calculations for business volume and past or future costs.
30-year average inflation rate for residential and nonresidential buildings is 3.7%. Excluding deflation in recession years 2008-2010, for nonresidential buildings is 4.2% and for residential is 4.6%.
Deflation is not likely. Only twice in 50 years have we experienced construction cost deflation, the recession years of 2009 and 2010. That was at a time when business volume dropped 33% and jobs fell 30%. During two years of the pandemic recession, volume reached a low down 8% and jobs dropped a total 14%.But we gained back far more jobs than volume. That means it now takes more jobs to put-in-pace volume of work. That increases inflation.
The following Construction Inflation plot (for Nonresidential Buildings only) shows three elements: 1) a solid grey bar reflecting the max and min of the 10 indices I track in my weighted average inflation index, 2) a solid black line indicating the weighted average of those 10 indices, and 3) a dotted red line showing the Engineering News Record Building Cost Index (ENR BCI). Notice the ENR BCI is almost always the lowest, or one of the lowest, indices. ENR BCI, along with R S Means Index, unlike final cost indices, do not include margins or productivity changes and in the case of ENR BCI has very limited materials and labor inputs.

Final cost indices represent total actual cost to the owner and are generally higher than general indices. Producer Price Index (PPI) INPUTS to construction reflect costs at various stages of material production, generally do not represent final cost of materials to the jobsite and do not include labor, productivity or margins. Even with that, a PPI Inputs index +20% for a material could be only a +5% final cost. PPI Final Demand indices include all costs and do represent actual final cost. The solid black line (above) represents the Construction Analytics Building Cost Index for Nonresidential Bldgs and is a final cost index.

This short table shows the inflation rate for each year. Useful to compare to last year, but you would need to mathematically do the compounding to move over several years. The plot below shows the cumulative inflation index, or the cumulative compounded effect of inflation for any two points in time.
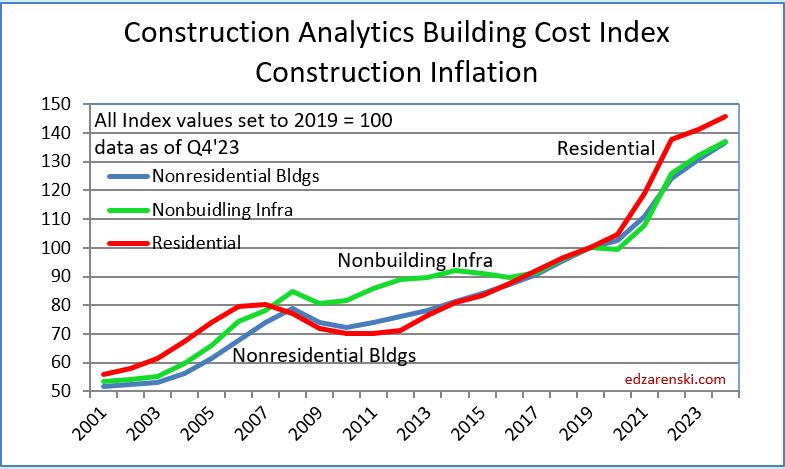
Typically, when work volume decreases, the bidding environment gets more competitive. We can always expect some margin decline when there are fewer nonresidential projects to bid on, which typically results in sharper pencils. However, when labor or materials shortages develop or productivity declines, that causes inflation to increase. We can also expect cost increases due to project time extensions or potential overtime to meet a fixed end-date.
Current$ Spending, Inflation, Constant$ Volume
Volume = spending minus inflation. Spending includes inflation. Inflation adds nothing to the volume.
Inflation adjusted volume is spending minus inflation, or to be more accurate, spending divided by (1+inflation). Inflation adds nothing to volume growth. The following table shows spending, inflation and volume (spending without inflation) for each year. Spending is current to the year stated. The values in the constant table are indexed to a constant value year, 2019. This shows business volume year to year, can be a lot different than spending would indicate. When inflation is positive, volume is always less than spending by the amount attributed to inflation.
Lower inflation in 2024 means more of that spending is counting towards real volume growth. Expecting only 4% to 5% inflation for 2024, real volume growth could reach 6% for the first time since 2015. From 2012-2016, volume growth averaged 6%/yr. For the last four years, 2020-2023, 42% spending growth vs 37% inflation growth netted only 5% total real volume growth. Since 2017, volume growth averaged less than 1%/yr. Non-building Infrastructure volume could increase 10%+ in 2024.
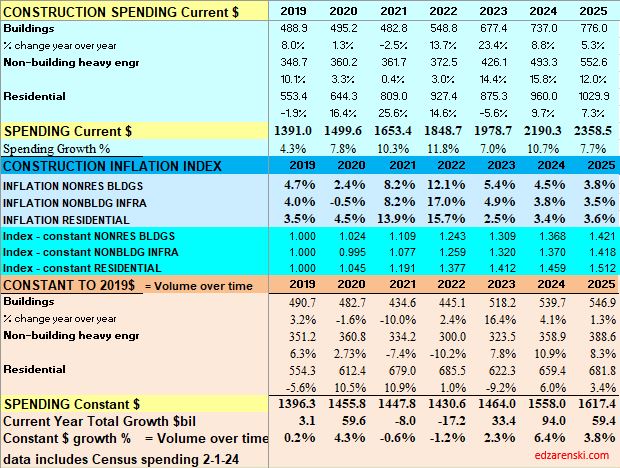
Spending during the year is the value of business volume plus the inflation on that volume. When inflation is 12%, volume plus 12% = total spending. Revenue is generally measured by spending put-in-place during the year. Revenue does not measure volume growth. In 2022, Nonresidential buildings inflation was 12%, so business volume was 12% less than spending, or 12% less than revenue. Residential volume was 15% less then spending.
When referencing Constant $ growth, remember the dollars for all years are reported here as 2019$. If the baseline year is changed to this year (divide all indices by this year’s index), the resulting comparison would be all years reported as 2024$. The dollars would all be greater, but the percent change would be the same. In this table, nominal spending is divided by the inflation INDEX for the year. You can also deduct the percent inflation from any individual year of spending to find inflation adjusted $ for that year alone, however that method would not allow comparing the adjusted dollars to any other year. A baseline year is necessary to compare dollars from any year to any other year.
Reference Inflation Data Construction Inflation 2024
Through December 2023, Total Construction Spending is up 40% for the four years 2020-2023, but, during that same period inflation increased 35%. After adjusting for 35% inflation, constant $ volume is up only 5%. So, while the current $ spending plot shows a four-year total increase of 40% in spending, the actual change in business volume is up only 5% and has just in the last few months returned to the pre-pandemic peak in Feb-Mar 2020.

Jobs are supported by growth in construction volume, spending minus inflation. If volume is declining, there is no support to increase jobs. Although total volume for 2023 is up 2.3%, Residential volume is down 9%, Nonresidential Bldgs volume is up 16% and Non-building volume is up 8%. Inflation was so high in 2021 and 2022 that it ate away most of the spending gains in those years.
Jobs vs Volume
Construction Jobs increased 2.75% in 2023. We added 214,000 jobs (avg’23-avg’22). There are currently 8,056,000 construction jobs. The largest annual increase post 2010 is 321,000 jobs (+4.6%) in 2018. The average jobs growth post 2010 is 200,000 jobs per year.
Since 2010, average jobs growth is 3%/yr. Average volume of work growth since 2010 is 2.3%/yr. This plot shows Jobs and Volume growth closely match from 2011 to 2018. With few exceptions for recession periods, this pattern can be seen throughout the historical data.
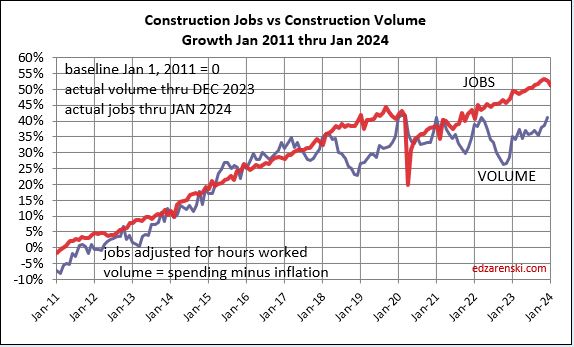
What’s remarkable about the growth is this, since 2016, spending has increased 63%, volume after inflation increased 6% and jobs increased 19%. In the last 7 years, 2017-2023, jobs increased 2.5%/yr. Volume of work increased only 0.8%/yr. Volume and jobs should be moving together.
It takes about 5000 jobs to put-in-place $1 billion of volume in one year. It could easily vary from 4000 to 6000. So, an add of $100 billion+ in one year would need 500,000 new jobs. Jobs should track volume, not spending growth. Volume = spending minus inflation.
Normal construction jobs growth is about 250,000 jobs per year and maximum prior growth is about 400,000. From the table above, Nonresidential Bldgs and Non-building Infrastructure added $100bil of volume in 2023 and will add $60bil in 2024. The workload discussed above would theoretically require 500,000 new jobs in 2023 and 300,000 more in 2024. That’s an expansion of the industry workforce by 10% in two years, for just half the industry, in an industry that normally grows in total 3%/yr. This industry can’t grow that fast. This may have some impact if over-capacity growth results in a potential reduction or extension in future forecast. You can’t increase spending that fast if you can’t also expand the labor force and the suppliers to the industry that fast.
In the last 12 months, Dec’22 to Dec’23, Nonres Bldgs jobs are up 4%. Nonres Bldgs spending is up 23%, by far driven by Manufacturing, but after ~5.4% inflation, volume of nonres bldgs workload is up 16%. So, we have a 4% increase in jobs versus a 16% increase in volume.
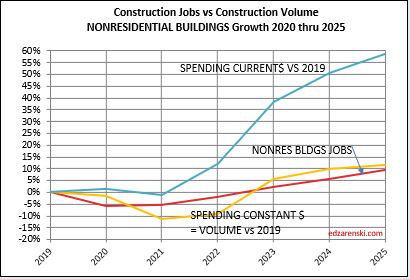
The last year has shown a huge increase in the volume of nonres bldgs work, without an equal increase in jobs. Is this excess nonres bldgs jobs for the past three years now absorbing added workload, (a 4% increase in jobs but a 16% increase in volume), without collapsing the labor force or canceling the volume?
Non-building, over the next two years, could experience the same kind of growth spurt as Nonres Bldgs., a forecast increase in volume the next two years without an equal increase in jobs. Volume which was lower than jobs since 2021, is now increasing faster than jobs. Non-bldg volume is forecast up 6% to
8%/year the next 3 years. Jobs increase at an avg. 3.5%/year.

Residential volume has exceeded residential jobs all the way back to 2011. The recent decline in volume brings the two even, if the jobs hold the pace.
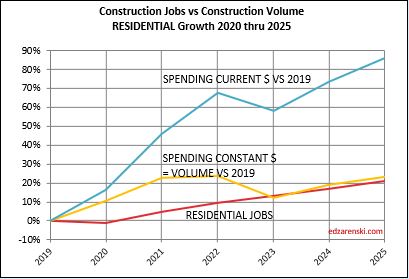
For as long as I can remember, the construction industry has been complaining of jobs shortages. And yet, as shown in the data mentioned above, jobs have increased multiples times greater than volume of work. With an exception for recession years, (2007-2010 and 2020), jobs increase at a rate of 2.5% to 3% per year. The greatest disparity between jobs and volume occurred in late 2022, when jobs growth had already resumed normal pace, but volume of work was still reeling from the effects of new construction starts that were canceled dating back to late 2020-early 2021. Recent volume growth at a much faster rate than jobs growth is now closing the gap.
When jobs increase without an equal increase in the volume of work, productivity declines. This recent increase in volume and the projected increase in volume in 2024, several points stronger than jobs, will offset some of the disparity which has been negative for a long time.

Reference Inflation Data Construction Inflation 2024
Reference Article The Next Forecast Challenge
Reference Article Midyear ’23 Jobs Outlook
Reference Article Reliability of Predicted Forecast
Reference Link to Web Dodge Construction News
Below is a downloadable 24 page PDF of the complete 2024 Outlook

Construction Data Briefs Sept data 11-7-23
Total Construction Spending in 2023 is forecast at $1,960 billion, an increase of 6.0% over 2022.
Nonresidential Buildings spending is leading Construction spending growth.
With nine months in the year-to-date (ytd) for 2023, total all construction spending ytd is up 4.6%. Nonresidential buildings spending is up 22% ytd compared to Jan-Sep 2022. Manufacturing last month was up 72% ytd. I forecast then it would drop to 66% and this month revised that to 67%. Current ytd dropped this month to 70%.
Construction Spending thru Sept. Residential is down 8% ytd. Could add 7% in 2024. Nonresidential Bldgs is up 22% ytd. Expect +6% in 2024 Non-building Infrastr is up 12% ytd and could add another 11% in 2024

Residential construction spending fell only 8% from Mar’20, the pre-recession high, to May’20, the Covid low. From May’20 to May’22, spending increased 67% to the post-recession high. Since May’22 spending is down 12%.
Manufacturing construction spending, from 2015-2021, averaged $80bil/yr. For 2023-2025, manufacturing constr spending will average $200bil/yr.
Highway spending in 2023 is averaging $130bil and is expected to finish the year at $131bil. That’s up 15% from 2022 and up almost 27% in the last two years. Highway spending is expected to increase 25% over the next two years and may continue upward to a peak spending in 2026.
After nearly 8-10 years of fairly well balanced construction volume of work vs jobs, the last 2-4 yrs of volume growth (spending minus inflation) well below jobs, is now coming back into balance. Nonres Bldgs and Non-bldg volume (+11% & +6%) increased to support jobs. Jobs grow steady at 2.8%.
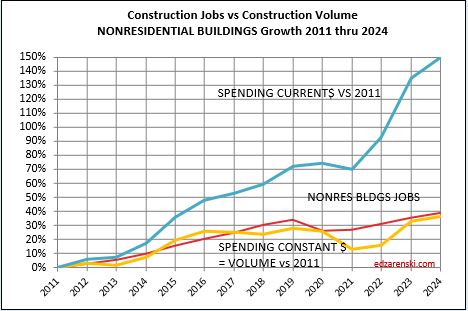
Non-bldg has a ways to go to get to balance. That work volume is on it’s way in the forecast, particularly from Highway and Public Utilities.
Actual residential jobs is probably higher than shown here as there are several issues with capturing all residential jobs.
Sum of all jobs vs Construction volume from 2011-2018 was balanced. In recent years, 2021-2023, jobs grew faster than volume. Nonres is now playing catch-up, volume is increasing faster than jobs..

Construction Jobs x hours worked is up 6% since the pre-pandemic high in Q1 2020. Construction volume (spending minus inflation) is down 5.5% since Q1 2020. These two indicators should move in tandem. (See plot above from Jan2011 to Jan2018) When jobs increase faster than the volume of work, productivity is declining.
For 2024 and 2025, volume of work is forecast to increase 3.5% and 4.0%. Most of that gain in 2024 and 2025 is from Non-building Infrastructure forecast growth of 7% and 8%. Jobs increase at a normal rate of 2.5% to 3.0% per year, so this growth in volume will go a long way towards setting jobs vs volume closer to balance.
An indicator I track looks at the predicted final spending (for Nonresidential buildings) for the year based on a projection based on the ytd for the statistically strongest months of the year, AMJJAS. These six months each average annual spending variation from average with standard deviation of less than 0.2%. This subset of annual data has produced an annual forecast within less than 2% variance from actual for 22 years. In fact, in 22 years this forecasting check has varied from actual by greater than 1.5% only twice. The average variation for 22 years is 0.7%. Only once in 22 years has the actual annual spending fell outside the range predicted by the statistically strongest months.
Another indicator I track is the forecast vs the actual spending. This plot shows Nonres Bldgs and Non-bldg Infra forecast vs actual. The track of actual spending is bumpier, but tracks right along with the forecast. My plot for residential was on track until the surge in 2020-2021.

Present Cost-Future Cost vs Present Value-Future Worth
A reader asked an interesting question, one that does not often come up in construction analytics. The following is an example to explain the difference.
The question: Our firm engages in construction projects that must be fully funded from cradle to grave to secure approval. A portion of these projects is remediation that will occur 10 years from now. What would be the Present Value to fund a project needed to be performed 10 years from now based on a similar project that cost $1,000,000 three years ago?
There are really two parts to this question. 1) What is the construction cost of remediation 10 years from now? 2) What is the Present Value of money today needed to fund that construction cost ten years from now?
- is determine the construction cost in 10 years based on inflation rates and a known project cost.
- is What is the value of money. How much do I need today to fund the project 10 years from now.
For the sake of this example we must assume some rates. Assume construction cost inflation the last three years was a total 25% and long term average inflation is 4%.
Present Cost to Future Cost is solved by applying construction inflation. To estimate cost of a project 10 years from now, we can only rely on long term average inflation for the type of work being performed. Long term average inflation is not the same as the inflation we have experienced over the last three years. So first let’s inflate the project from three years ago at 25% to today’s construction cost.
$1,000,000 (three years ago) x (1+25%) = $1,250,000 = similar project cost today.
Now let’s use long term average inflation (4%) to determine the construction cost 10 years from now. Inflation (like interest) must be compounded. So total interest over 10 years is interest for one year raised to the 10th power.
$1,250,000 (today’s cost) x (1+4%)^10 = $1,250,000 x 1.48 = $1,850,000
We would never assume the long term inflation to be repetitive of what we’ve seen over the last three years, so we use what we know occurred over the last three years to get to today, then project forward at the long term average historical rate.
The remedial work 10 years from now is estimated to cost $1,850,000. That is the Future Worth (FW) of the construction work needed. What is the Present Value (PV) of money needed to fund that Future Worth (FW)? How much must be invested in an account today so that it will grow to provide the funds needed to perform the FW work?
The growth rate of money is not the same as the inflation rate of construction. For the sake of this example, we need to make some assumption here for the growth rate of money. Let’s assume 3%. If we were to invest money today it can grow at 3%/year for 10 years. The answer to how much is needed to invest today (PV) to provide the full sum needed to fund the future (FW) is entirely dependant on the interest rate that can be secured for the term of the investment. We need $1,850,000 ten years from now. Divide the FW by the compounded rate of interest or money growth to find PV.
$1,850,000 (FW) / (1+3%)^10 = $1,850,000 / 1.34 = $1,376,000 (PV)
A Present Value (PV) of $1,376,000 must be invested today at a rate of 3% growth to ensure enough funds are available 10 years from now to perform the remediation work, a (FW) of $1,850,000.

