Construction volume is spending minus inflation. If we want to know whether business is growing, we need to look at spending without inflation, or volume of business.
Volume is what dictates the need for jobs.
If an apple this yr cost 50c, and last yr it cost 40c, the revenue changing hands has gone up 10c or 25%. Volume of business changing hands has not changed, it’s still only one apple.
Inflation adds nothing to the volume of business.
For 2021 and 2022, total construction spending increased 8.5% and 10.6%. But, inflation was 11% and 15%. In both years, inflation was higher than spending. First, subtract inflation from the total spending. That’s gives the dollar amounts for the Spending w/o Inflation Current $ table. Then volume growth can be compared year to year. Volume growth calculation is Vol this yr/Vol last yr, but first, it is dependent on each individual year spending minus inflation.

Volume each individual year is calculated as spending minus inflation. But growth in Volume from yr to yr is Vol this yr/Vol last yr., so is often different than growth in spending.
The volume of construction work completed in 2021 ($1.467tril) is 11% (avg inflation 2021 less than 2021 spending ($1.626tril)
The volume of work completed in 2022 ($1.574tril) is 15% less than 2022 spending ($1.798tril)
So, while Spending growth is 1.798/1.626 = 10.6%, Volume growth is 1.572/1.467= 7.2%.
The table above shows Current Spending and Current Volume. It is not indexed to a common point in time. The table below is Constant Spending which represents Volume indexed to a point in time, in this case 2019. The percent change year to year is what is plotted in charts below.
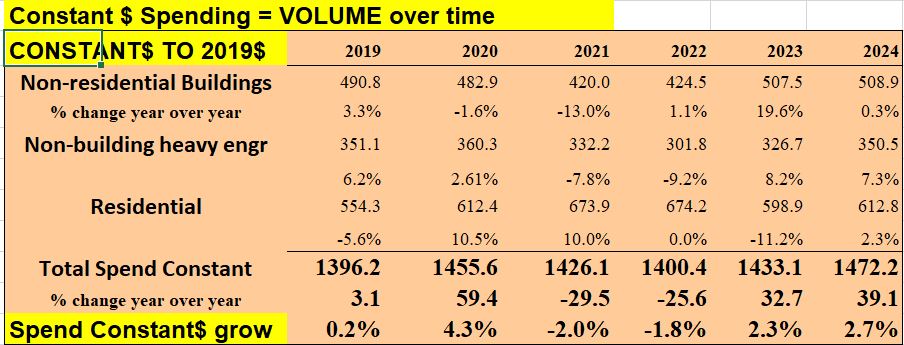
All the plots below show spending, volume and jobs. Current $ in 2010 are not the same as current $ in 2023, so all $ are indexed to the same constant point in time, constant $, so they can be compared. Constant $ then shows the cumulative growth from that point in time.
This plot shows the cumulative change in Total All Spending, Volume and Jobs since Jan. 1, 2020. From 2019 to 2022, Spending is up 29%, Volume is up only 18% and Jobs are up only about 2%. Below are plots that show the differences in jobs and volume growth for each sector.

Residential 2022 spending is = $900bil. Inflation is 15%. Without inflation, residential volume is up $780bil. Residential spending in 2023 is forecast at $850bil. If residential inflation for 2023 comes in low, say at 4%, then w/o inflation residential volume in 2023 would be $820bil. 2023 spending would be 6% lower than 2022, but volume is 5% higher. All due to the huge bite that 15% inflation took out of 2022 spending.


Recently, residential jobs have been holding relatively close to volume. In 2019 and 2022 they were even. That is not the case for the rest of construction.
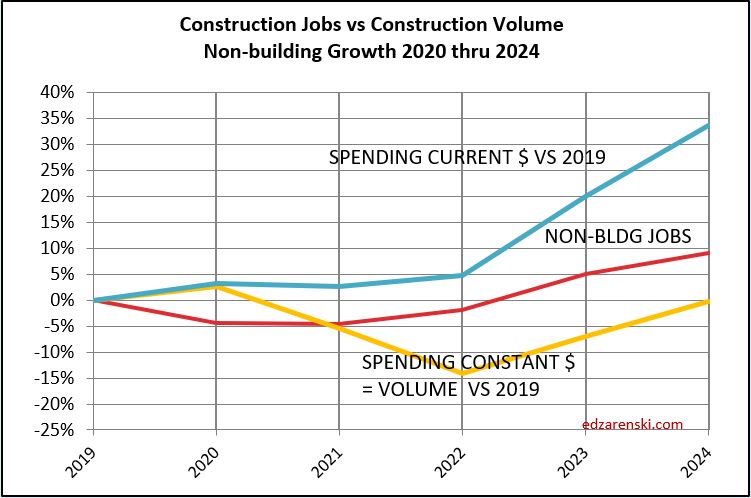
Nonresidential Buildings and Non-building Infrastructure constant $ volume since Jan. 2020 is down about 15%. Note how jobs dropped about 5%. This, not residential, is what is driving the deficit of volume shown in the Total All plot above. The major growth forecast in Nonres Bldgs and Non-bldg in 2023 and 2024 should help offset some of the difference.
Both Nonres Bldgs and Non-bldg have (or had) a very large number of jobs not supported by volume. This could be contractors holding on to their labor in a slack period so they have the labor when needed. The volume growth in these sectors would indicate a needed jobs growth that far exceeds the ability of the construction industry to add jobs. Those jobs could potentially absorb a lot of the anticipated growth in the spending forecast.


The current excess of jobs could absorb a lot of the volume growth. In 2020-2021, jobs increased about 2% but volume of work decreased 20% to 25%. These should move in tandem, not in opposition. The data counters the narrative of jobs shortages. In these two sectors, jobs had reached the highest ever excess jobs over volume. This does not address the alternative, skills shortages. But the data seems to indicate there could be a lot of bodies that could take on a large amount of growth in the volume of work.
From Q4’21 to Q1’23, Nonres Bldgs volume increased 25%, $100 billion. Nonres Bldgs jobs increased 4%, 140,000 jobs. A $100 billion add in one year is equivalent need to 500,000 jobs, and yet the workforce added only 140,000 jobs. The rest of the work was absorbed by the current workforce. I expect the volume growth over the next two years will increase much faster than jobs growth. That would be very good for the construction industry.

The volume growth in these sectors would indicate a needed jobs growth that far exceeds the ability of the construction industry to add jobs. The most jobs ever added in the last 50 years is just over 400,000. The average jobs added in the last 12 years is 225,000 (excluding the 230k lost in 2020) and the most in one year in the last 12 years is 320,000. It’s reasonable to assume the industry can add 300,000 to 400,000 jobs a year.
We either accept that we can’t add enough jobs to support increasing the workload by that much or we can’t add the anticipated workload in the forecast.
If we accept the forecast volume growth over the next two years, we simply could not add enough jobs in one or even two years to accommodate all the volume of work forecast. Both the Nonres Bldgs and Non-bldg plots above show a steep incline in the volume of work added, but not nearly as steep an incline in the number of jobs added. This can be correct only if a large percentage of the work added is absorbed by the current workforce. The alternative is that much work can’t be added that fast.
2023 volume growth is $250 billion, mostly nonresidential buildings. It takes 5000 jobs a year to put-in-place $1 billion. Forecasting that growth is put-in-place over 2 to 3 years, that’s about $100 billion/year. That’s 500,000 jobs for 2 to 3 years, which means there is too much work added in a year. My current forecast does not reduce for this, yet.

Ed,
Does this suggest that we should expect to see the non-building and non-residential construction costs to continue to increase until the described jobs and volume disparity evens out?
LikeLike
Not sure I would say “continue to increase” but costs can continue to remain high when activity is high. There are a lot of other factors affecting cost. At the very least, it could keep labor costs up.
LikeLike
Ed, with all due respect this was one of the more confusing articles you’ve written because you start out with the term “Real Construction Volume” but then that metric does not show up in any of the tables or graphs.
LikeLike
Thanks Joel. I tried to make it less confusing with some editing this morning.
LikeLike