Home » Posts tagged 'recession'
Tag Archives: recession

Pandemic #13 – Midyear Construction Outlook
See Also this update Construction Forecast Update 10-16-20
SEE ALSO Pandemic #14 – Impact on Construction Inflation
Midyear Construction Outlook 8-14-20 based on
- Actual Spending data includes revisions 2018-2019 issued 7-1-20
- Actual Jobs data includes BLS Jobs to July (12th) issued 8-7-20
- Forecast includes US Census June 2020 year-to-date spending 8-3-20
- Forecast includes Dodge construction starts Midyear Update 8-6-20
The first important thing to note is that the US Census, on 7-1-20, revised all spending data back several years. This is an annual occurrence. This analysis includes all revised data, which adds about $30 billion to 2018, $60 billion to 2019, half of all adding to residential, and revises 2020 data. Not everyone has yet updated to this recently revised data, so you may see differences when comparing forecast reports among several firms. If needed, refer to the percent.
Initial impact on spending from project delays/shutdowns
This compares the current construction spending data to a 2020 Forecast from April 1 before any Pandemic Impacts were recorded. It compares actual to what was expected Pre-Pandemic. The change in year-to-date (ytd) all occurred in 2nd quarter data. In fact, 1st quarter ytd growth was forecast at 7% and it came in at 9.5%. 2nd quarter growth was forecast at 6.8% and it came in at 1%.
Construction Spending 2020 year-to-date (ytd) thru June vs 2019
Actual ytd vs Pre-Pandemic Forecast ytd. Nearly all this change is due to projects delayed/shutdown.
- Nonres Bldgs down 2.4% ytd in 6mo vs pre-pandemic forecast
- NonBldg UP 3.0%
- Residential down 4.9%
- TOTAL down 1.9%
The measure of decline due to Pandemic delays and shutdowns is not the difference between Q1 and Q2 growth in ytd spending. Nor is the impact measured by the current difference in ytd performance vs 2019. It’s the difference between what was forecast for ytd growth pre-pandemic vs actual ytd growth.
For instance, Residential construction spending thru Q2, as reported in the US Census June construction spending release, is up ytd 7.8%. But pre-pandemic it was forecast to be up 12.7% ytd after 6 months. Hence, residential spending has been impacted by a 12.7% – 7.8% = 4.9% decline from original forecast thru June.
Future impact on spending from lost construction starts
Part one of the decline in construction spending was due to delays/shutdowns. Part two will be the impact of reduced construction starts. That has very little affect right now, but will play out over the next few years. But remember once again, the impact in 2021 is not measured by the difference between 2020 and 2021, its the difference between current forecast for 2020/2021 and the pre-pandemic forecast for 2020/2021.
Year-to-date, total construction starts are down 14%. Residential new starts are down 5%, nonresidential buildings down 22% and non-building infrastructure starts are down 14%.
Dodge updated their forecast to show 2020 construction starts for nonresidential buildings fall on average 20%, less in some markets, but -30% to -40% in a few. Only warehouses is up. Non-building starts fall on average 15%. Only Highway/Bridges is up. Residential starts may fall only 5%-10%.
How those lowered starts affect spending is spread out over cash flow curves for the next few years. This has a major impact on jobs later in 2020 and all of 2021 into 2022. For nonresidential buildings, the greatest impact to spending and jobs affected by a reduction of new starts in 2020 occurs from 2021 into 2022 when many of those lost starts would have been reaching peak spending.
Only about 20% of new starts gets spent in the year they started. 50% gets spent in the next year. The effect of new starts does not show up immediately. If new nonresidential buildings starts in 2020 are down 22%, on average, the affect that has on 2020 is reduced spending by -22% x 20% = – 4.4%. But the affect it has on 2021 is -22% x 50% = -11%.
Construction Spending FORECAST 2020 vs Pre-Pandemic Forecast
This change in forecast incorporates reduced new construction starts for 2020 but also includes the impact from delays and shutdowns.
- Nonres Bldgs down 5.4% for 2020 vs pre-pandemic forecast
- NonBldg down 0.3%
- Residential down 6.5%
- TOTAL down 4.5% vs pre-pandemic forecast
Construction Spending FORECAST 2021 vs Pre-Pandemic Forecast
Nearly all this change due to a reduction in new construction starts in 2020. Notice, it is nonresidential buildings that are impacted the most, down 10% from the pre-pandemic forecast.
- Nonres Bld down 9.9% for 2021 vs pre-pandemic forecast
- NonBldg down 6.4%
- Residential UP 5.8%
- TOTAL down 2.5% vs pre-pandemic forecast
Future impact on backlog from delays/cancellations and reduced starts
Starting Backlog is the Estimate-to-Complete (ETC) value of all projects under contract at the beginning of a period. Projects in starting backlog could have started last month or last year or several years ago. Many projects in backlog extend out several years in the schedule to support future spending, so backlog growth in not an indicator that tracks year over year with spending. Current backlog at the start of 2020 would still contribute some spending for the next 6 years until all the projects in backlog are completed.
The last time starting backlog decreased was 2011. Starting backlog will fall 10% in 2021 and 2% in 2022. Except for residential work, about 80% of annual spending comes from starting backlog.
Some of the projects delayed or canceled started before Jan. 2020. When one of those projects is delayed, the portion of the project delayed gets removed from 2020 backlog, but then gets added to future backlog. When one of those projects is canceled, the portion of the project not yet put-in-place gets removed from 2020 and future backlog. Not only does that reduced future backlog but also that retroactively reduces the backlog that was on record at the start of 2020. Therefore, 2020 backlog is reduced by delays and cancellations and future backlog is increased by delays, but reduced by cancellations and a loss of new construction starts.
The following is the difference between what was forecast for backlog pre-pandemic and currently projected backlog based on delays, cancellations and reduced starts.
Backlog projected for the start of 2020:
- Total Construction down 3.6% vs pre-pandemic forecast
- Nonresidential buildings down 8.3%
- Non-building infrastructure up 0.5%
- Residential backlog down 2.2%, new starts down 5.4%
Although two thirds of Residential spending comes from new starts within the year, 2020 backlog is down 2.2%. 2020 new starts are down 5.4%.
The biggest changes to 2020 backlog are Manufacturing, Commercial/Retail and Amusement/Recreation, all down 10% to 15%.
Backlog projected for the start of 2021:
- Total Construction down 9.8% vs pre-pandemic forecast
- Nonresidential buildings down 15.1%
- Non-building infrastructure down 9.4%
- Residential backlog up 3.6%, starts up 8.4%
For 2021, Power and Environmental Public Works are down 20% and 10% respectively, but Nonresidential Buildings shows most of the losses. Lodging -40%, Amusement -28%, Manufacturing -26%, and Office and Commercial both down about 15%.
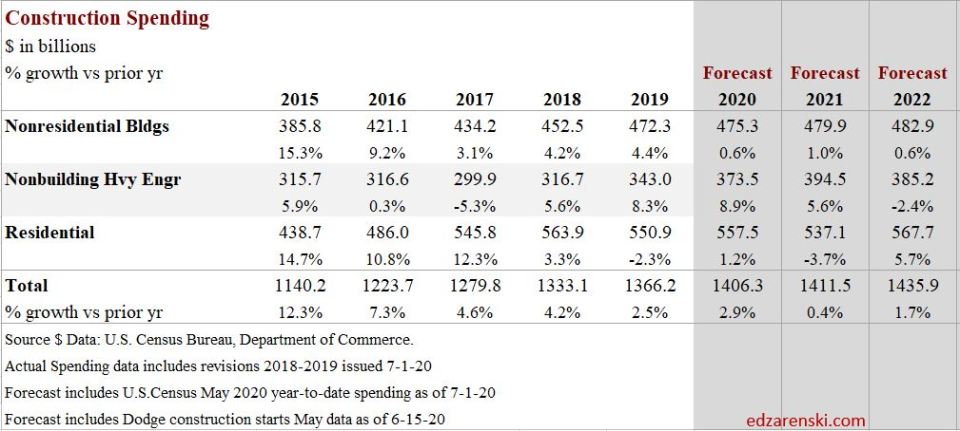
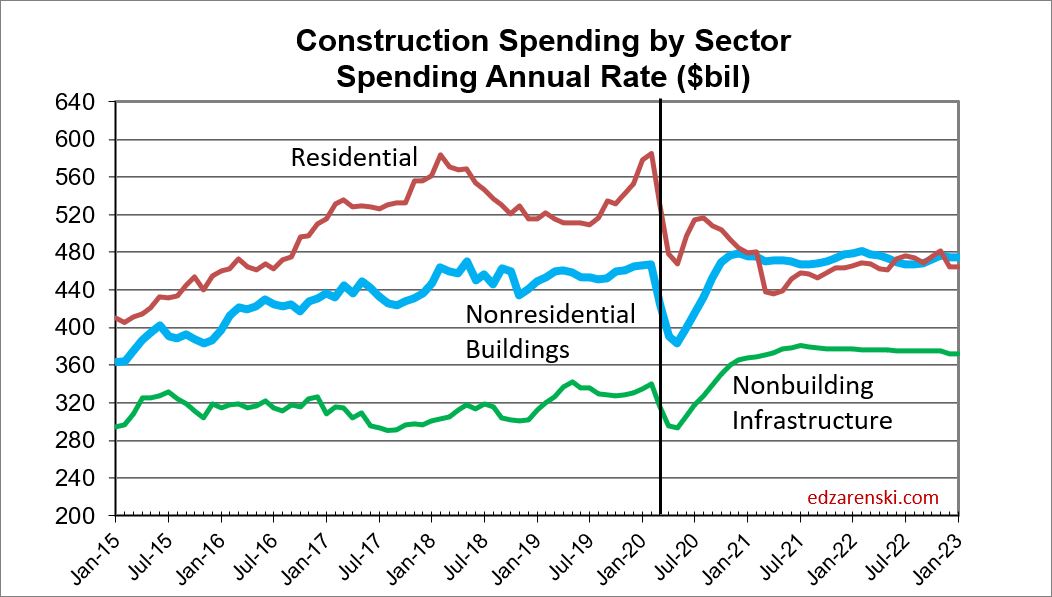
Spending Forecast 2020 – 2021
Now that we have highlighted the change in the forecast compared to the pre-pandemic forecast, let’s look at the current spending forecast for 2020 and 2021.

See Pandemic #11 – June Construction Spending Update for coverage of midyear spending year-to-date through June.

For 2020, the biggest declines are Manufacturing, Lodging and Amusement/Recreation, all down -8% to -10%. Commercial/Retail ends up +3.9% (this market is 60% Warehouse). Office and Educational are down -3% and -1%. Nonresidential buildings takes the brunt of declines in both 2020 and 2021.
In 2021, every nonresidential building market is down from 2020, some markets down 10% to 20%. Educational, Healthcare and Office are all down 3% to 5%. Non-building infrastructure Power market is down -11%, but Highway and Transportation are up +10% to 20%.

Almost every market has a weaker spending outlook in 2021 than in 2020, because of lower starts in 2020. Starts lead to spending, but on a curve, a good average for nonresidential buildings is 20:50:30 over three years. 20% of the total of all starts in 2020 gets spent in 2020 (yr1) and that represents also about 20% of all spending. 50% of the total value of 2020 starts gets spent in the following year, 2021. So, 50% of spending in 2021 is generated from 2020 starts. If starts are down 20% and 50% of spending comes from those starts, spending will be down 20% x 50% of the work.
Although starts are forecast down 15% to 20% in 2020 and UP 5% to 15% in 2021, the drop in starts in 2020 has the greatest impact on reducing spending in 2021. By June of 2021, spending is down 10% from Feb 2020 and volume is down 14%.
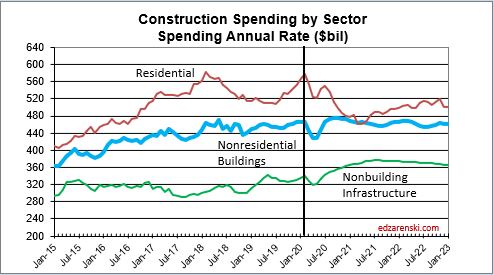
Before we can look at the effect on jobs, we need to adjust spending for inflation. The plot above “Spending by Sector” is current dollars. Here that plot is adjusted for inflation and is presented in constant $. Constant $ show volume. Notice residential remains in a narrow range after adjusting for inflation. No sector shows improvement in volume through Jan. 2023.
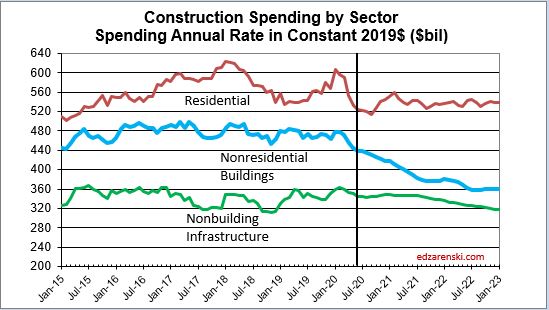
By far the greatest decline in volume is in the nonresidential buildings sector. Volume declines follow in line with spending declines. The greatest losses in 2020 are Amusement/Recreation, Lodging and Manufacturing. In 2021, every major nonresidential building market drops in volume.
Why 400,000 construction jobs are not coming back
Reduced starts in 2020 has a major impact on jobs later in 2020 and all of 2021 into 2022. For nonresidential buildings, the greatest impact to spending and jobs occurs from 2021 into 2022 when many of those lost starts would have been reaching peak spending.
Jobs data show construction added 20,000 more jobs in July. After losing almost 1,100,000 jobs in March and April (out of a prior total 7,600,000), we regained 450,000 jobs in May and 160,000 in June. That leaves construction down 440,000 jobs from the February high point.
Jobs are down 6% from Feb to July, but construction spending is down 7% through June and volume (spending adjusted for inflation) is down 9%.
Although we may get slight jobs growth in the next few months, there is little to no volume growth to support it. Spending is currently down 7% from the Feb high and volume is down 9%. More spending declines are minimal through Q1 2021. Due to the large declines in new construction starts, we will begin to see additional spending and volume declines by spring 2021. Most of the decline will be in nonresidential buildings.
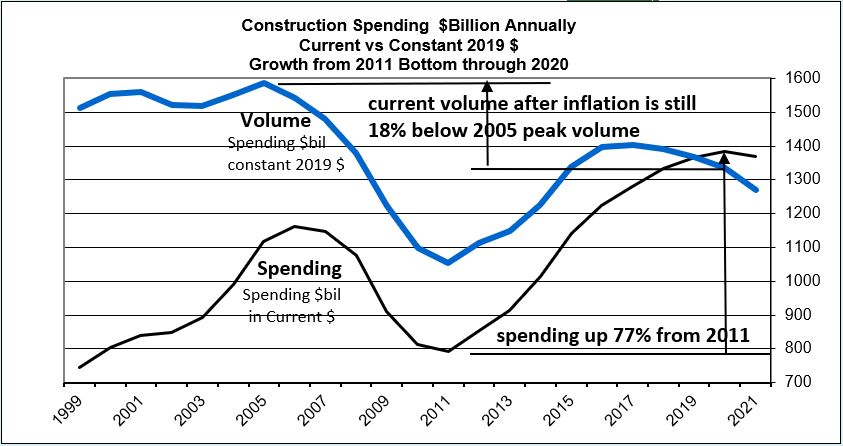
This annual plot back to 1999 shows construction spending vs construction volume. Volume is spending minus inflation. Notice, volume never recovered to peak 2005. Also notice, recent volume began to decline in 2018.
The long-term view of jobs vs volume shows an important point. With few exceptions jobs and volume grow equally. Setting a baseline to zero in 1990, there was a spread in 1992 that was nearly equalized by 1998. Jobs and volume growth remained near equal until 2004. Leading into 2006, spending increased by the most in 30 years. Jobs, which seem to lag slightly, grew 15% from 2004 thru 2006. But inflation posted the highest rate in 30 years. While jobs grew to meet spending growth, almost all the spending growth was inflation. By 2006, jobs growth exceeded construction volume by more than 15%.

As I said, with few exceptions, jobs and volume grow equally. If we modify history to reset the baseline to 2006 by increasing volume, the plot now shows that all years from 2006 to 2017 remained consistent in jobs growth vs volume growth. So, with exception of 1992 and 2004-2005, all years from 1990 to 2017 had consistent growth in jobs and volume.
Leading into 2017, spending once again reached a rate of near record growth, second only to 2004-2005. Again, jobs, which seem to lag slightly, grew to meet spending growth. But inflation posted the highest rate since 2006. Once again, jobs grew rapidly, but almost all the spending growth was inflation. By 2019, for the second time, jobs growth exceeded construction volume by almost 15%.

Jobs are supported by growth in construction volume, spending minus inflation. We will not see construction volume return to Feb 2020 level at any time in the next three years. This time next year, volume will be 5% lower than today, 14% below the Feb 2020 level.
We are currently down 440,000 construction jobs from the Feb high. We may regain 40,000 to 50,000 more jobs before the end of the year. But the declining work volume due to a reduction in new starts in 2020 is indicating by this time next year, not only is there no volume to regain 400,000 lost jobs, but we may lose another 200,000 jobs and be down 600,000 jobs below the Feb 2020 high.
The following plot is the same jobs and volume data as above, only plotted monthly rather than annually. Much of the fear decline of jobs in April has been corrected, but jobs are still down 440,000 from the February high. And yet, the plot shows jobs in excess of construction volume by about 12%.
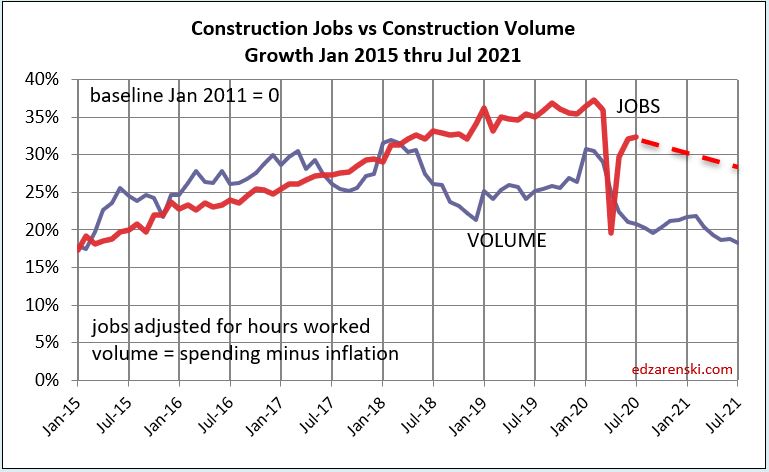
Volume is set to decline at least for the next two years. There will be no volume growth to support jobs growth and long-term jobs growth already exceeds volume growth by 12%. This is not an environment that supports jobs growth.

Pandemic Impact #9 – Spending Revisions & Construction Jobs Reset
updated 7-2-20 to include May spending and June jobs report
6-26-20 April construction spending dropped only 3%, but jobs+hours worked dropped 16%. Even though May showed a partial jobs rebound, jobs during this period are still down much more than spending. If this data is accurate, we dropped about half a million jobs more than then the decline in spending would indicate. If so, it’s time to wake up and accept there has been no labor shortage, but rather there has been a huge excess of nonproductive labor.
We’ve seen in the past that jobs can grow in excess of volume growth, but we’ve never seen a period where jobs show a massive decline without a like decline in spending. If it is true that jobs declined without an equal drop in spending activity, then those jobs were nonproductive.
Is the industry about to reset jobs vs work volume? Or, should we expect revisions to the reported data? With the July 1 release of spending data, all monthly (not seasonally adjusted) spending gets revised back to Jan 2018. We’ll see if Mar-Apr gets revised to show larger spending losses.
This post will be expanded after the July 1 construction spending and jobs releases.
Data on recent Construction Starts for May from June 15 release
Dodge Construction Starts average for Apr+May 2020 compared to Avg Jan-Feb-Mar 2020 — Nonresidential Bldgs -34%, Nonbldg Infra -4%, Residential -27%.
Dodge Construction Starts average for Apr+May 2020 compared to Avg Apr+May 2019 Nonresidential Bldgs -18%, Nonbldg Infra -15%, Residential -3%.
So, while Nonresidential buildings starts were down 34% in Apr+May compared to Q1 2020, that’s down 18% compared to the same months 2019. Residential Apr+May starts are down 27% compared to the avg in Q1 2020, but that’s down only 3% compared to Apr+May 2019.
What impact does that have on the year? if Nonres Bldgs starts are down 34% for 2 months, that reduces starts by 6% (34 x 2/12 = 6) for the year (from the prior trend). If Residential starts are down 27% for 2 months, that reduces starts by 4.5% (27 x 2/12 = 4.5) for the year. The full impact on new construction starts will not be known for many months as owner’s make decisions whether or not to move ahead with new capital investment.
7-1-20 The Census Construction Spending report issued today revises spending back several years. 2015, 2016 and 2017 were all revised up 1% to 1.5%. 2018 was revised up 2% and 2019 up 4.5%.
The 3 month decline in spending for Mar-Apr-May 2020 is now reported at only 6%. There is still some disparity in the spending data (vs jobs) in 2020 that is subject to several more revisions and may not get revised for at least a year.
7-2-20 Jobs report for June covers the period May18-Jun14. Construction spending released 7-1 covers May. We now have 3 months, Mar-Apr-May of spending and 3 months of jobs for the periods Mar16-Apr12, Apr13-May17 and May18-Jun14. We now begin to get a picture of jobs losses and shutdowns.
Construction Jobs vs Spending Mar-Apr-May vs Feb
- The 3-month average decline in Volume was -6%.
- The 3-month average decline in Jobs+Hours was -11%.

Construction Projects that shut down in Mar-Apr-May did not post lost revenues as deep as predicted. Spending was down only -4% from February to April. In May the decline from February reached -6%. Compared to February, Residential spending for May declined -9.5%, Nonresidential Buildings -5% and Non-building Infrastructure declined only -2%.
The data for Mar-Apr-May 2020 shows that the spending drop from shut down delays was far less than anticipated. More than 90% of all work continued unabated through April and May. The result is fewer reductions thereby increasing spending in 2020 and less delayed work pushed out into 2021, lowering 2021 spending slightly. This shifts the balance of spending and now shows a small spending growth in 2020 and only a slight increase in 2021.
Non-building Infrastructure spending is up 8% year-to-date through May. Nonresidential Buildings is level year-to-date. Residential spending ytd is up 9%.
On April 1, the pre-pandemic forecast for 2020 spending was up 6% over 2019. The revised forecast is now up only 2.9%, based on the spending data for Mar-Apr-May released on 7-1-20. The biggest change contributing to the decrease is in residential work. Non-building Infrastructure work, particularly Power and Highway, continues to support spending the next two years.
These markets remained at level spending or posted gains in spending in April and May: Public Safety, Amusement/Recreation, Transportation, Communication, Highway/Street, Public Works. The largest declines in spending were in Residential, Lodging, Healthcare, Power and Manufacturing.
The result of lesser impact from fewer work shut downs in Apr-May is a better overall forecast for 2020 and a reduction of delayed work pushed into 2021. However, the forecast for 2020 may possibly get a bit worse with expected revisions. I was predicting shut downs of 10% to 15% and in some markets 25% and that did not show up in the Census spending report. But the uncertainty of what the fall brings still weighs heavy on any outlook. Still in question is whether some states may yet need to invoke temporary shut downs that were originally expected to occur in Apr-May.
After three months, there are still approximately 400,000 jobs lost without an equivalent decline in spending. Even with some future downward revisions to spending, my thoughts are we could expect many of these jobs lost for good. But this most recent data produced at least some of the correction I expected last month. The plot below of the number of jobs to put-in-place $1 billion of volume spiked downward in April by an unrealistic amount. With the most recent May-June data, spending dropped a bit more and jobs increased. This corrected the downward spike almost back up to where it was. Spending is still subject to several revisions for a year. Don’t be surprised to see this plot move slightly higher in the near future. A higher value on this plot represents lower productivity. I would expect current conditions to result in lower productivity and eventually that should show up on this plot.

My forecast updated to 7-2-20 shows spending increasing through the remainder of 2020 with almost all of the change due to restarting work that was shut down. But then as we turn into 2021, spending begins to fall slightly again through mid-year, with the emphasis on change due to loss of spending from a decrease in new starts in 2020. Still unknown, with no way to tell from the data, is how many of the projects that shut down will not restart? Also unknown is the impact of cancellations of starts for new capital investment.
Residential work posted the largest drop in spending so far, down almost 10% in three months. But even with that steep drop, residential spending is still up 9% year-to-date compared to 2019. Residential and Nonresidential Buildings posted large reductions in new starts in April and May. That will have an impact on 2021 spending. Only Non-building infrastructure is forecast to post sizable spending gains in 2020 and 2021.


Pandemic Impact #8 – Construction Outlook 6-1 April data
For up-to-date Outlook
See Pandemic #13 – Midyear Construction Outlook published 8-14-20
See Pandemic #12 – Jobs & Starts Updated Aug 8 and
Pandemic #11 – June data Construction Spending Update Aug 3 and
Pandemic #10 – June New Construction Starts July 30
Analysis of a Recession Scenario 2020-2022
based on 6-1-2020 data
This analysis relies on the first available hard data reports to forecast the impact of a construction recession scenario caused by the current Covid-19 pandemic. This scenario does not assume a catastrophic failure of the U.S. economy, but does assume a large decline in construction activity in 2020 and 2021. Data always gets revised in the following months.
This analysis generates spending cash flows from current and assumed reduced new construction starts to then determine how new starts and spending may affect future construction activity.
6-1-20 What We Know Today
The revised construction spending report for March, released June 1st, showed no decline in spending from February. Census revised March construction spending from the initial report of up 1% to, still remarkably, level with February. https://census.gov/construction/c30/pdf/release.pdf
This was the estimated growth before the pandemic. Shutdowns began March 15th. This report seems to indicate construction was totally unaffected in March! This is hard to grasp. Just the shutdowns in Boston and San Francisco starting Mar 15. affected 300,000 jobs and would calculate to have erased over $2 billion in work from March total spending. By one estimate, we had already lost 300,000 to 400,000 construction jobs by Mar.31st. How spending could have increased is baffling.
The first hard jobs data reflecting Coronavirus impacts on the construction industry was the jobs report released in the first week in May which covers jobs from mid-March through mid-Apr. From March 15th to April 12th, construction lost 975,000 jobs, 13% of the workforce. Construction unemployment, which was below 5%, as low as 3.2%, is now at 16.6%. https://bls.gov/web/empsit/ceseeb1a.htm . I expect to see downward revisions to March spending. In addition to a 13% drop in the number of jobs, hours worked also dropped 3%, so the total worker manpower and hours worked output dropped 16%.
Ten states account for 80% of the 975,000 construction jobs lost between March 15th and April 12th. CA, FL, MA, MI, NJ, NY, OH, PA, TX & WA. Eight of those states are in top ten states for total number of construction jobs, MA and WA are not. https://www.agc.org/news/2020/05/22/construction-employment-shrinks-49-states-and-dc-april-new-association-survey-finds?
The next jobs report due out June 5th covers the period from April 13th through May 17th. Expect more downward movement in the jobs numbers. I expect most construction jobs were lost early and are included in the April report, so next report June 5th we may see only 400,000 more construction jobs losses for the period April 13 through May 17. (This report will be edited to reflect the June 5th jobs data.)
The loss of 975,000 jobs in a single month (if all jobs were lost for a full 30 days) at a rate of 60,000 jobs needed to put-in-place $1 billion in construction in one month, equates to a loss of $16 billion in spending between March 15th to April 12th.
In one of the most baffling reports I’ve seen, Census posted April Construction Spending down only 3%. It is beyond explanation that construction spending for March was flat and April declined only 3% from March, while we’ve lost 16% of worker output.

The change from March to April Construction Spending versus Construction Jobs varies by the most in 30 years. This is highly suspect! Jobs (and hours) are down 16% but spending is down only 3%, for a variance of 13%. The largest variances on record back to Jan 1991, most of which occurred in 2005-2006, are: in 360 months, jobs and spending growth varied by >4% only 10 times, >5% only twice. The 20 yr average 0.1%.
Variances like what the data show for this month have never occurred. A more likely explanation is there is an anomaly in the data. Either construction did not lose 975,000 jobs in a month or spending in April dropped a lot more than 3%. I suspect the later.
6-8-20 Another way of looking at the jobs data is this simple metric. The total number of construction jobs divided by the amount in $billions of work put-in-place each month = Jobs/$billion PIP. This value sometimes spikes or dips by 3% or 4%, but usually changes month to month by less than 1%. You can easily see the April construction jobs/spending data changed by what normally would take several years. The change in April spending data does not agree with the change in jobs data. It’s one thing to see a spike like this when jobs are increasing in excess of work put-in-place. But it is much more suspect to see jobs decline without a decline in work put-in-place. Who’s putting the work in place?

Here’s what that April variance would mean. If construction jobs+hours drop by 16% but spending drops by only 3%, then productivity as measured by amount of work put in place per job increased by 13%, IN A MONTH, DURING A PANDEMIC.
If there is essentially no change in productivity, but due to restrictions and higher overhead, costs go up, then you must accept construction inflation just increased by 13% in one month. But there is no data yet showing unusual labor or material cost increases.
Or, if some portion of this discrepancy is due to a change in productivity and some part due to rapid inflation, the 13% variance is somehow split between these two issues.
6-5-20 The May Construction Jobs report issued today for the period April 13 through May 17 shows an increase of 464,000 jobs (and hours worked). I missed that estimate. So did everybody else. Jobs and hours worked output is now down net 13% for March and April. Spending is down only 3%. I still expect April spending to be revised down.
6-5-20 The May jobs data today is indicating an initial month (April) of stop work down 975,000 jobs (16%) is now down only 10%, net 600,000 jobs as of mid-May. That’s equates to a two-month average of jobs and hours worked down by 13%. My forecast was based on about 25% of work stopped for two months. If jobs is a better indication, the lesser extent of work stopped means the adjusted forecast will post higher spending in 2020 and will move less spending into 2021. The next important data date is July 1, when the May construction spending is released. With that May report every year, Census revises all previous months data back 5 years. We’ll see if April data gets revised down.
6-9-20 “In total, the construction sector recorded almost 1.3 million layoffs during March and April.” NAHB https://wordpress.com/read/blogs/68887359/posts/28427
6-5-20 There is a scenario in which jobs decline with little to no reduction in volume. But, it accepts that there was a very large number of nonproductive jobs in the workforce. I’d been writing about the increasing disparity for the last few years between volume growth and jobs growth Expect Construction Jobs Growth to Slow in 2020. Since 2017 jobs have been increasing but volume of work has been decreasing or level. It’s possible a large portion of the jobs losses in April are resetting this balance with little to no impact on volume output. These would be jobs that would probably not come back.
6-5-20 For Mar-Apr, 975,000 jobs were lost for a single month (if all jobs were lost for a full 30 days). For Apr-May, we regained 464,000 jobs. Net jobs loss for two months is about 600,000 jobs. April spending was down only 3% or $40 billion seasonally adjusted annual rate (SAAR) . At a rate of 60,000 jobs needed to put-in-place $1 billion in construction in one month, this equates to a loss of $10 billion in not seasonally adjusted (NSA) spending PER MONTH for both April and May. That would be a decline in the SAAR of spending of $120 billion. March posted no decline. April posted a $40 billion decline and we will get May spending on July 1st. The spending data remains suspect.
The pre-pandemic construction seasonally adjusted annual rate (SAAR) spending forecast was for a rate of $1,395 billion from March through July. Assuming no unusual changes in jobs, productivity or inflation, the spending can be calculated from the number of jobs available to perform work. For pandemic impact based on job losses, we should see March SAAR spending at $1,350 billion. April construction spending should drop to under $1,200 billion from a high of $1,386 billion in February. I expect to see March spending get revised downward. I expect April spending to be revised down 6% to 10%. For these reasons, my forecast is not using the reported April spending data.
Pandemic Impact on Construction
This was the baseline forecast pre-pandemic. It shows considerable strength in Nonresidential Buildings and Non-building Infrastructure starts and spending. There is weakness in residential.
This plot shows actual spending through January 2020 and forecast spending for 2020 through 2022 based on the predicted cash flow from existing starts and projected starts pre-pandemic.
PRE-RECESSION SCENARIO FORECAST SPENDING

Backlog leading into 2020 was up 30% in the last 4 years, at all-time high. Although spending was forecast up only 4%/yr. the next two years, spending is at an all-time high. 80% of all nonresidential spending in any given year is from backlog. If new starts drop by 10%, that has only a 1.5% to 2% impact on total spending in the first year. The following year spending would be down 4% to 5%. Residential spending is far more dependent on new starts than backlog. Only about 30% of residential spending comes from backlog and 70% from new starts. If residential new starts drop 10% that impacts total spending by 7% in that year.
Residential construction starts peaked in 2018. Starts in 2019 are level yoy, but have been flat or in moderate decline since mid-2018. Spending was forecast up 5% in 2020 but down 1% in 2021.
Nonresidential Buildings starting backlog increased 10%/year for the 4 years 2017-2020. Starts have moved sideways or in slight decline since mid-2018. 2019 starts are down 9% from 2018. Spending was forecast up 3% in 2020 and 2021.
Infrastructure starting backlog, by far the most robust, has increased 15%/year for the 3 years 2018-2020. Spending was forecast up 6% in 2020 and up 8% in 2021.
Recession Scenario
Regardless what may lead to a construction recession, in this case a global pandemic, it is the current high amount of work in backlog that will work hard to mute its effect.
When a recession occurs, new construction starts would be substantially reduced. Although some projects will be canceled or delayed mid-schedule, most projects already in construction would move on to completion.
Construction projects will most likely experience delays. Potential product shortages, delivery delays and shutdowns will drive up costs and extend project schedules.
Projects in planning may be canceled due to drop in demand, decline in capital or slowdown in economy. Retail stores may cancel expansion, educational facilities may delay starting new construction, transportation facilities may postpone later phases of long planned growth.
This recession scenario does not assume a catastrophic failure of the economy.
This pandemic recession forecast is based on the following:
- April spending is forecast and not carried as reported due to reasons cited.
- New Construction Starts in 2020 canceled, Residential -15%, Nonresidential Buildings -8%, Non-building Infrastructure -11%, Total Construction starts canceled -11%.
- Work in backlog that has been delayed, minimum 2 month delay, restart build up over a period of 8 months; Residential -30%, Nonresidential Buildings -28%, Non-building Infrastructure -22%, Total Construction delays -25%.
- Work in backlog that has been canceled, Residential -3%, Nonresidential Buildings -3.4%, Non-building Infrastructure -2.2%, Total Construction backlog canceled -2.8%.
This plot shows the resulting change in spending. Only the estimated spending to the right of the dateline changes.
RECESSION SCENARIO FORECAST SPENDING

6-20-20 Data on most recent Construction Starts
Dodge Construction Starts average for Apr+May 2020 compared to Avg Jan-Feb-Mar 2020 Nonresidential Bldgs 66%, Nonbldg Infra 96%, Residential 73%.
Dodge Construction Starts average for Apr+May 2020 compared to Avg Apr+May 2019 Nonresidential Bldgs 82%, Nonbldg Infra 85%, Residential 97%.
So, while Nonresidential buildings starts were down 34% in Apr+May compared to Q1 2020, that’s down 18% compared to the same months 2019. Residential Apr+May starts are down 27% compared to the avg in Q1 2020, but that’s down only 3% compared to Apr+May 2019.
Nonbuilding Infrastructure starts in Apr+May are down only 4% from Q1 average, but Q1 is already 15% lower than last year.
What impact does that have on the year? if Nonres Bldgs starts are down 34% for 2 months, that reduces starts by 6% (34 x 2/12) for the year (from the prior trend). if Residential starts are down 27% for 2 months, that reduces starts 4.5% (27 x 2/12) for the year. Most of the impact in nonresidential occurs from 12 to 24 months out. Most of the residential impact occurs in the first 12 months.
After the resumption of work that had been halted, which for various reasons cited will take several months, and which is not all expected to return to a full level of pre-pandemic spending, a pull-back in new construction starts will hold spending nearly flat from Q3 2020 through Q2 2021. During that time nonresidential work will reach a post-pandemic peak but residential work will hit a post-pandemic low. Non-building Infrastructure work is not affected nearly as much and still shows spending growth leading into 2022-2023.
Construction Spending Forecast 2020 – Residential -2%, Nonresidential Buildings -4%, Non-building Infrastructure <-1%, Total Construction Spending 2020 -2.3%.
Residential construction spending would drop 11% from $566 billion to $506 billion in 2020 and then drop 18% from $550 billion to $453 billion in 2021. Residential is far more dependent on new starts within the year for spending than on backlog.
Nonresidential Buildings spending drops 8% in 2020 from $469 billion to $434 billion and then drops 2% from $475 billion to $468 billion in 2021.
Non-building Infrastructure spending drops 5% in 2020 from $348 billion to $330 billion and then drops <1% from $378 billion to $376 billion in 2021.
By 2022, nonresidential buildings and infrastructure are back within 1% to 2% of baseline pre-pandemic spending. However, residential spending is set back $100 billion, back to the level of 2016.
About 300,000 of the jobs lost do not return. While about 75% of the initial jobs lost have returned by the end of 2020, we then slowly lose jobs for the next two years.

Total all spending would drop from the current 2020 forecast of $1.380 trillion to $1.270 trillion. In 2021 and 2022, instead of baseline spending of $1.400 trillion, spending would drop to near $1.300 trillion, back to the level of 2018. The losses in the Great Recession, a total drop of almost $400 billion, set construction spending growth back 12 years.
The difference with shutdown vs a reduction in new starts is that work shut down is delayed. It will reduce total spending in that month in 2020 but will simply shift all remaining months and the end of the projects, which could occur in 2020, 2021 or later. If 50% of all U.S. construction shut down for two months, it would delay $100 billion worth of work, most of it from 2020 into 2021.
7-3-20 updated spending data on 7-1 Census released spending data for May and revised all monthly data back two years. 2018 and 2019 spending was revised up by 2% and 4%. But more important, the data for Mar-Apr-May 2020 shows that shut down delays were far less than anticipated. More than 90% of all work continued unabated through April and may. The result is fewer reductions in spending in 2020 and less delayed work pushed out into 2021. This shifts the balance of work to now show slight growth in 2020 and only a minor increase in 2021. SEE PANDEMIC #9
Inflation
When we see spending increasing at less than the rate of inflation, the real work volume is declining. With typical construction inflation between 3% and 5% annually, a spending drop of -2.8% in 2020 may reflect a work volume decline of 6% to 8%. Spending growth of 2% when inflation is 3% is really a decline in volume of work by 1%. The extent of volume declines would impact the jobs situation.
Historically jobs declines of the same magnitude do not follow immediately after volume of work declines, therefore after the initial delayed job losses return to work, we would not expect to see much reduction in workforce in 2020.
What this will do to the construction inflation rate is hard to predict. Typically, when work volume decreases, the bidding environment gets more competitive and prices go down. However, if materials shortages develop, that would cause prices to increase.
There have been reports that scrap steel shortages may result in a steel cost increase and numerous imported products are not available or in short supply. Some firms that manufacture goods used in construction were closed temporarily, so their production was disrupted.
Steel Statistics and Steel Cost Increase Affect on Construction? 2/3rds of all steel manufactured in the U.S. is EAF steel made from scrap steel. Almost 100% of steel used in construction is EAF steel. The Pandemic is causing scrap steel shortages.
U.S. Steel production through May is down 13% compared to the same period 2019. Steel imports are down 20%. The U.S. imports about 30% of all the steel it uses. 40% of all steel used in the U.S. is used for construction. So through May, total steel available in the U.S. is 13% + (20% x 30%) = 19% less than 2019.
Add to these issues the fact that many projects under construction may have been halted for a period of time and many more may have experienced disruption. The delays may add several weeks to perhaps a month or two to the overall schedule and management cost goes up. I think in this case the materials availability issues and schedule delays will outweigh any decline in work available for bid.
Only twice in 50 years have we experienced construction DEflation, 2009 and 2010. That was at a time when business volume was down 33% and jobs were down 30%. I expect inflation to range between 4% and 5% for 2020 and 2021, lower for residential work.
You can visit Ed Zarenski’s website,
Construction Analytics – Economics Behind the Headlines

Pandemic Impact #7 – Forecasts Based on Little Hard Data
5-8-20 The jobs report today shows construction lost 975,000 jobs last month.
AGC forecasts “virtually no new private starts except pandemic-related and emergency repair work.” This is probably the most pessimistic of forecasts but let’s look closer. Private construction comprises 75% of all construction work, but residential is 40% out of the 75%. In some cases residential work was allowed to continue, perhaps leading to a continuation of residential starts. Healthcare, Office, Warehouse (in Commercial/Retail), Data Center (in Office), Transportation and Manufacturing (Industrial) all have a large share of private work and all may include some critical projects for which starts may proceed. So, a large portion of new private starts might proceed.
Dodge forecasts new residential construction starts in 2020 will end down -12%, commercial (90% private) down -16%, institutional (50% private) down -7%, Manufacturing/Industrial (100% private) down 22% and Non-building (40% private) down -16%.
ConstructConnect forecast for 2020 construction starts; Residential -29%, Nonresidential Buildings -32%, Non-building Infrastructure -17%. Total Construction starts for 2020 down 27%.
AIA Consensus of eight construction firms 2020 construction spending forecast for nonresidential buildings : Commercial -14%, Institutional -7%, Total Nonresidential Buildings -11%.
CBRE Research reported 70% of total under-construction industrial space nationally remained active. Most of these projects were deemed essential.
Here’s a sampling of Dodge construction starts through March for ten areas: Houston-Baytown-Sugarland, Phoenix-Mesa-Scottsdale, Ohio, Atlanta-Sandy Springs-Marietta, Boston-Cambridge-Quincy, California, Florida, New York-Northern New Jersey-Long Island, Pennsylvania, Seattle-Tacoma-Bellevue. These ten areas represent about one third of all U.S. construction starts. Compared to the same period 2019; Total construction starts are down 3.5%; Nonresidential Buildings down 2.5%; Non-building down 3.5%. Residential starts are up 10%. Only Seattle posted a decline in residential starts.
From March 15th to April 12th, construction lost 975,000 jobs, 13% of the workforce. Not shown in the jobs plot below is that hours worked dropped 3%, so the total work output dropped 16%. Construction Unemployment, which was recently below 5%, as low as 3.2% in summer 2019, is now at 16.6%. The next jobs report covers the period from April 13th through May 17th. Expect more downward movement in the jobs numbers.
The U. S. Census March construction spending forecast was UP. It should not be up. I’ve stated this could potentially be due to insufficient real data input and more dependent on typical spending curves to fill in the blanks due to lack of response with real hard data input. I expect downward spending revisions to the March data. Here’s two examples to support my expectations:
- In any given month about 15% of Residential construction spending comes from new starts that month. March Not Seasonally Adjusted (NSA) spending is historically 15% higher than Feb. But March backlog (without any project delays) was level, new starts in $ increased only 8% and new starts # of units fell 22%, yet March reported residential spending still increased 15%. With a level backlog (which assumes no shut downs) and a new starts below par, residential spending for March should not have increased by the normal historical amount.
- Total NSA construction spending in March increased 9.6% from Feb, historically it would increase 10.5%, so that seems normal. However, in the last two weeks of March it is estimated workforce declined by 300,000+, 4%. It is unlikely construction recorded a 4% boost in productivity in Mar.

There still is little hard data to go on, but based on what I’ve gathered to date, here is my Construction Analytics latest forecast.
Work in backlog that has been delayed, minimum 2 month delay, restart build up over a period of 8 months; Residential -30%, Nonresidential Buildings -28%, Non-building Infrastructure -22%, Total Construction delays -25%.
Work in backlog that has been canceled, Residential -3%, Nonresidential Buildings -3.4%, Non-building Infrastructure -2.2%, Total Construction backlog canceled -2.8%.
New Construction Starts in 2020 canceled, Residential -15%, Nonresidential Buildings -8%, Non-building Infrastructure -11%, Total Construction starts canceled -11%.
Construction Spending Forecast 2020 – Residential -2%, Nonresidential Buildings -4%, Non-building Infrastructure <-1%, Total Construction Spending 2020 -2.3%.
The loss of 975,000 jobs in a single month (if all jobs were lost for a full 30 days), at a rate of 60,000 jobs needed to put-in-place $1 billion in construction in one month (5000 jobs per $1bil pip/yr), equates to a loss of $16 billion in spending between March 15th to April 12th. Normally in this period spending would be $100 to $105 billion. We won’t see the hard spending data for this period until June 1st with first revision July 1st. A $16 billion drop would equate to a 1.25% decline in annual construction spending.
A recent AGC survey of contractors indicates:
- 50% of respondents said an owner halted current work
- 67% are experiencing project delays/disruptions
- 49% said suppliers had notified them deliveries would be delayed or canceled
- 28% reported that an owner canceled an upcoming project
- 35% laid of workers
Just keep in mind, this is a survey of companies responding they have experienced these issues. It IS NOT an indication that 50% or 67% of all construction projects are halted or delayed. If a contractor has 10 ongoing projects and experiences a delay on three of them, or even one of them, he would have answered affirmative in the above survey. As an example, 35% of respondents reported they laid off workers and today’s jobs report shows the workforce dropped by 13%.
ConstructConnect has compiled a list, by state, of construction projects that have been delayed or canceled. From this list you can get an idea of the number of projects that have been delayed or canceled, but you cannot determine the amount or $ value of work that has been delayed or canceled. To get that level of detail, you would need to know the schedule for each job, the start date/end date and the amount of work already put-in-place.
There are no standard means of capturing the duration of delays or the $ value of delays or cancellations from backlog. We may never know the total value of work delayed/work canceled. This is what makes current forecasting so difficult.
See also these articles for all the analysis to date on the Impact of the Pandemic.
Pandemic Impact on Construction – Recession in 2020?
Pandemic Impact on Construction – Part 2
Pandemic Impacts – Part 3 – Jobs Lost, Inflationary Cost
Pandemic Impact #4 – Construction Jobs Recovery
Pandemic Impact #6 – The Lost Month
5-2-20
Expanding on one of the four recession impacts outlined previously, #4 New Starts – future capital spending plans canceled.
What is the impact on future construction spending if new construction starts stopped for a month?
To analyze this scenario, several assumptions must be made. The assumptions are the variables, and as you will see, the variables change with the market and the severity of the shutdown. It will be easy to see the impact of any other alternative once one scenario is modeled.
Assumptions:
1: An entire month of new starts is stopped. Later it can be determined what happens if only 50% stopped or only 25% stopped.
2: The average duration of jobs in this category is 25 months. Duration is different for each market and this will show the impact duration has on the outcome. Later it can be determined what happens if duration is 20 months or 33 months.
3: A straight line spending curve is assumed. That is, for a duration of 25 months 4% of the construction would be put-in-place each month. No, that is not how spending occurs, it actually follows a typical bell curve, but this allows us to visualize the impact. If duration were set at 20 months, 5% of spending would be p-i-p each month.
4: New Starts have been level indicating a steady stream of new work at the current level. New starts do vary up and down slightly each month, but prior to the pandemic impact the broad outlook was for not big changes from 2019 through 2021.
If an entire month of new starts at a level pace were to disappear, the volume that month would have added to each future month of spending disappears. For projects that have a 25 month duration, using a straight line spending curve, new starts in every month make up 4% of the spending in all future months until they are completed. The total spending in any given month is dependent on the spending contribution from the previous 25 months of projects started. Each month, a project that stated 25 months ago is completed, but a new project that started this month is added.
In this scenario, future spending is reduced by 4% per month for the next 25 months.
Now we can see what happens if only 50% of new starts disappear. If duration is kept at 25 months but only 50% of starts disappear for a month, then future spending will be reduced by only 2% per month for the next 25 months.
What happens if 100% of new starts for one month disappear but the type of project has an average duration of 33 months?
Projects with a 33 month duration contribute 3% of the monthly spending for the next 33 months. In this scenario, future spending will be reduced by 3% per month for the next 33 months. If duration is kept at 33 months but only 50% of starts disappear for a month, then future spending will be reduced by only 1.5% per month for the next 33 months. Long duration projects have a smaller monthly impact, but the impact lasts for a longer period of time.
Short duration projects such as housing have a more severe monthly impact, but the impact lasts for a shorter total duration. Projects with a 10 month duration contribute 10% of the monthly spending for the next 10 months. If 100% of new residential starts stopped for one month, future spending will be reduced by 10% per month for the next 10 months. If duration is kept at 10 months but only 50% of starts disappear for a month, then future spending will be reduced by only 5% per month for the next 10 months.
What happens if new starts shut down for two months? Double all the results above.
See also these articles for all the analysis to date on the Impact of the Pandemic.
Pandemic Impact on Construction – Recession in 2020?
Pandemic Impact on Construction – Part 2
Pandemic Impacts – Part 3 – Jobs Lost, Inflationary Cost
Pandemic Impact #4 – Construction Jobs Recovery
Pandemic Impact #5 – Restarting Construction

Pandemic Impact #5 – Restarting Construction
4-18-20
Construction does not come roaring back in Q3 or Q4 2020. The seasonally adjusted annual rate of total construction spending will not return to the Jan-Feb 2020 level until at least 2023.

I’ve outlined in previous “Impact” articles what we might expect for cash flow and backlog through 2020 and into 2021. After the resumption of work that had been halted, which for various reasons cited will take several months, and which is not all expected to return to a full level of pre-pandemic spending, a pull-back in new construction starts will hold spending nearly flat from Q3 2020 through Q2 2021. During that time nonresidential work will reach a post-pandemic peak but residential work will hit a post-pandemic low. Non-building Infrastructure work is not affected nearly as much and still shows spending growth leading into 2022-2023.

The U.S. steel industry is in the most severe downturn since 2008, as steelmakers cut back production to match a sharp collapse in demand and shed workers. Capacity Utilization dropped from 82% to 56%. Steel manufacturing output has fallen by a third and industry executives and analysts expect production to drop further. Approximately 40% of all steel is used in the construction industry. Until production ramps back up to normal levels expect shortages or delays in delivery of steel products.
Firms currently engaged in NYC public design work have been directed to immediately halt all services. Why? The city is anticipating a $7.4 billion drop in tax revenue for this fiscal year and next. Tax revenues will be down across the entire economy. Expect other municipalities to reduce plans for future capital investment?
Dallas/Fort Worth International Airport officials may have to postpone or scale back the airport’s $3.5 billion capital expansion plan, including construction of a new Terminal F. (Fort Worth Star-Telegram) Expect to see more scaling back of long planned expansion projects due to losses in revenue and profits needed to support growth.
U.S. manufacturing output posts largest drop since 1946. Think of all the manufactured products that go into construction of a new home: Doors, windows, roofing, siding, wallboard, lighting, heating, plumbing fixtures, wire, pipe, cabinets, appliances, etc. How many of these will be in short supply leading to delays in completing new or restarted work?
The value of construction projects delayed or canceled has not yet been summarized, but surveys show the number of firms affected by delays and cancellations.
- 79% were working on (transportation) projects that had been shut down by agencies.
- 35% of AGC’s respondents indicated that they had received cancellation orders on projects issued by government or statewide agencies.
- 60% received orders to halt or cancel current projects (or those starting within the upcoming 30 days) on private and publicly owned projects.
- 11% of projects in the preconstruction phase were canceled.
- More than 40% of companies reported furloughing or terminating workers from offices and jobsites.
The Architectural Billings Index ABI survey for March, recorded the largest single monthly decline ever recorded (and that’s just for March). Billings at architecture firms plummeted in March as the ABI fell by 20.1 points to a score of 33.3 for the month (a score over 50 indicates increasing billings, a score below 50 indicates declining billings).The index dropped more in one month that it did in three years in the Great Recession. 36% of firms predict the pandemic will have a serious to devastating impact on their firm, while 66% anticipate that their annual revenue will be considerably lower than it is at present. Firms estimated that their billings would decline by 15% in April.
The ABI is a 9 month leading indicator, but I would suggest it’s usefulness as an indicator will be disrupted for at least the next 9 to 12 months. Certainly the current month and next few months of construction are not accurately indicated by the ABI from 9 months ago and it is unlikely that 9 months from now construction will experience a precipitous drop. Perhaps the ABI gives us an indication of the direction, up or down, that future construction will take, but not the magnitude.
See also these articles for all the analysis to date on the Impact of the Pandemic.
Pandemic Impact on Construction – Recession in 2020?
Pandemic Impact on Construction – Part 2
Pandemic Impacts – Part 3 – Jobs Lost, Inflationary Cost
Pandemic Impact #4 – Construction Jobs Recovery
Pandemic Impact #4 – Construction Jobs Recovery
4-15-20 How will each of the 4 shutdown impacts affect construction?
An estimate of the amount of construction volume lost between March and April could be on the order of 10% to 12%. We won’t see April construction spending #s until June 1st, but a loss of 10% equates to about $10-$12 billion work stopped in a single month.
- 30% of firms said they had been asked by government officials to shut down jobs.
- 53% of respondents said their projects have been delayed by owners.
- 7% said owners had canceled their projects.
NAHB 4-15-20 Builder Confidence Posts Historic Decline
If they stop buying them, next they stop building them. I’m forecasting temp shut down of 15% of residential backlog and a 10% drop in new starts.
U.S. manufacturing output posts largest drop since 1946
Think of all the manufactured products that go into construction of a new home: Doors, windows, roofing, siding, wallboard, lighting, heating, plumbing fixtures, wire, pipe, cabinets, appliances, etc. How many of these will be in short supply leading to delays in completing new or restarted work?
Pandemic Construction Forecasting needs to account for 4 types of impacts.
- 1 Work stoppage – stay at home, how deep is the work stoppage
- 2 Work restart – % restart/month, how slow does work restart
- 3 Work canceled – some work never restarts, how severe
- 4 New Starts – future capital spending plans canceled, how cautious
The initial shutdown cumulative total spending lowest point is in April-May 2020 due to the abrupt shut down. When work rebounds, it restarts gradually over a period of months. Some of the work that shut down will not restart. Also, reduced new starts lowers the cumulative total spending again in the first half of 2021, where residential spending hits it’s low point. Here’s the jobs impact of each.
- 1 Work stoppage – stay at home, how deep is the work stoppage
From March 15th to April 15th, it is estimated that about 10% to 12% of all construction work stopped, or about $10-$12 billion work stopped in a single month. This work remains on hold as we assess when it is appropriate to reopen the economy. A $10 billion/month work stoppage shuts down 600,000 jobs/month from Mar 15 to Apr 30, perhaps longer.
- 2 Work restart – % restart/month, how slow does work restart
For a number of reasons, all work will not restart immediately. I’ve modeled the work to restart over 6 months. If only 33% of the stopped work resumes in May, only 33% or 200,000 of the 600,000 lost jobs return, 400,000 remain shut down. If each month 100,000 more jobs restart, the net lost time over 6 months is 1,800,000 man-months or an average of 300,000 jobs for 6 months.
- 3 Work canceled – some work never restarts, how severe
It’s possible some work will be put on hold for a long time or outright canceled. If 10% of all work that was forced to shut down does not restart, then about 1.5% of all work in backlog disappears. There was $1.3 trillion in starting backlog leading into 2020. A 1.5% decline in backlog amounts to almost $20 billion in work that might not restart. That workload would have taken place over the next 20-30 months, so it is equivalent to about $1 billion a month. Jobs lost would equate to 4000 to 5000 jobs for 20 to 30 months.
- 4 New Starts – future capital spending plans canceled, how cautious
Dodge is now forecasting a 10% to 15% decline in new construction starts in 2020. (Prior to the pandemic, Dodge was forecasting a 4% drop in new 2020 starts). If new starts drop by 10%, that equates to a decline of about $130 billion in future work. That would be spread out over the next 3 years or so. On average that reduces jobs by about 20,000, but that loss lasts for the next 3 years.
Construction spending varies from month to month, but total annual rate of spending will not return to the Jan-Feb 2020 level until at least 2023. Construction jobs may not reach the Feb 2020 level again until 2024.
See also Pandemic Impacts – Part 3 – Jobs Lost, Inflationary Cost

Pandemic Impact #3 – Jobs Lost, Inflationary Cost
4-9-20
See Also Pandemic Impact on Construction – Recession in 2020 3-20-20
See Also Pandemic Impact on Construction – Part 2 3-31-20
See Also Pandemic Impact #4 – Construction Jobs Recovery 4-15-20
Today, with the unemployment claims report, we get an indication of the 3rd out of 4 weeks of the total April monthly jobs report. When the April jobs report is released on May 8th, it will cover the period March 15 through April 12. For the first two weeks, there were 10 million new unemployment claims and within that data, the Economic Policy Institute estimated there were 310,000 construction jobs lost. Today’s report show the three-week total is now 16 million claims. That could potentially indicate a total 500,000 construction jobs lost in three weeks, and that represents only 3/4ths of the April jobs report. There are still areas of the country that are just beginning to issue stay-at-home orders, so this trend will likely continue next week. When we see the next jobs report May 8th, we could see a total monthly loss of more than 600,000 construction jobs, a loss of more than 8% of the workforce. In the worst months of the 2008-2009 recession it took 5 months to lose over 600,000 jobs.
See Pandemic Impact #7 for an update on Jobs Lost

History dating back 30 years shows that construction companies have always reduced jobs by less than the reduction in work volume lost. In the previous recession, work volume fell by 50% but jobs declined by only 35%. In other words, companies tend to retain more staff than the remaining workload will support. As a result, work put in place per job, a simple measure of productivity, goes down. This drives cost up.
Given the above, we can estimate the amount of construction volume lost between March and April could be on the order of 10% to 12%. We won’t see April construction spending #s until June 1st, but a loss of 10% equates to about $10-$12 billion work stopped in a single month. After four months averaging above a seasonally adjusted annual rate (SAAR) of $1.360 trillion, we could see March SAAR spending drop to $1.320 trillion and April down to $$1.280 trillion.
Pandemic Construction Forecasting needs to account for 4 types of impacts.
- 1 Work stoppage – stay at home, how deep is the work stoppage
- 2 Work restart – % restart/month, how slow does work restart
- 3 Work canceled – some work never restarts, how severe
- 4 New Starts – future capital spending plans canceled, how cautious
The initial Pandemic Recession Scenario developed in my 3-20-20 article included a greater reduction in new starts, but did not factor in the widespread shutdown of commerce in March-April. This plot shows the shutdown, the big dip in the first half of 2020. The initial shutdown cumulative total spending (deepest) low point is in April-May 2020 due to the shut down which then rebounds with the restart of most, but not all, work. Then the cumulative total spending low point due to reduced new starts occurs in the first half of 2021, where residential spending hits it’s low point.
Will Construction Experience Inflation or Deflation?
Although as of yet there is no solid information available on materials pricing or national reports on inflation, these issues may come up;
There is a cost to temporarily shutting down a job and then re-mobilizing. That cost definitely was not included in any budgets on any projects. That cost, already incurred, will be absorbed into the final cost of projects, inflating the original projected cost. That will become a factor adding to 2020 inflation.
Some analysts are suggesting there will be a large surplus of materials that will drive cost down. However, there are reports cautioning to expect shortages or long delays of materials due to the fact that some manufacturers have experienced the same shut downs as the industries that use their products. Production of all types of products has slowed with the lack of workforce. One recent article cited expectations of many shortages of electronic, mechanical and technology components, a large volume of which are imported. So there may be difficulties in getting components of electrical, plumbing, mechanical, controls or technology products needed to complete manufacturing of the products needed on jobs in the near future.
Worldwide shipping and moving of all types of products that arrive in shipping containers has been drastically disrupted. By Mar 1 shipping at the Port of Los Angeles was already down 25%. This will cause delays in imported product deliveries which will either result in the need to use alternate products, time extension to completion or need for accelerated schedule.
There will be some difficulty associated with staffing back up to previous levels. As workers are cut from jobs, some will immediately begin to seek other available work with some potentially leaving the construction industry permanently. Although wage negotiations may be held in check, some contractors may offer incentives to secure sufficient labor to support the completion of their projects, driving up the cost of labor. Also worker productivity will be reduced to accommodate new rules instituted to insure worker health safety and distancing.
The restart is going to cause bottlenecks. Every job will be requesting delivery of needed products at the same time. The supply-side system is not designed to handle that massive influx of all-at-the-same-time orders and deliveries. This will result in materials delivery delays and/or priority order added premiums.
Along with materials issues, we can expect once projects come back on-line, some owners are going to ask for accelerated schedules to meet critical end dates. Any move to accelerate project schedules will add cost to labor. In fact it could add considerable cost. If a project is shut down for two months and the owner asks to make up 1 month, it takes more than one month of overtime to accomplish that. All overtime, including second shift work, has some lost productivity associated with it, so you never get hour for hour production on overtime hours. If the owner wants to try to meet the original scheduled end date, or make up even some of the delay, all the cost of overtime and lost productivity inflates the original cost.
Management cost to see the projects through delay, ramp back up and finally reach completion, probably at a time extension, increases beyond the original proposed staffing and time on the job.
It will take several months, perhaps even the remainder of the year, to see a trend in new construction starts. Expect capital investment plans in new building projects to increase in some markets (i.e., healthcare) but to decline in others (hospitality). Many companies will experience dramatically reduced revenues and profits which will cause them to reassess plans for future capital investment. If capital investment declines overall, which I expect it will, the amount of construction activity next year will decline. Early discussions of infrastructure investment, if increased investment comes to be reality, could change this outcome. Markets could be a bit more competitive next year if the volume of work out for bid declines. That would have a tendency to offset some of the inflationary measures listed above.
Dodge Data & Analytics on 4-9-20 released their first indications of recession analysis. Dodge predicts a 10% to 15% decline in new construction starts in 2020, but then an increase in all sectors in 2021. Dodge tracks new starts only, so does not project the spending impact of a decline in starts or of project delays.
Repeating what I stated in a previous article, What all this will do to the construction inflation rate is hard to predict. If materials shortages or delivery delays develop, that would cause prices to increase. Also, many projects that were already under construction were halted for an undetermined period of time. The delays may add several weeks to a few months to the overall schedule. These issues all add cost to a project as describe above. Looking to the future, if new starts work volume decreases, then the bidding environment gets more competitive and prices go down. However, I think in this case the materials availability issues, potential labor availability, productivity and schedule delays will outweigh any decline in work available for bid. For the short term, I would suggest to add a minimum of 1% to all baseline inflation rates for 2020 and 2021. Further assessment of future bidding environment will be required.
The first hard data on construction jobs won’t be issued until May 8th when we will get mid-March to mid-April jobs, and not until June 1st for April construction spending activity. April activity will be revised to a better number on July 1st. So the construction industry is really at a disadvantage not knowing the real impacts for several months.
Pandemic Impact #2 – Canceled vs Delayed
3-31-20
Pandemic Impacts – Part 2 – Delayed Jobs vs Canceled Jobs
See Also Pandemic Impact on Construction – Recession in 2020 3-20-20
See Also Pandemic Impacts – Part 3 – Jobs Lost, Inflationary Cost 4-9-20
Construction spending for February will be released tomorrow. It will not show any impacts yet from Coronavirus shutdowns. We will see the first indications of impact when March spending gets released on May 1st.
There will be two distinct and very different impacts reflected in the construction starts, spending and jobs numbers. 1st will be project delays. These are projects that were put on temporary hold for a month or several months. These have an immediate impact of reducing current activity. But at some point activity resumes. 2nd will be canceled projects due to companies that lost revenues and curtailed capital spending.
Consider an example: A delayed project that has 10 months remaining to completion gets put on hold for 3 months, Mar, Apr and May. If it resumes in June, the end date, instead of finishing in December 2020 as the original schedule indicated, gets pushed out to March 2021. Most of the spending still occurs in 2020 with only the final 3 months going into 2021. The months of Mar, Apr and May experience large reductions in spending, but 2020 experiences only a small reduction in spending for the final 3 months of closeout that get pushed in 2021. That adds a small amount to spending in 2021. Big reduction in Mar, Apr, May spending. Small reduction in 2020 spending. Small increase in 2021 spending.
Now consider the example of a canceled project: Companies that lost revenues due to shutdowns will quickly begin to reassess plans for capital expenditures. Some projects planned for a new start in 2020 or 2021 will be canceled. Companies will need to regain solid footing before reestablishing plans for expansion and growth. For every 10% drop in new construction starts, total construction spending drops by $125 billion, spread over a period of approximately 3 years. A 20% drop in new starts is a $250 billion drop in new spending. On average 20% of the lost spending occurs in the 1st year, 50% in the 2nd year and 30% in the 3rd year. Canceled projects have a dramatic impact on the construction industry, and the greatest impact (except for residential projects which have a shorter duration) is not felt in the first year, it’s felt in the second year.
Each loss of $1 billion of spending in any given year equates to a loss of 5000 jobs in that year. That’s 5000 job-years. A loss of $1 billion in spending in one month would be a loss of 60,000 jobs for a month.
A 10% drop in new construction starts, or $125 billion over three years, could be spread out in this manner: down $25 billion in year 1: down $62.5 billion in year 2 and down $37.5 billion in year 3. In the 1st year, we could see a loss of 125,000 jobs. But in the 2nd year, jobs are down over 300,000, so an additional 175,000 jobs are lost. In year 3 jobs are down only 187,000, less of a decline than in year 2, so we start to recover jobs. The average jobs loss is 200,000 jobs for 3 years.
Current spending is about $120 billion per month in the most active months, less in winter months. A delay of 10% of current workload, about $12 billion in a single month, would temporarily sideline 12 x 60000 = 720,000 jobs for one month, a massive disruption in a month. If the delay goes for two months, the average job loss for the year would show up as equivalent to 720,000 / 12 x 2 = 120,000 jobs for 1 year.
Jobs delayed due to work delayed would eventually be added back at a later point in time. Not that more jobs get added, but that the end-date of the project gets pushed out, so jobs delayed up front get pushed later, with some perhaps pushed into next year.
Pandemic Impact on Construction – Recession in 2020?
This analysis attempts to develop the resulting impact of a construction recession scenario caused by the current Covid-19 pandemic. The scenario presented does not assume a catastrophic failure of the U.S. economy, but does assume a large drop in construction activity in 2020 and 2021.
This analysis generates spending cash flows from current and assumed reduced new construction starts to then determine how spending may affect future construction activity.
Impact of Pandemic on Construction
Analysis of a Recession Scenario 2020-2022
by Ed Zarenski 3-20-20
The change around us is happening so fast, in my opinion, no one is ready for what comes next.
The world is struggling to get the upper hand in a pandemic, travel is coming to a near halt, stock markets are down 30% in a month, universities have sent students home, schools and businesses are closed until further notice, events all around the country are being canceled and people are being instructed to stay home and limit social contact.
We won’t get the first hard data of Coronavirus impacts on the construction industry spending and jobs until reports released in first week in May which will cover jobs mid-March thru mid-Apr and spending for March. The first hint at what we might expect regarding slowdown could be the Dodge construction starts for March which comes out around Apr 20. But spending and jobs from work in backlog coming out in the May reports could be better 1st indicator.
Firms that manufacture goods used in construction may be closed temporarily, so they are producing less. Shipping of products on world markets has slowed or stopped completely. Materials supplies will soon be affected. Construction projects will most likely experience delays. Product shortages, delivery delays and shutdowns will drive up costs and extend project schedules.
Projects in planning may be canceled due to drop in demand, decline in capital or slowdown in economy. Retail stores may cancel expansion, educational facilities may delay starting new construction, transportation facilities may postpone later phases of long planned growth.
As I sit here writing this, the city of Boston this morning announced that ALL non-essential construction projects are to shut down today. That’s nearly all projects. Boston accounts for $22 billion/year in construction spending, 80% of all construction in the state of Massachusetts, 60% of all work in MA-CT-RI, 50% of all New England. This affects well over 100,000 jobs.
Also, the San Francisco Bay area has been directed to shelter-in-place, essentially shutting down all nonessential construction work. This impacts approximately 200,000 construction jobs and amounts to about double the volume of work as Boston.
We can expect more locations to issue directives such as these in the near future.
How Can We Measure the Effects Due to Covid-19 Impacts?
Let’s first establish the baseline. The starting baseline is my current construction spending and backlog forecast for 2020-2021 which includes 2019 total spending and new construction starts through February. There is considerable strength in Nonresidential Buildings and Non-building Infrastructure starts and spending. There is weakness in residential.
The best indicator of future construction activity is the sum of the projected monthly cash flows generated by all the construction starts that have been recorded.
This plot shows the correlation between projected cash flow from starts and actual spending.

Recession What If? Starting Baseline
To begin, we can look at the current forecast of new starts, backlog and spending.
Construction Starts in 2018 were up 4% and prior to that were up 10%/yr. 2019 starts including revisions are up 4%. 2020 starts are forecast down 4%. Current Backlog is up 30% in the last 4 years, at all-time high. Although spending is forecast up only 4%/yr. the next two years, spending is at an all-time high.
Residential construction starts peaked in 2018. Starts in 2019 are level yoy, but have been flat or in moderate decline since mid-2018. Spending is forecast up 5% in 2020 but down 1% in 2021.
Nonresidential Buildings starting backlog increased 10%/year for the 4 years 2017-2020. Starts have moved sideways or in slight decline since mid-2018. 2019 starts are down 9% from 2018. Spending is forecast up 3% in 2020 and 2021.
Infrastructure starting backlog, by far the most robust, has increased 15%/year for the 3 years 2018-2020. Spending is forecast up 6% in 2020 and up 8% in 2021.
It is important to understand when spending from backlog occurs. Average cash flow curves for nonresidential work show about 15%-20% of spending from new starts occurs in the year started and about 40%-50% occurs the following year. 80% of all nonresidential spending in any given year is from backlog. If new starts drop by 10%, that has only a 1.5% to 2% impact on total spending in the first year. The following year spending would be down 4% to 5%.
Residential spending is far more dependent on new starts than backlog. Only about 30% of residential spending comes from backlog and 70% from new starts. If residential new starts drop 10% that impacts total spending by 7% in that year.
Recession Scenario
When a recession occurs, new construction starts would be substantially reduced. Although some projects will be canceled or delayed mid-schedule, most projects already in construction would move on to completion. Most of the cut back comes from a reduction in new starts.
In the great recession, residential starts dropped 70% from 2005 to 2009, down from $400 billion to $110 billion. Nonresidential Buildings starts dropped 35% from 2008 to 2010. Nonbuilding starts fell only 6% in 2009. Total All Spending declined 30% from $1.160 trillion in 2006 to $788 billion in 2011.
Regardless what may lead to a construction recession, in this case a global pandemic, it is the current high amount of work in backlog that will work hard to mute its effect.
No analyst had been indicating huge declines in new construction starts within the next few years. At worst, some suggested a moderate slowdown. Prior to today, data seemed to agree with a moderate slowdown.
Although Dodge is forecasting the $ value of housing starts down 6% in 2020, Housing Starts # of units as reported by US Census in Q4 2019 are at a post-recession high, reducing the likelihood of such a decline.
Dodge 2020 forecast for new nonresidential buildings starts is down 2.5%.
This recession scenario does not assume a catastrophic failure of the economy.
It is unknown how much existing or new work might get canceled. To get an idea how a recession might impact construction spending, this analysis reduces new construction starts by 20% in 2020 and 10% in 2021 from the baseline. That’s about the average of what occurred in the great recession, although then it was far greater in residential and much less in non-building infrastructure. Only once in the last 20 years, other than the great recession, did new construction starts drop more than 5% in any sector in a year.
So initially, compared to the baseline forecast, there would be 20% less work to bid on in 2020 and 10% less in 2021. But that is not how spending, or revenues, would react. Backlog and spending schedule curves determine the impact on spending, or revenues.
Here’s the resulting change in the spending plots. Only the estimated spending to the right of the dateline changes.

Residential construction spending would drop about 14% in 2020 and then drop 13% in 2021 below the baseline scenario. Residential is far more dependent on new starts within the year for spending than on backlog. That’s why residential spending drops quicker than all other work.
Nonresidential Buildings spending ends 2020 4% lower than it would have under the baseline scenario but then drops 12% in 2021 and 10% in 2022. Backlog going into 2020 in this sector is strong and therefore, even though spending is 4% lower than baseline, 2020 still posts a spending gain of 1.5%. 2021 declines 8% and 2022 gains 1%.
Non-building Infrastructure spending ends 2020 3% lower than it would have under the baseline scenario but then drops 9% in 2021 and 10% in 2022. Non-building Infrastructure has so much work in backlog that this sector still posts a spending gain of 6% in 2020 and 1% in 2021. It declines by 2% in 2022.
The major declines in 2020 are residential since most residential spending comes from new starts within the year, but for all other work, the strength of backlog going into 2020 pushes most of the declines out to 2021 and 2022.
Total all spending would drop from the current 2020 forecast of $1.365 trillion to $1.260 trillion. In 2021 and 2022, instead of baseline spending of $1,370 trillion, it would drop to $1.230, back to the level of 2016. The losses in the Great Recession, a total drop of almost $400 billion, set construction spending growth back 12 years.
Not only did Boston shut down non-essential construction projects but also New York and California have done the same. Boston accounts for about $20 billion/year in construction spending, but NY and CA together account for about $280 billion. Let’s assume CA and NY and Boston shut down all but critically essential construction for 1 month. Let’s say that is 80% of all construction. That represents a shutdown of $20 billion of construction in one month’s time.
The difference with temporary shutdowns vs a reduction in new starts is that work shut down is delayed. It will reduce total spending in that month in 2020 but will shift the entire schedule of spending out by some number of months. Upon resuming, some will still occur in 2020, and some very likely gets pushed into 2021 or later, but eventually all of the delayed work will get completed. If 20% of all U.S. construction shut down for one month it would delay $25 billion worth of work by one month. If 20% of all 2020 U.S. construction new starts get canceled, it would reduce future workload by $250 billion, spread over the next three years.
The magnitude of spending declines would impact the jobs situation. History shows that job declines of the same magnitude do not follow immediately with volume declines, therefore we would not see an equivalent reduction in workforce in 2020. But spending declines in 2021 and 2022 could lead to a loss of about 500,000 to 750,000 jobs. Over the course of the great recession we lost 2.3 million jobs.
You can read more about the job situation here.
To summarize:
This is a WHAT IF? Analysis.
Assumption that new construction starts drop 20% in 2020 and 10% in 2021 lower than the baseline forecast.
This would cause total construction spending to drop 8% in 2020, 12% in 2021 and 7% in 2022 from the previously established baseline forecast.
The spending declines measured in dollars, measured from the previously established baseline forecast, are: down $100 billion in 2020, down $140 billion in 2021 and down $100 billion in 2022.
This could lead to a loss of about 500,000 to 750,000 jobs for three years.
What this will do to the construction inflation rate is hard to predict. Typically when work volume decreases the bidding environment gets more competitive and prices go down. However, if materials shortages develop, that would cause prices to increase. Add to these issues the fact that almost every project currently under construction may be halted for a period of time, the delays may add several weeks to perhaps a month or two to the overall schedule. I think in this case the materials availability issues and schedule delays will outweigh any decline in work available for bid. I would add a minimum of 1% to all baseline inflation rates for 2020 and 2021.
“None of us have much of a sense what the economy will be in 2021.” Fed Chair Jerome Powell 12-11-19
See Also Pandemic Impact on Construction – Part 2 3-31-20
See Also Pandemic Impacts – Part 3 – Jobs Lost, Inflationary Cost 4-9-20
