Home » Posts tagged 'recession' (Page 2)
Tag Archives: recession

WHAT IF? Construction Recession 2020
8-15-19
Talk these days isn’t whether or not we may slip into another recession, but when. Analysts are watching for signals. On any given day you can read articles pointing to why we are or why we are not headed into another recession. But, I wrote an article similar to this 3 years ago, so that opinion has been around awhile. I’m not taking a position here. I would just like to get a rough idea of implications, so I tested some data.
What would happen to this current construction recovery if we slip into recession?
If you think of a recession as having an immediate affect on total construction, like a quick drop in materials prices or cost of buildings, think again. Construction is sort of like an aircraft carrier, it takes a long time to turn around.
My starting baseline is my current construction spending and backlog forecast for 2019-2020 which includes YTD Spending and Starts through June. All spending and starts are current$, unadjusted for inflation. There is considerable strength in Nonresidential Buildings and Non-building Infrastructure starts and spending. There is weakness in residential.
NORMAL FORECAST current to Jul 2019 with no modifications
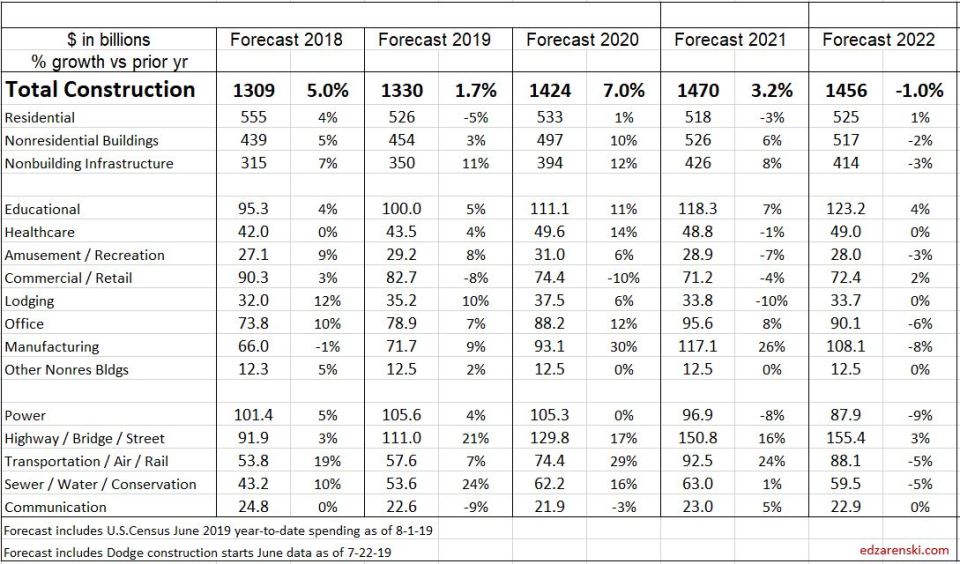
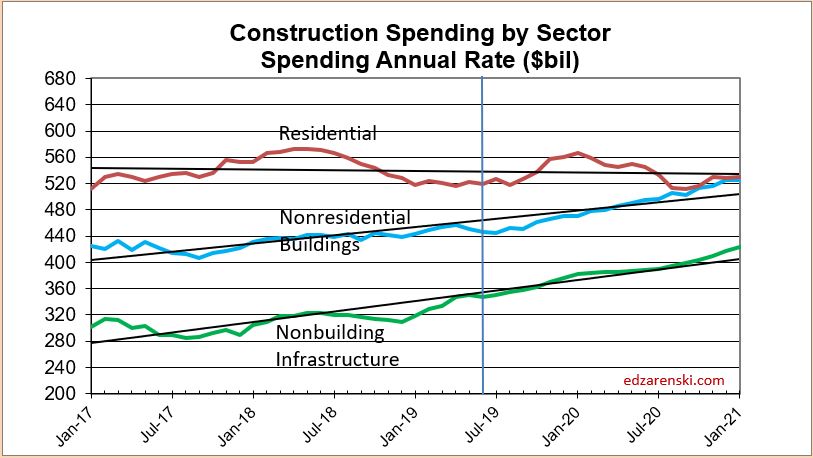
NORMAL FORECAST spending plots for the next 18 months.
Recession What If? Starting Point
The best indicator of future construction activity is the projected cash flow generated by all the construction starts that have been recorded. Construction starts mark the beginning of spending on new projects. Projects can take many months to reach completion, and the cash flow varies over the project time.
For the 2020 forecast, we can look at new starts and backlog.
Construction Starts YTD total as of June is down 8% from 2018. That’s expected to improve by year end.
Residential construction starts peaked in 2018. Starts have been sideways or in light decline since mid-2018. Year-to-date June 2019 starts are down 9% from 2018. Avg SAAR for 1st 6mo 2019 is $315bil, same 6mo last year was $340bil. Starting backlog is down 5% from 2017 to 2019. Spending is forecast down 5% in 2019 and up only 1% in 2020.
Nonresidential Buildings starting backlog increased 10%/year for the 4 years 2017-2020. Prior to this recession scenario analysis, nonresidential buildings spending was forecast up 10% in 2020 and 6% in 2021.
Infrastructure starting backlog has increased 15%/year for the 3 years 2018-2020. Prior to this recession scenario analysis, non-building infrastructure spending was forecast up 12% in 2020 and 8% in 2021.
For nonresidential buildings, 80% of all spending in any given year is already in backlog from starts prior to that year. For non-building infrastructure it’s 85%. Starting Jan. 1, 2020, 80% to 85% of all nonresidential spending in 2020 is already on record in backlog. For residential, only 30% of spending in 2020 is in backlog at the start of the year. Due to shorter duration, spending is more dependent on new starts within the year.
Backlog starting 2020 for the following six markets is at the highest starting backlog ever for each of the six markets. Also, these six markets account for 1/3rd of all construction spending. Much of the spending from these starts occurs in 2020.
These markets posted the best construction starts 12-month totals ever (in noted period).
- Manufacturing from Jun18>May19, up 36% in two years
- Office May18>Apr19, up 8%/yr for the last 4 years
- Educational Jun18>May19, monthly rate for 12 of the last 16 months increased by 20%.
- Public Works May18>Apr19, increased 30% in the last 24 months.
These very long duration markets posted best new starts ever.
- Highway Dec 17>Nov18, up 25% compared to prior 12 months, which was the 2nd best 12mo ever, with peak spending from those starts expected in 2020.
- Transportation (2yrs) Jan17>Dec18, up 25% from the prior 2 years, but with the peak 12 months up 35% from the prior 2 years, with peak spending 2020.
Growth in new starts and backlog for the last three years (2017-2018-2019):
- Manufacturing starts up 44%, backlog up 62%
- Office starts up 30%, backlog up 62%
- Highway starts up 45%, backlog up 70%;
- Transportation starts up 64%, backlog up 138%;
- Public Works new starts up 45%, backlog up 72%.
In the last two years, Commercial/Retail market starts are down 18% and 2020 starting backlog will be down 11%. The only other declines in 2020 starting backlog are Amusement/Recreation (-1%) and Power (-5%).
So, we are starting 2020 with the highest backlog on record after several years of elevated starts. However residential work is already down slightly while non-building infrastructure work is super-elevated. It is this elevated backlog that will mute the impact of a recessionary downturn.
What If? we reduce new starts
If a recession were to occur, it would substantially reduce future construction starts. Most, if not all, projects already started would move on to completion, but new starts will be cut back. However, the last “construction” recession started in 2006-2007 with declines in residential work. New starts in nonresidential buildings kept increasing into 2008. The “nonresidential” spending recession did not start until 2009, three years after the beginning of the residential decline.
To get an idea how another recession might affect construction spending, I kept all backlog growth predicted through 2019, but I reduced future new construction starts, for two years, starting Jan 2020. I’ve started the reductions for all sectors at Jan. 1, 2020 because residential starts and spending have already been in decline for more than a year.
- Residential starts reduced by 15% in 2020 and by 5% more in 2021
- Nonresidential buildings reduced by 20% in 2020 and by 10% more in 2021
- Infrastructure projects reduced by 10% in 2020 and by 5% more in 2021
This is only about 20% of the residential declines we experienced from 2006 to 2009, but I’m not anticipating another residential massacre. Residential has already been in decline for 12 months. The nonresidential buildings decline now is only half of 2008-2010. I reduced infrastructure by the least since there was only moderate decline in infrastructure work in 2009-2010, yet still I’ve reduced infrastructure twice as much as 2009-1010. I allowed for a 3% increase in new starts in 2022 across buildings sectors and a 2% increase in infrastructure.
The Recession Scenario Results
The recession 2020 scenario keeps 2019 forecast intact and reduces new starts by 15%-20% in 2020 and 5%-10% in 2021, so imparts a two year downturn. It’s effects, begun Jan.1, 2020 could be translated over time, if say the same scenario started but 12 months later. Negative reaction in the market is quickest to happen for residential, delayed a year for nonres buildings and takes longest (2 years) for infrastructure, for reasons of longest duration type work and highest prior rate of backlog growth.
The recession affects are muted by the fortunate starting point of record high backlog. Residential construction spending will experience two to three declining quarters each of the next three years. But beyond Jun 2022, residential stabilizes and resumes growth. Residential is the only sector to post quarterly spending declines in 2020. Nonresidential buildings posts the 1st quarterly decline in Q1 2021 and has at least seven consecutive quarters of declines before flattening out in Q4 2022. Non-building Infrastructure experiences the 1st two consecutive quarters of decline starting Q4 2021 and reaches a low in Q4 2022. Due to the unevenness of growth, Total Construction spending increases through Q1 2020, posts two declining quarters in 2020 and three consecutive quarters of declines in each of 2021 and 2022.
RECESSION FORECAST spending plots for the next 30 months.

Here’s a reminder of the amount of reductions in new starts. I kept all backlog growth predicted through 2019, but I reduced future new construction starts, starting Jan 2020. I’ve started the reductions for all sectors at Jan. 1, 2020 because residential starts and spending have already been in decline for more than a year.
- Residential starts reduced by 15% in 2020 and by 5% more in 2021
- Nonresidential buildings reduced by 20% in 2020 and by 10% more in 2021
- Infrastructure projects reduced by 10% in 2020 and by 5% more in 2021
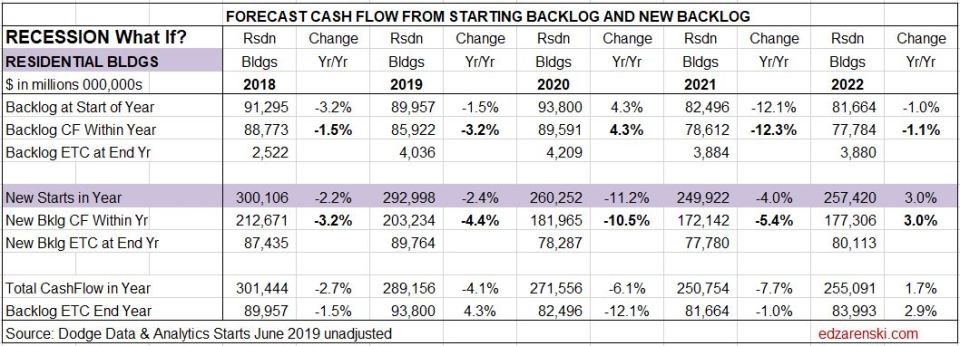
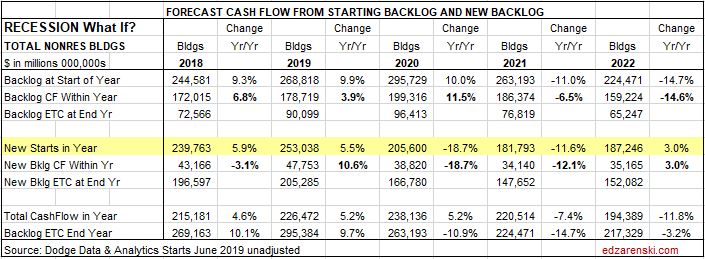
We still see an 11% increase in backlog in 2020, because we did not reduce 2019 starts, but spending from reduced new starts in 2020 drops 2020 cash flow within the year to slow growth of 2%. Reference the baseline spending chart to see prior to reducing starts 2020 spending was forecast to increase 7%. Backlog drops 7% in 2021 and then 11% in 2022. This model predicts a 4% decline in construction spending in 2021 (baseline was +3%) and a 5% drop in 2022 (baseline was -1%), setting us back to the level 2016-2017.

Starting Backlog is down 4.4% for 2023, but even modest new starts growth of 3% helps partially offset the decline in spending. Spending never drops below the level posted in 2015-2016.
The last recession started with residential in 2005 and ended with nonresidential in 2011. Total decline during that period set total spending back 12 years, although the setback was 15 years for residential, 7 years for nonresidential buildings and only 4 years for infrastructure. This mild recession causes a setback to 2015-2016 levels, back 6 years, and less for infrastructure.
RECESSION FORECAST current to Jul 2019 with reduced starts 2020-2021
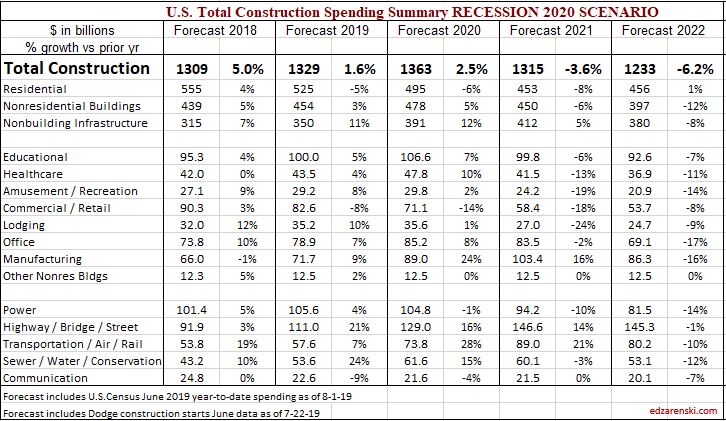
Residential construction would drop about 6% in 2020 and then drop another 8% in 2021. Residential is far more dependent on new starts within the year for spending than on backlog. That’s why residential spending drops quicker than all other work.
Nonresidential buildings gain 5% in 2020 but then drop 6% in 2021 and 12% in 2022. The strength of backlog going into 2020 pushes most of the declines out to 2021 and 2022.
Non-building Infrastructure has so much work in backlog that this sector still posts spending gains in 2020 and 2021. It drops 8% in 2022. The strength of backlog going into 2020 pushes much of the declines out 2022.

The baseline forecast would have produced spending increases of 9% from 2020-2022. The recession scenario indicates a 7% decline. That magnitude of turn around would impact the jobs situation. We would probably not see any reduction in workforce in 2020 but the spending declines in 2021 and 2022 could lead to a temporary loss of about 200,000 jobs in 2021 and 300,000 jobs in 2022.
Educational 2019 spending is supported by a steady stream of strong starts that began in late 2017 and extended into summer 2018. Jun-Jul-Aug 2018 starts posted the best 3mo total starts ever and peak spending from those starts occurs from April 2019 to Jan 2020. Most spending in 2020 comes from projects that start in the 1st half of 2019. So far in 2019 starts are up 15% ytd over 2018.
Commercial Both store and warehouse starts dropped in 2018. Commercial starts are seeing strong gains from distribution centers (warehouses, which are in commercial spending). Since 2015 the 10% decline in retail stores is being hidden by the 50% increase in warehouses, which are at an all-time high. Stores are down 10% from the peak in 2016. Warehouses are down 5% in 2018 but increased 500% from 2010 to 2017.
Manufacturing Backlog is still very strong, but a drop in peak spending from the schedule of cash flows will lead to a period of moderate spending declines. After that, manufacturing spending increases steadily through the end of 2020. Current expectations are that manufacturing will finish the year up 8%. 2020 will be an extremely strong growth year, spending potentially increasing 20%+. Reductions in starts won’t show up as negative spending until 2022.
Office spending is expected to finish 2019 up 7% or less. New starts in 2018 were up 11% to a new high, but much of the peak spending, from over-sized long-duration projects, will benefit 2020 when I expect to see spending growth of 8%-11%.
Transportation starts have two main parts, Terminals and Rail. Some analysts include transportation in nonresidential buildings. That does not consider the following: airports include not only land-side terminals but also air-side runway work; rail includes platforms and all railway right of way work, which includes massive civil engineering structures. About half of all transportation spending is rail work. Construction Analytics follows U S Census construction spending reports which include all terminals and rail in Transportation.
Terminals and rail starts reached record highs in 2017 and record backlog in 2019. 2019 starting backlog is four times what it was in 2015.
However, much of that backlog is very long duration project spending that will occur in future years. Some of the project starts in 2016 and 2017 have an eight-year duration. From Oct’16 through Oct’18 there were sixteen $billion+ new project starts and seven $500million+ new starts. Some projects started in this period have peak spending occurring in 2020 and 2021.
Highway/Street/Bridge starts hit an all-time high in 2018. Current 2019 progress shows new starts leveling off. Starting backlog increased 70% in the last 3 years leading into 2020. A lot of this is long duration backlog that will provide for large increases in spending in from 2019 to 2021.
Environmental Public Works (Sewage, Water supply and Conservation) new starts all declined from 2014 through 2017. Then all showed 14% gains in 2018 and the forecast is +15% in new starts in 2019.
IF Another Recession, What Would Happen to Construction?
8-15-19 See WHAT IF? Construction Recession 2020
1-27-16
The wheels of construction turn slowly.
There is plenty of talk these days of whether or not we may slip into another recession. On any given day you can read several articles pointing to why or why not we are headed into another recession. I’m not trying to take a position here. I would like to get a rough idea what would happen to this current construction recovery if we do slip into recession.
A starting baseline for this discussion is my forecast for 2016; total spending up 10%. nonresidential buildings up 14% after a 17% increase in 2015, residential up 12% following 13% in 2015 and non-building infrastructure up 1% for a total less than 2% in 2015-2016. So, you can see I’m not predicting a recession.
If you think of a recession as having an immediate affect on total construction, like a quick drop in materials prices or cost of buildings, think again. Construction is sort of like an aircraft carrier, it takes a long time to turn around.
The best indicator of future construction activity is the projected cash flow generated by all the construction starts that have been recorded. Construction starts represent the beginning of spending on new projects. Projects can take many months to reach completion. Some portion of the total project spending occurs in every month over the full duration of the project from start to completion.
We start 2016 with a backlog of projects that will generate about 70% of all the cash flow in 2016. It’s likely that most if not all of the projects already started would move on to completion. But new starts will be cut back.
To get an idea how another recession might affect construction spending, I kept all backlog as is but I reduced future new construction starts for the next two years (2016 and 2017) by 30% for residential and nonresidential buildings, and 15% for infrastructure projects. This mimics the declines we experienced from 2006 to 2009. I then allowed for a 5% increase across all sectors in 2018.
The result is a 5% drop in construction spending in 2016, still higher than 2014, but then a 10-15% drop in 2017 setting us back to near the same level as 2013.
These spending declines would cause a temporary loss of about 400,000 to 500,000 jobs.
Nonresidential buildings could still eke out a slight gain in 2016 but would drop 20% in 2017. Residential construction would drop about 5% in 2016 and then drop another 10-15% in 2017. Nonresidential infrastructure work would decline 10% in 2016, but then rebound to no change in 2017.
After two years of declines, in 2018 nonresidential buildings would climb back to near even with 2017, residential would grow 5% and infrastructure would remain flat. Total 2018 spending would climb only 2% over 2017 and would still only reach spending in 2013.
So, a 30% decline in activity for two consecutive years starting today would set us back four to five years, but the major affect would not be felt until 2017. If that were to happen, obviously spending would be revised, but also I would have much different predictions for inflation and jobs.
There’s a reason we see the dips and rises on the chart in both 2016 and 2017. It reflects the decline in the rate of new starts plus the remainder of old backlog finishing at varying end-dates. Also, given a constant amount of seasonally adjusted new starts, there is a difference in the actual amount of starts in winter months vs summer months. This plays out over time as dips and rises in spending. Spending activity will not be smooth in a recession.

