12-6-19
The construction spending forecast for 2020 indicates 2% growth. But predicted 2020 construction inflation is slightly higher than 4%. So, real construction volume in 2020 decreases by 2%. Jobs should follow volume growth, yet history shows that in non-recessionary periods, even with volume declining, jobs usually continue to increase, but perhaps at a slower rate.
This plot shows the forecast volume decline in 2020. For the 2020 forecast we already have 80% of all nonresidential spending in backlog. Since new starts account for only 20% of the spending in the year, a 10% drop in new starts from forecast affects only 20% of the spending, so has only a 2% impact on the total. Nonresidential shows flat to moderate gains in 2020.
Residential forecast will be much more dependent on new starts in 2020. About 70% of residential spending within the year comes from new starts within the year, so quick or large changes in new starts has a huge effect on spending for the year. Residential spending is down 10% from early 2018 but residential volume after accounting for inflation is down 15% since that early 2018 peak.
Simply stated, there has not been any volume growth in the last two years to support jobs growth. In constant $, there was no volume growth in any sector in 2018. In 2019 and 2020, only Non-building Infrastructure shows growth, 2%-3%/yr.
This plot shows predicted 2020 jobs growth of 1.5% or just over 100,000 jobs. Since volume is forecast to decline, any jobs growth in 2020 will increase the disparity between jobs and volume growth. The disparity has been increasing since early 2018. It’s a 15% difference right now. Within a year that could be 20%.

To emphasize the growing difference, look at these two plots, actually, the same plot just modified to account for the 15% bust in 2006.
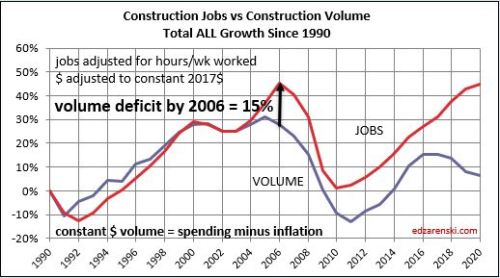
By accounting for the 15% difference in 2006, essentially, resetting the baseline to 2006, it shows all other years up to 2017 were pretty well-balanced growth. With the exception of 2006 and now 2018-2019, for almost every year from 1997 to 2019 jobs grew pretty closely aligned with volume. A big spread occurred in 2006, then growth remained balanced through 2017. The spread now is near the same as it was in 2006.

Construction jobs growth slowed substantially the last two quarters. I predicted jobs growth would slow because volume growth had already been declining since early 2018 when volume reached a peak of $1,300 billion. Volume is now $1,170 billion, down 10% in 20 months. After 6 years of jobs increasing at an average 275,000/year, jobs are up only about +150,000 in the last year, but only +48,000 in the last 7 months. The rate of jobs growth is now the slowest in 7 years. I expect this trend to continue.
The plot of jobs growth below shows current growth rate is below an annual rate of 150,000 jobs/year and it is expected to remain there through 2020, potentially dipping as low as 100,000.

I’d be surprised if jobs start to decline, but that certainly could be envisioned and it would help explain away some of the disparity in growth shown on the Jobs/Volume plot up above.
see also Construction Jobs and JOLTS
