We are still not where we should be with actual data due to government data delays caused by the shutdown. Recent releases bring BLS jobs data up to Dec, PPI data through Nov and Construction Spending data through October. Here’s a collection of tables and plots reflecting some of that data through the end of January.
Construction Spending Value Put in Place
The November 2025 release, originally scheduled for January 2, 2026, and the December 2025 release, originally scheduled for February 2, 2026, for the Monthly Construction Spending report have been rescheduled for release on February 27, 2026.
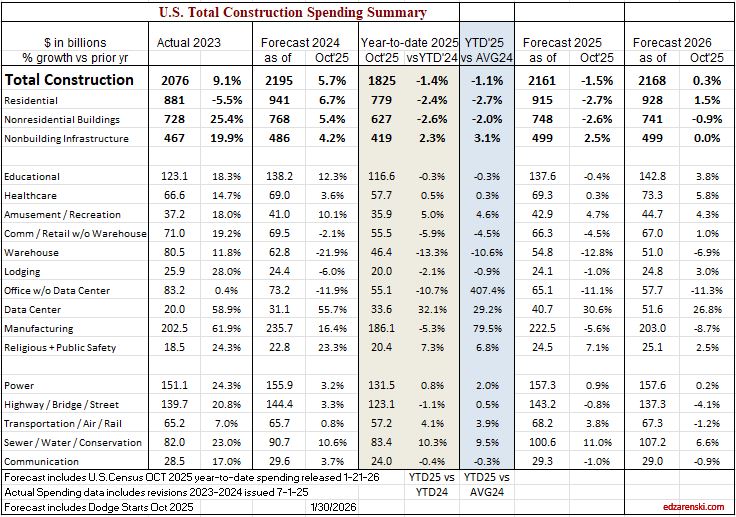
There’s is an unusually large decline in residential construction spending in Sept data, almost entirely attributed to renovation work. A closer look at the data shows it may be that Aug and Oct reno data seem out-of-sync and those may be overstated. All 2025 data still open to Jul 1 revision.
25 data center projects were canceled in 2025 amidst surging local opposition — 4X as many as in 2024.
( Personal opinion – Data Center growth will be restricted by difficulty to ramp up power generation and transmission. This in turn will slow construction spending growth in this market).
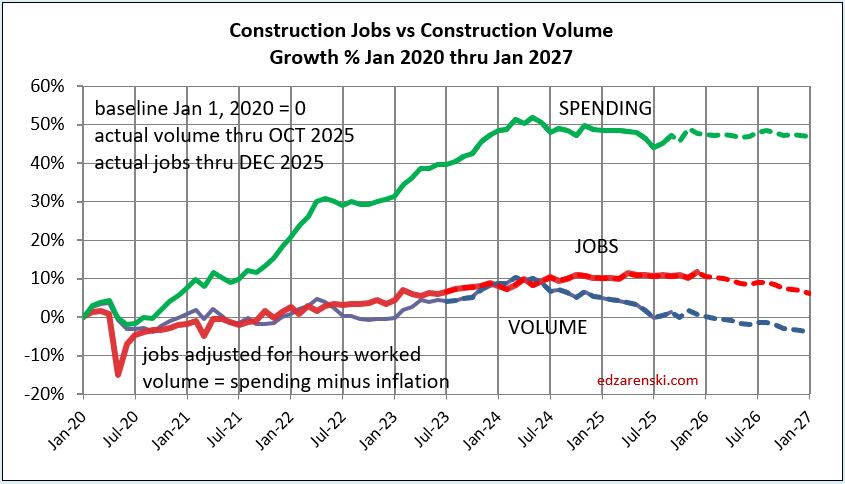
Construction Jobs increased 1.1% in 2025. Spending (actual thru Oct) fell 1.5% in 2025. But inflation ate up 4% of spending. So real volume of construction activity fell 5.3%. Therefore, productivity fell 6.4%.
Also, if your construction business revenue increased less than 5.3% in 2025, your real business growth fell in 2025.
Jobs 2025 Nonres Bldgs +1.6%, Nonbldg +2.4%, Residential -0.6%
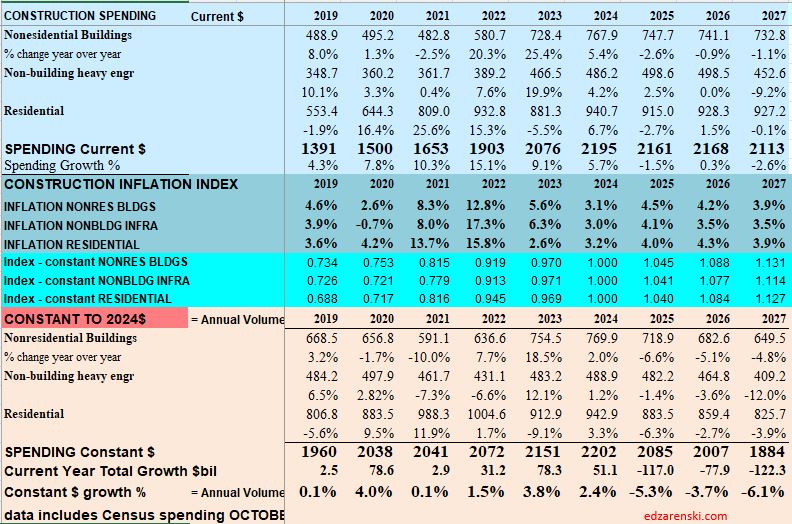
Construction Spending – Volume – Jobs
Construction Jobs avg 2025 increased only 88k from avg 2024. Slowest jobs growth since 2011 (ex 2020). Jobs 2025 up 1.1% over 2024. Jobs have been flat (or +/- slight) since Feb.
Residential jobs down 0.6%, but rsdn spending ytd thru Aug down 3.7% from Q4’24. After adjusting for inflation rsdn volume ytd is down 6%. Nonres Bldgs jobs up 1.6%. Nonres Bldgs volume down 3%. Nonbldg jobs up 2.4%. Nonbldg volume up 1.5%.
Environment for construction jobs looking difficult. Volume of work (spending minus inflation) available is declining all through 2026. Biggest declines by far, Manufacturing and SF Rsdn.
In the 10 months period Jan-Oct’25, construction volume declined by 4%. In the same period, construction jobs increased by 0.5%. And yet some economists are saying that job openings and hires indicate a labor shortage. Jobs should follow the amount of business volume.
Don’t expect construction to add jobs in 2026. While spending may be near flat, inflation data for 2026 has volume projected to fall 3.7%.
Construction Productivity
Construction spending constant $$ (volume) for 2025 is down 5.3% compared to start 2025 or same month 2024. I’m forecasting a decline of 3.7% in 2026. A 3.7% drop in volume could be a loss of 300,000 Jobs. Companies usually don’t cut # of jobs indicated by falling business volume. More jobs remain than volume. Productivity ($ pip per job) declines.
In 2026 real construction volume after inflation is expected down -3.7%. If we keep all current jobs, then volume put-in-place per job is lower, a decline in productivity of 3.7%. If we want to maintain the current level of productivity, we would need to lose 3.7% (300k) jobs. Unless the volume of work increases, I’d expect productivity to fall in 2026.
Volume of work is spending minus inflation. When jobs growth exceeds volume growth, productivity is declining. Volume has been declining for last 2 years and is expected to continue declining in 2026.
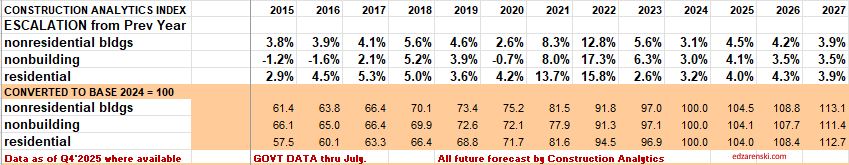
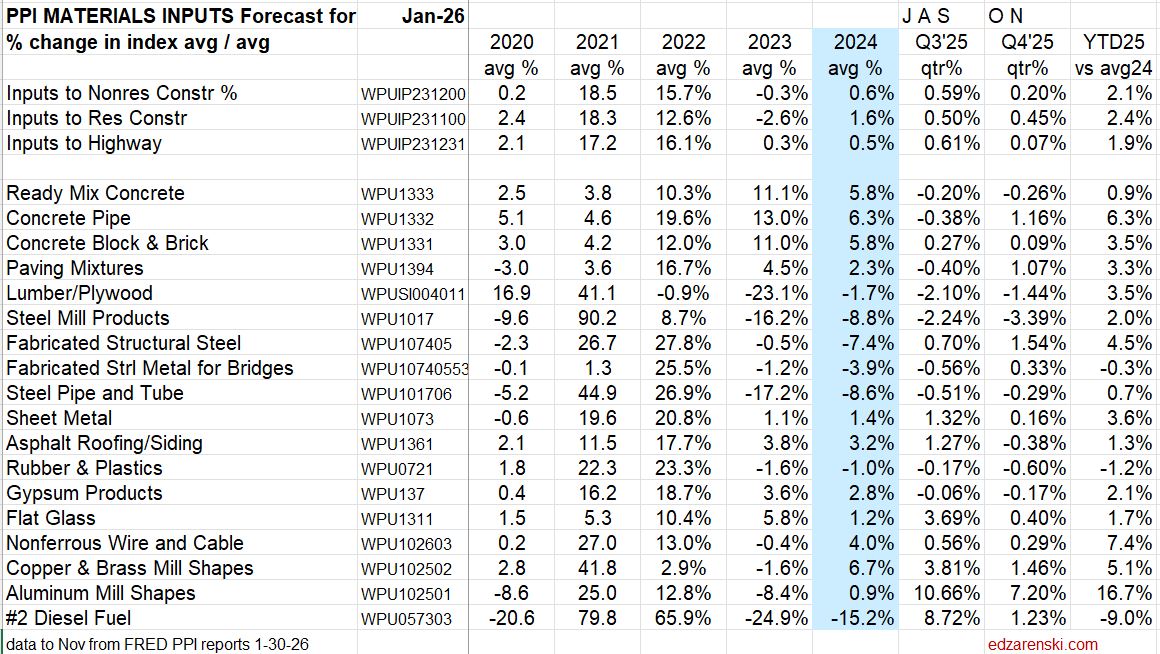
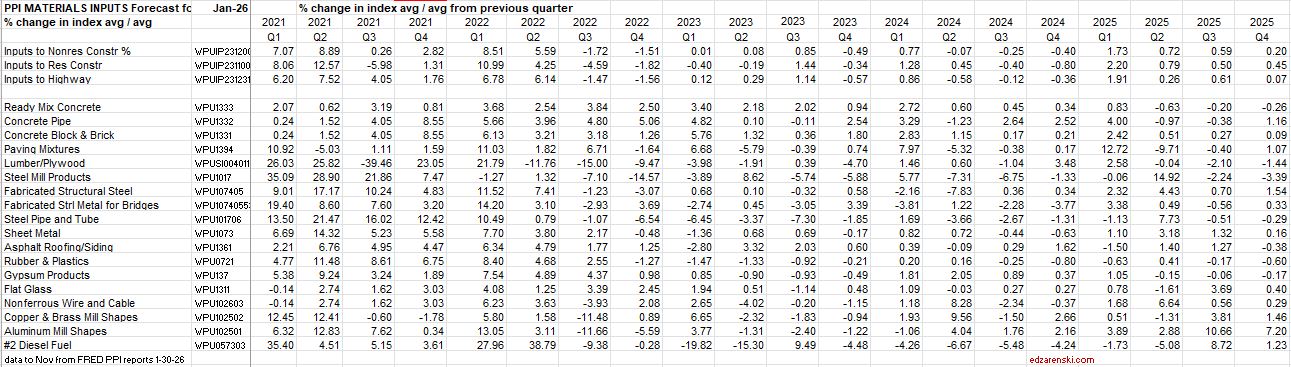
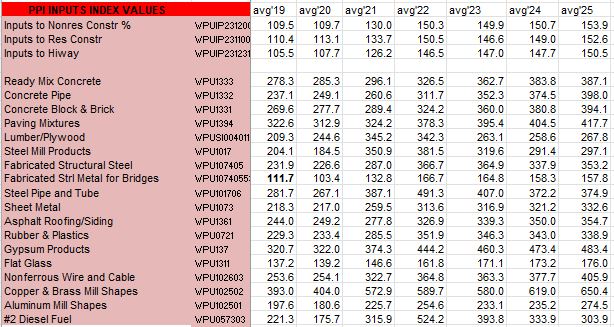
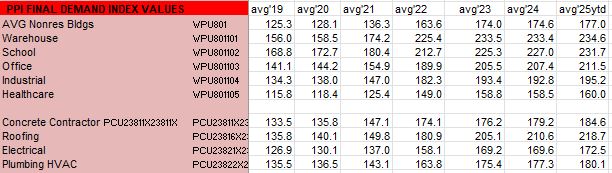
Inflation Index and Producer Price Index
If you track company revenues as business growth, without adjusting your business plan for inflation, you’re tracking register receipts, not business volume. Here’s a simple example to understand the difference in revenues (spending) vs volume. If a basket of apples 2yrs ago cost $25, but today the same basket cost $35, receipts increased 40%, but business volume has not changed.