Home » Posts tagged 'housing'
Tag Archives: housing
Brief Notes on Mar2019 Construction Spending Report
5-1-19
Census released March spending today and from my point of view the numbers are showing a surprise downward shift. Nonresidential Buildings and Non-building Infrastructure both showed upward movement as expected but Residential spending posted the eight decline in nine months.
Construction Spending for March posted at $1.282 trillion, 1.5% below (my) expectations. Nonresidential increased BUT Residential is down 2% from Feb. Jan was revised down 4.6% and Feb revised down 5.6%.
Residential spending is now 8% below March 2018. The decline is about half in single family and half in renovations. Multi-family spending is up 11% year/year.
The only monthly gain in residential spending since July 2018 is in Dec, but in the nine months Jul to Mar spending is down 10%. Q1 2019 spending has dropped back to a level of Q1 2017. This is pushing my 2019 residential spending forecast into a decline, 1st decline since 2010.
I’ve posted reasons why I expect upward revisions to residential spending, but I question if revisions can turn around the current 10% decline from last July. It now looks like residential construction spending will NOT post any gains in 2019. That’s more serious than it first appears, since spending needs to increase at least 4% to 5% just to counter inflation. In other words, if residential spending in 2019 posts a 2% decline, real residential volume after inflation would decline by 6% or 7%.
In real volume, after adjusting for inflation, residential construction spending, as of March, is down 12.5% year over year. That hasn’t happened since 2009. Perhaps revisions will recover half that decline, but not all. Contrary to the decline in real volume, in the last year residential construction jobs are UP 3.5%.
Manufacturing currently appears stronger than it is expected to finish the year. Up 6% year-to-date and up 10% from last March, we could see those gains fall off over the next 6 months. Backlog is still very strong, but the schedule of cash flows from old jobs will lead to several months of moderate declines. Initial forecast was for 2% growth in 2019. Current expectations are that manufacturing will finish the year up between 2% to 4%. 2020 will be an extremely strong growth year.
Office spending, similar to manufacturing, could post several months of moderate declines. In fact, my forecast shows office spending declines in 6 out of the next 7 months and finishes the year at the same monthly rate of spending as we are at now. Office is up 8.4% ytd but I expect the year to finish up 4% or less. Initial forecast was up 6% for 2019. New starts in 2018 were up 11% but most of that spending will benefit 2020 when I expect to see growth of 6%.
Commercial spending is currently down 4.8% ytd and 7% lower than last March. It will move slightly lower before it improves, finishing the year down only 1% to 2%. 2020 may not get more than a 1% gain.
Educational spending will finish 2019 much stronger than current spending but the year will only make slight gains over 2018. Current spending is up 5.5% ytd over 2018 but that will taper off. However, the strong activity in the 2nd half of 2019 will lead to substantial growth in 2020.
More notes will be added in the coming days as I review all other markets in the spending report.
Housing Starts vs Residential Construction Spending
2-18-17
Housing Starts (# of units started as reported by U.S. Census) can be erratic from month to month and short term changes in growth can sometimes be misleading. Trends should be looked at over longer term periods. New monthly starts on a seasonally adjusted annual rate (SAAR) basis for the last eight months through January 2017 have now averaged over 1,200,000. For the last four months starts have averaged 1,250,000. Permits have been following a similar pattern. Although starts versus permits varies considerably in some months, statistically they follow the same growth pattern. Growth in the number of new starts has been 5% to 25% per year due to erratic movement but in the longer term has averaged 18%/yr over six years since January 2011. We experienced an un-sustained start to recovery in 2010, but essentially we went through a protracted bottom between 500,000 and 600,000 new starts that lasted all throughout 2009-2010.

Dodge Data reports SAAR new residential construction starts by contract value in current dollars (not inflation adjusted). Unadjusted growth for the same six-year period increased from $120 billion SAAR to over $300 billion SAAR, or at an annual rate of over 25%/year. However, there was 25% residential cost inflation during that period. In constant 2016$, Dodge new residential starts growth averages 20%/year for six years since January 2011.

Now let’s look at construction spending, actual dollar value of work put-in-place. Here’s where the data has a disconnect.
At the start of 2011, total residential spending had a monthly SAAR of $240 billion and at the end of 2016 was $470 billion, an increase of 16%/year for 6 years. To find real volume growth those values must be adjusted for inflation. After adjusting for inflation, the actual spending volume growth in 2016$ from 2011 through the end of 2016 increased from $305 billion to $465 billion, an increase of 52%, or an average increase of 9%/year for 6 years.

Furthermore, the number of residential construction jobs reported by BLS increased only 33% over that time, an average growth rate of less than 6%/year.

What could explain these differences?
The low rate of jobs growth compared to spending growth is partially explained by the fact that in the preceding few years, even though about 1.5 million jobs were lost, 40% of the workforce, staff was not reduced nearly at the same rate that residential construction volume declined (55%). There remained significantly more staff on payrolls than was needed to complete the amount of volume that was being built during the residential recession. When growth resumed, spending increased at a much faster rate than new jobs were added and the excess labor slack was reduced. I suspect also that a portion of the labor vs spending difference is explained by the fact that not all jobs are captured by BLS. It has been suggested that a large percentage of residential workforce in some southwestern states is undocumented.
The variance between starts and spending is a bit more complicated. We need to look at completions vs starts, the mix and size of housing units being built and the amount of spending related to renovations.
The most commonly reported housing statistic is housing starts. Also in that data series is housing completions. Housing completions are always lower than starts. For the last five years completions have averaged almost 15% less than starts. While the growth in starts averaged 18%/year, growth in completions from 2011 through 2016 averages less than 15%/year.
From 2011 to 2016 the average number of new single family (SF) units started increased from about 450,000 to 800,000. During that same period multi-family (MF) starts increased from 100,000 to 440,000. The percentage of MF units in total construction grew from 18% to 36% of total.
On average MF units are about half the size of SF units. Although the average size of SF homes increased about 10% during this period, the growth in the number of smaller MF units exceeded that of larger MF units by a factor of 2x. The ratio of smaller MF units doubled.
The share of MF units as a percent of all units doubled and the ratio of smaller vs larger MF units doubled. The total square feet of housing being built increased but did not grow at the same rate as the number of units. The average size of all units is getting smaller and therefore the constant cost per unit went down.
I suspect the increased ratio of smaller MF units and the percent increase of MF within the total number of all housing units has a big influence on the overall average cost per unit of total housing. That with the lower growth rate in completions helps explain why spending is not increasing at the same rate as overall number of housing unit starts. We are building more units per dollar spending because average unit size is smaller.
There is one more hidden factor to look at. That is, residential construction spending includes renovations. From 2009 through 2012 renovations totaled 45% of all residential spending. It began to decrease in 2013. For the last three years, renovation spending accounts for only 33% of all residential construction spending. Renovation spending has no comparable # of units or total square feet associated with it.

The impact this has, since the share of renovations spending is declining, is to increase the percent growth in residential spending attributable to housing units to greater than the 9% calculated above. Removing renovations work from total spending shows growth in real inflation adjusted spending specific to housing units averaged about 13%/year for 6 years.
Summarizing everything from above, since 2011:
On the surface it looks like this:
- Housing Starts # of units increased at 18%/year
- Residential new starts in unadjusted dollars increased 20%/year
- Residential construction spending increased 16%/year
After adjusting both units and spending we get:
- Inflation adjusted total residential spending increased 9%/year
- Inflation adjusted spending on units (excluding renovations) increased 13%/year
- Growth in the # of housing units completed increased 15%/year
- Share of Multifamily units has increased
- Average size of multifamily units has decreased
- Average size of all housing units being completed has grown smaller
- The growth in the number of units completed can exceed the growth in spending because the average constant value cost per unit has decreased
The growth in the number of housing unit starts is NOT an indicator to use for forecasting growth in residential construction spending or constant volume. Increases in the number of units alone will not give a realistic indication of growth in residential jobs or spending. The rate of growth in completions, combined with the ratio of the sizes of units, not just size of SF homes but average size of all SF and MF units, has a significant influence on the spending volume and can only be compared to inflation adjusted spending specific to units, that is, total spending minus renovations.
Housing Starts > Look a Little Deeper
October housing starts released Nov. 18th didn’t come in as expected. The annual rate for October is 1,060,000 new starts vs 1,191,000 in September and 1,079,000 in October last year. BUT look a little deeper than just one month.
The last 4 months of starts have been pretty high, averaging 14% higher than the previous 4 months and 16% higher than the same 4 months last year.
Take a look at this chart. Monthly starts periodically peak and dip erratically. Look at February 2015, the biggest dip in 5 years. But then notice it took less than 4 months for starts to come right back to the trend line and the trend remained intact. This is how the monthly housing starts data goes.
So don’t get too alarmed over one month of data. Now if this downward trend were to continue for several months, go ahead get concerned, but that hasn’t been the pattern.

Claryifying Housing Starts Numbers
This can be a confusing set of housing numbers and I thought needs some clarification. Doesn’t help any that I misquoted my housing statistics in Joe’s interview. Here’s the correct numbers.
Joe Weisenthal interviews me on Bloomberg TV
New Housing Starts (# new units started) from U S Census.
- 2012 & 2013 up 28% & 18%. 2014 up 8.4%. 2015 expected up 12.6% and 2016 predicted up 15%.
- 2012 added 172,000 new units to total 781,000 for the year
- 2013 added 144,000 new units to total 925,000
- 2014 added 78,000 new units to total 1,003,000
- 2015 expect 127,000 new units to total 1,130,000
- 2016 predict 170,000 new units to total 1,300,000
It’s worth noting here that we would need to go back to 1992 to see another year where the number of new units started in the year exceeded 170,000 units. In the 1970s and early 1980s when total housing units started in a year were near two million units, we see growth years of 400,000 to 600,000 new units in a year. After 1984, only three times have we reached new starts over 170,000 unis in a year, 2012 being one of those years. I anticipate we will reach that mark again in 2016.

New Residential Construction Starts $ from Dodge Data.
- 2012 & 2013 up 32% & 27%. 2014 up 10%. 2015 expected up 16% and 2016 predicted up 16%.
In the following chart of Dodge residential Starts $ we can see the dollar volume of new residential starts stalled from about Q2 2013 through Q4 2013 and then again in early 2014. That slowed spending.

Construction Spending
- 2012 & 2013 up 13% & 19%. 2014 up <1%. 2015 expected up 13% and 2016 predicted up 18%.
The 2014 drop in spending is influenced by starts that occurred in the later half of 2013 and through 2014. New units starts monthly were low from May to September 2013 and then again in the 1st quarter of 2014. In the Housing Starts chart above, Jan. 2014 starts 3mo move avg are about the same as Jan 2013, showing the slowed growth. The result is spending dropped from Q4 2013 to Q3 2014. Since then new starts have resumed fairly strong growth and spending for 2015 is expected to finish up 16%. See the period from Aug’14 through Apr’15 when spending increase by 20% in 8 months. I think we will continue with 2016 repeating the same growth, although not without some dips in the monthly readings.

Speaking to Joe’s point on when does this affect GDP, we can see in these charts that the actual spending gets spread out over time, such that any slow down, or in more recent data any acceleration, gets reflected later in the spending numbers, perhaps over the next 9 to 12 months for residential work. Up to the current quarter where we see a dip in new $ volume of starts, prior to that we recorded 6 consecutive quarters of growth in starts. After a flat year in 2014 we are poised to see residential construction spending contribute 13% growth & represent 36% of total construction spending in 2015. For 2016 I expect similar growth at a very substantial pace up to 18% growth.
Residential Construction – Not All Data Tells The Same Story
The latest New Housing Starts numbers were released today. Residential growth is looking good and based on several inputs, I’m predicting an increase in residential construction spending next year. But let’s take a look at the variance you might get when looking at different data sets.
All the data below represents residential construction growth for the period from January 2011 until current, the last 4 years 8 months
New Construction Starts in $ (by Dodge Data Analytics) +19%/yr
New Housing Starts (number of new housing units) +20%/yr
Total Construction Spending +12.5%/yr
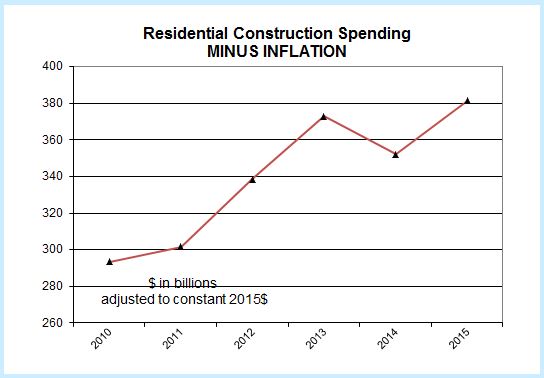
Volume (construction spending minus construction inflation) +7%/yr
The obvious first question is why don’t all the data agree? Without a lot more information on housing that cannot be answered here, but there are a few reasons that can be considered as cause for variation;
- the average size of housing units being built
- the quality of the components built into the housing units
- the cost to the contractor for the materials used
- the cost of labor wages to build the housing unit
I’m sure there are other reasons to consider as this is not intended to be a complete list of what might cause variances between starts and spending, but it does highlight that starts does not give an exact indication of the growth in spending. There is a fairly consistent growth rate in starts of 20%/year and yet construction spending in current dollars has been growing at only 12.5%/year. Furthermore, a sizable portion of that spending growth is just for inflation. After inflation is taken out we see real construction volume in constant 2015$ has been growing at only 7%/year.
I don’t have an answer to explain these variances. I’m highlighting the data to show these variances exist and we can’t always rely on one data set exclusively. Perhaps this will initiate a discussion as to why these data vary by so much.
