The latest New Housing Starts numbers were released today. Residential growth is looking good and based on several inputs, I’m predicting an increase in residential construction spending next year. But let’s take a look at the variance you might get when looking at different data sets.
All the data below represents residential construction growth for the period from January 2011 until current, the last 4 years 8 months
New Construction Starts in $ (by Dodge Data Analytics) +19%/yr

New Housing Starts (number of new housing units) +20%/yr

Total Construction Spending +12.5%/yr

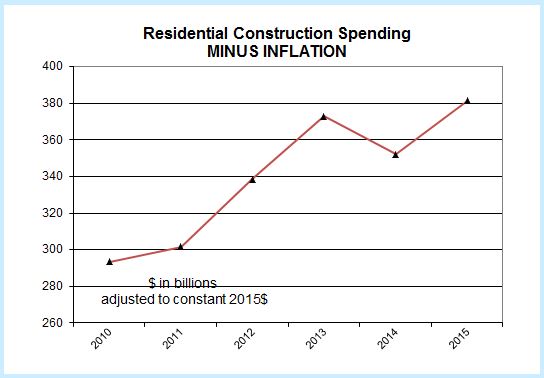
Volume (construction spending minus construction inflation) +7%/yr
The obvious first question is why don’t all the data agree? Without a lot more information on housing that cannot be answered here, but there are a few reasons that can be considered as cause for variation;
- the average size of housing units being built
- the quality of the components built into the housing units
- the cost to the contractor for the materials used
- the cost of labor wages to build the housing unit
I’m sure there are other reasons to consider as this is not intended to be a complete list of what might cause variances between starts and spending, but it does highlight that starts does not give an exact indication of the growth in spending. There is a fairly consistent growth rate in starts of 20%/year and yet construction spending in current dollars has been growing at only 12.5%/year. Furthermore, a sizable portion of that spending growth is just for inflation. After inflation is taken out we see real construction volume in constant 2015$ has been growing at only 7%/year.
I don’t have an answer to explain these variances. I’m highlighting the data to show these variances exist and we can’t always rely on one data set exclusively. Perhaps this will initiate a discussion as to why these data vary by so much.
