3/15/18
Preliminary data is in for total year 2017 construction spending, 2017 construction starts and 2018 starting backlog. The following forecast is developed using the current data.
2018 Construction Spending Forecast – Mar 2018
A brief note on 2017.
2017 Spending Wrap Up
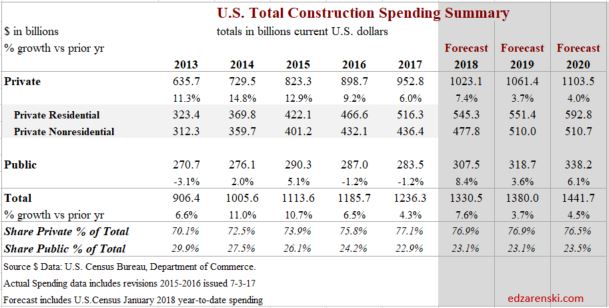
Total construction spending in 2017 now stands at $1.233 trillion, an increase of 4.0% over 2016.
Residential spending, up 10.5% for the fifth consecutive year above 10% growth, leads all construction spending in 2017 for the seventh consecutive year. Nonresidential Buildings finished the year up 2.3%. Only Non-building Infrastructure did not improve over 2016, down 3.8% for the year. However, Non-building Infrastructure had been at an all-time high for the previous two years.
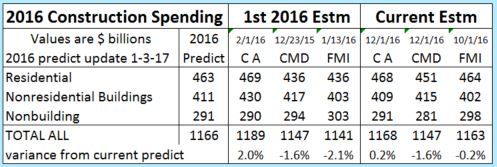
2017 spending finished below my forecast due to performance in Educational, Office, Power and Highway, four of the five largest markets which together make up half of all nonresidential spending. All came in lower than forecast. However, some of these markets are prone to very large post-annual upward revisions and that has the potential to add to 2017 spending when those revisions are released in July 2018. For instance, in the July 2017 revisions, Power spending for the previous year, 2016, was revised up by 10%.
History shows spending has been revised up 53 times in the last 60 months. I expect to see future revisions smooth out spending in unusually low periods and increase total 2017 spending above this forecast. Both April and July preliminary spending appear statistically too low. The average post-annual total spending revision for the last five years is +2.8%. The post-annual revision to 2016 was only 2.2%. Revisions due for release on July 1, 2018, if even only a +1% revision to 2017, would adjust total 2017 spending up to $1,245 billion. This would slightly alter the 2018 forecast.

2018 Spending Total All Construction
Total All 2018 construction spending is forecast to increase 7.6% to $1.330 trillion.
Nonresidential Buildings spending forecast for 2018, up 9%, will be supported by Manufacturing and Educational. Non-building Infrastructure returns to strong growth of 8%, with potential to hit a new all-time high due to very large projects in Power and Transportation. Residential spending in 2018 slows to growth under 6% after six years all over 10%/year.
Dodge Data 2017 construction starts increased 3% from 2016. However, starts are always revised upward in the following year. I expect revisions will show 2017 starts increased by more than 6% over 2016. Even with that revision, 2017 starts posted the lowest growth since 2011, weighted heavily by the slowdown in residential starts.
Total starting backlog for 2018, currently at an all-time high, has increased on average 10%/year the last three years. 80% of all Nonresidential spending within the year will be generated from projects in starting backlog. Public share of new construction starts are up only 10% in 3 years. But due to long duration job types, 2018 starting backlog is up 30% in the last 3 years.
None of this spending forecast includes any projections for potential work from future infrastructure stimulus.

Current$ vs Constant$
Construction spending reached a new current $ high in 2017 at $1,236 billion. The previous high in current $ was $1,161 in 2006. Spending first surpassed that in 2014 and has been increasing since. But that is in current $, which includes inflation.
Comparing current $ spending to previous year spending does not give any indication if business is increasing. The inflation factor is missing. If spending is increasing at 4%/year in a time when inflation is 6%/year, real volume is declining by 2%.
Although 2018 current $ spending will reach $1,330 billion, after adjusting for 4.5% to 5% inflation, 2018 constant $ volume will increase to only $1,270 billion. When comparing inflation adjusted constant dollars, 2018 spending will still be lower than all years from 1998 through 2007. In 2005 constant $ volume reached a peak at $1,450 billion. At current rates of growth, we would not eclipse the previous high before 2022.
While spending in current $ is 7% higher than the previous high spending, volume is still 14% lower than the previous high volume.
For more on Inflation Adjusted spending see Construction Spending is Back

Jobs and Volume
The period 2011-2017 shows both spending and jobs growth at or near record highs.
A spending forecast of 7%+ in 2018, or nearly $100 billion in construction spending, demands a few words on jobs growth. Construction requires about 5000 workers for every added $1 billion in construction volume. Construction jobs have never increased by 500,000 in one year. However, $100 billion in added spending is not the same as $100 billion in volume, and jobs growth is based on volume.
Although spending will increase 7%-8%, construction inflation has been hovering near 4.5% to 5% for the last five years. Real volume growth in 2018 after inflation is expected to be near 3% or $40 billion. That would mean the need, if there are no changes in productivity, is to add only about 200,000 additional workers in 2018, a rate of jobs growth that is well within reach. That is less than the average jobs growth for the last seven years.
Construction added 1,339,000 jobs in the last 5 years, an average of 268,000/year. The only time in history that exceeded jobs growth like that was the period 1993-99 with the highest 5-year growth ever of 1,483,000 jobs. That same 1993-99 period had the previous highest 5-year spending and volume growth going back to 1984-88.
Construction added 185,000 jobs in the last 4 months, Nov17-Feb18. That’s happened, for any 4-month period, only 5 times since 1984. The last time was 2005-06, during the fastest rate of spending increases since 1984.

Total all spending increased 55% since 2010, but there was 30% inflation. Real total volume since 2010 has increased by only 25%. Jobs increased by 30%, 5% in excess of volume growth. But the results are much different for Residential than Nonresidential.
Nonresidential spending increased 43% since 2010, but there was 30% inflation. Real nonresidential volume since 2010 has increased by only 12%. Jobs increased by 27%, 15% in excess of volume growth.
Residential spending increased by 110% since 2010, but after inflation, real residential volume increased by only 57%. Jobs increased by only 37%, 20% short of volume growth.
For more on Jobs see Construction Jobs and Residential Construction Jobs Shortages
Residential Buildings Spending
Total Residential spending in 2017 finished at $523 billion, up 10.6% from 2016. This is the 5th consecutive year that residential spending exceeded 10% annual growth. Average spending growth the last six years is 13%/year.
Residential spending in 2017 was 50% single family, 13% multi-family and 37% improvements. In 2011, improvements was 48% of residential spending.
Census does not include flood damage repairs (house shell remains intact but gut renovate) in improvements but does include full flood damaged structure replacements (structure rebuild permit classified as new) in improvements.
Residential spending is more dependent on new starts within the most recent 12 months than on backlog from previous starts. Total starts for the last 6 months are the highest since 2006, but % growth has slowed considerably. New starts in 2017 posted only 2% growth, but I expect that to be revised up to at least 4%. Similar growth of 6%-7% is expected for 2018. Slower growth is now expected after 5 years (2012-2016) of new starts increasing at an average 20%/year.

Residential 2018 spending growth is forecast to increase only 6% after five years over 10%. Total residential spending in 2018 is forecast at $552 billion.
Residential spending will reach a 12-year high in 2018. Residential spending reached its current $ peak of $630 billion in 2005. Current 2018 pending is still 13% below that peak. In constant $, adjusted for inflation, all years from 1998 through 2007 were higher than 2018. In constant $, 2018 spending is still 27% below the 2005 peak.
Residential buildings construction spending in constant $ reached $523 billion in 2017. Previous spending adjusted to equivalent 2017$ shows that all years from 1996 through 2007 had higher volume than 2017. Volume reached a peak $748 billion in 2005. Only the years 2004-2006 had higher spending in current $. The 2005 current $ peak of $630 billion is still 17% higher than 2017, but 2017 volume is still 30% lower than peak volume.

Nonresidential Buildings Spending
Nonresidential Buildings spending in 2017 finished at $419 billion, up only 2.7% from 2016.
2017 spending finished below my forecast due to performance in Educational and Office. Educational starts increased 6%+/year for the last three years, but spending increased only 4%/year the last two years. Office starts increased nearly 30% in 2016, but spending increased only 3% in 2017. I suspect either big upward revisions to 2017 spending or large increases in backlog will boost 2018 spending in these two markets.

Nonresidential Buildings new starts are up 60% in four years. 2018 starting backlog is the highest ever, up 15% from 2017. Nonresidential Buildings 2018 starting backlog is 50% higher than at the start of 2014, the beginning of the current growth cycle.

Starting backlog has increased for five years at an average 10%/year. Spending from starting backlog, up 10% in 2018, increased for five years at an average 9%/year.
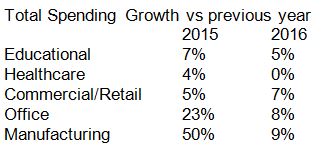
For 2018, Educational spending is projected to increase 14%, the best increase since 2007. Starting backlog increased 10%/year for the last three years. Manufacturing posted several very large project starts in 2017. Spending is projected to increase 12% in 2018.
Nonresidential Buildings spending in 2018 is forecast to reach a new high, $459 billion, an increase of 9.5% over 2017, surpassing the previous 2008 high. Educational and Manufacturing make up 55% of the growth.
For the Full Expanded 2018 Construction Spending Forecast – Nonresidential Bldgs
Nonresidential buildings construction spending in constant $ (inflation adjusted $) reached $419 billion in 2017. In 2018 it will reach $439 billion. Constant $ spending shows all years from 1996 through 2010 had higher volume than the 2018 forecast. Volume reached a peak $536 billion in 2000 and went over $500 billion again in 2008. In constant $ 2018 is still 18% below that 2000 peak.

Non-building Infrastructure Spending
Total non-building infrastructure spending in 2017 dropped to $293 billion, down 3.7% from 2016.
Non-building Infrastructure spending, always the most volatile sector, dropped to yearly lows from June through September, the lowest since November 2014. However, this short dip was predicted. Cash flow models of Infrastructure starts from the last several years predicted that dips in monthly spending would be caused by uneven project closeouts from projects that started several years ago, particularly in Power and Highway markets.

Current backlog is at an all-time high and spending is expected to follow the increased cash flows from the elevated backlog. Environmental Public Works (Sewage/Waste disposal down 14%, Water Supply down 9% and Conservation/Dams & Rivers down 7% in 2017) posted the largest declines in 2017 and accentuated the declines in the infrastructure sector. The sector was expected to increase in the last quarter 2017. All three markets posted increases in the 4th quarter, up 8% over the 1st nine months of 2017.
Non-building Infrastructure 2018 starting backlog is the highest ever, up 10%+ each of the last 3 years. Transportation terminals new starts in 2017 jumped 120%. Rail project starts increased more than 100%. Starting backlog for all transportation work is the highest ever, up 100% in the last two years. Transportation spending is projected to increase 20-25%/year for the next two years.
No future growth is included from infrastructure stimulus and yet 2018 spending is projected to increase by 8%.

Non-building Infrastructure will reach a new high for spending in 2018. Spending reached an all-time high in 2015 and stayed within 0.3% of that high for 2016. A 3.5% decline in 2017 was more of a decline than expected, but there may still be upward revisions to the preliminary total.
Non-building Infrastructure spending in 2018 is forecast to reach $319 billion, an increase of 8.6% over 2017.
My forecast for 2018 is predicting every infrastructure market will post gains, but it is the Power and Transportation markets that account for most of the growth in 2018. Transportation new starts in 2017 grew 120% due to massive new air terminal and rail projects. Spending growth in the Power market is not quite so apparent. Combined Power new starts are down for both 2016 and 2017, but the spending gains are coming from projects that started in 2015, a year in which starts were up over 120%.
Adjusted for inflation, spending in 2018 will be nearly equal to the all-time highs reached in 2015 and 2016.
Non-building Infrastructure construction spending in constant $ reached $294 billion in 2017. Recent highs were posted in 2015 and 2016 at $305 billion and $304 billion and 2018 is expected to reach $319 billion. Previous spending adjusted to equivalent 2017$ shows that 2008 and 2009 were both just slightly higher than $300 billion. Constant $ volume reached a peak $313 billion in 2016. Spending in current $ hit new highs in 2015 and 2016. This is the only sector that has current $ and constant $ at or near all-time highs.

Public Infrastructure and Public Institutional
Only 60% of all Non-building Infrastructure spending, about $170 billion, is publicly funded. That public subset of work averages growth of less than $10 billion/year.
Only about 25% of all Nonresidential Buildings spending, about $100 billion, is publicly funded, mostly Educational.
- Infrastructure = $300 billion, 25% of all construction spending.
- Infrastructure is about 60% public, 40% private. In 2005 it was 70% public.
- Public Infrastructure = $170 billion. Private Infrastructure = $130 billion.
- Power and Communications are privately funded infrastructure.
- Nonresidential Buildings is 25% public (mostly institutional), 75% private.
- Educational, Healthcare and Public Safety are Public Nonres Institutional Bldgs
- Public Commercial construction is not included.
- Public Institutional = $100 billion, mostly Education ($70b).

Public Infrastructure + Public Institutional = $270 billion, 23% of total construction spending.
Public Infrastructure + Institutional average growth is $12 billion/year. It has never exceeded $30 billion in growth in a single year.
See also Publicly Funded Construction
See also Down the Infrastructure Rabbit Hole

Public Spending
Public construction is a subset of Nonresidential Buildings and Non-building Infrastructure and about 1% of Residential.
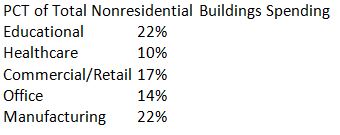
The two largest markets contributing to public spending are Highway/Bridge (32% of total public spending) and Educational (26%), together accounting for nearly 60% of all public construction spending. At #3, Transportation is only about 10% of public spending. Environmental Public Works combined makes up almost 15% of public spending, but that consists of three markets, Sewage/Waste Water, Water Supply and Conservation. Office, Healthcare, Public Safety and Amusement/Recreation each account for about 3%.
2017 spending was down 1%, but has been at or near the all time high for three years.
Total public spending for 2017 finished flat at $284 billion with most major public markets down for the year. By far, the largest Public spending declines in 2017 are Sewer and Waste Disposal which is 7% of public markets, it was down 16% and Highway/Bridge, down only 3.5%, but Highway is 32% of all public spending.
Public spending hit a low in June 2017. It has been increasing since then, Public Educational, in the second half 2017 up 10% from the low point, now at a post recession high. We can expect to see another six months of growth before spending levels off in mid-2018.
Due to long duration job types, 2018 starting backlog is up 30% in the last 3 years. In 2018, 40% of all spending comes from jobs that started before 2017. Leading 2018 growth are Educational (+15%) and Transportation (+35%), with a combined total forecast 20% growth in public spending.
Current levels of backlog and predicted new starts gives a projection that Public Non-building Infrastructure spending will reach an all-time high in 2018 and again in 2019.
Total Public spending in 2018 is forecast to reach $307 billion, an increase of 8% over 2017, the best growth in 10 years.
Educational and Transportation will contribute equally and together account for almost 60% of the Public spending growth in 2018. Transportation new starts in 2017 grew 120% due to massive new air terminal and rail projects. Educational new starts total for the last three months posted the highest quarter in at least seven years. The 2nd highest quarter was also within the last 12 months, so still contributes fully to 2018 spending. 2018 signifies a turn-round in Public spending which has not posted significant growth since the recession.

Public spending is 10%, $30 billion, below 2009 all-time highs, most of the deficit coming from declines in Educational, Sewage/Waste Water and Water Supply. In 2018, Highway and Transportation are at all-time highs.
Click here for a formatted printable PDF Construction Spending Forecast – Summary Mar 2018
See these posts for additional info
2018 Construction Spending Forecast – Nonresidential Bldgs
Starts Trends Construction 2018 Forecast – Fall 2017 11-8-17
Backlog Construction 2018 Forecast – Fall 2017 11-10-17
For more on Jobs see Construction Jobs / Workload Balance 11-7-17
For effects of inflation see Constant Dollar Construction Growth 11-2-17
Construction Activity Notes 4-25-18
Notes on March 2018 Construction Spending