Read my last few blogs and all of this is detailed, but this is worth a look.
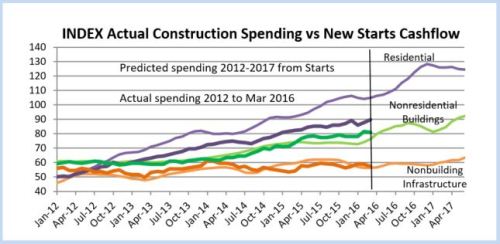
Dodge Data Construction Starts cash flowed shows a predicted spending pattern.
Actual spending is shown to compare to the prediction.
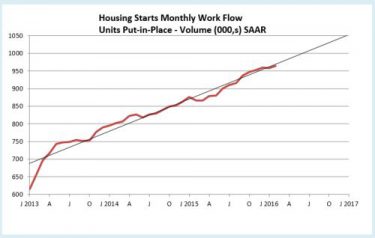
For another residential input we have new housing starts. Here I’ve spread activity out from start to completion like a cash flow to get monthly activity. History compares to actual spending and future compares to Dodge New Starts cash flow.
The time flow of activity generated by housing starts is much more important than the monthly starts themselves. It prompts us to look at a much longer term trend of housing starts than just whether they have moved up of down in the last month or quarter.
Modeling for nonresidential buildings and non-building infrastructure appears more accurate than residential. It looks like my prediction of cash flow from Dodge residential starts needs to move 2-4 months to the left.
5-4-16 The cash flow plot for residential has been revised to use a different duration for SF vs MF vs Reno.