5-2-16 March construction spending was released today. Spending is UP 9.1% year-to-date vs 2015 http://www.census.gov/construction/c30/pdf/release.pdf
Year-to-date gains are led by nonresidential buildings up 11.3%, followed by non-building infrastructure up 8.6% and residential up 7.5%.
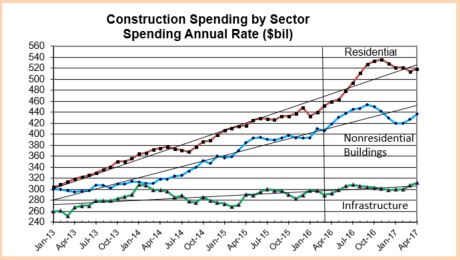
This plot, Construction Spending By Sector, shows actual spending (SAAR) through March 2016 and projected spending to April 2017.
The biggest percentage growth year-to-date gain is multifamily housing ,up +31%, although Residential combined is up only 7.5%. Other growth, Lodging +30%, Office +22% and Highway +21%.
- Residential year-to-date spending:
- $ volume changes; SF +11.2%, MF +31%, Reno -7.3%.
- Market share; SF 55%, MF 16%, Reno 29%.
The biggest $ volume gain through March is Residential +$6.4b, which includes a decline in renovation work. Single Family is up +$5.0b and Multifamily is up +$3.4B. Office +$2.6b, Highway +$2.5b and Educational +$2.1b. Although lodging is up 30%, its market share is small and its $ volume is up only $1.3b.
Residential spending has completely recovered from a 4% decline in January. Projected growth of 20% from now through the 4th quarter will help residential spending reach a total 15% growth for 2016.
Nonresidential buildings spending climbed 4% in the last two months from the stalled range that remained nearly flat from May 2015 through January 2016. Growth may peak this year in the 3rd quarter before dropping into year end, but may still reach a total 12% growth for 2016.
Infrastructure spending has meandered along the $300 billion mark since last May and is expected to stay there through 2016. Expect only slight growth of 4% in infrastructure spending in 2016, contributed mostly by Highway and Street.
All sectors may experience a decline in spending before year end, but all are expected to return to growth leading into 2017.
Total construction spending in 2016 should reach $1.220 trillion, up 11% from 2015. 2014 through 2016 will be the strongest 3-year growth on record in both percentage gain (+34%) and $ volume gain (+$314 billion). Only 2003-04-05 comes close.
Later, a comparison of inflation adjusted (constant) dollars. The results will be different. I’m estimating particularly high rates of inflation, so inflation reduces the gain in real constant volume from the spending projections by a lot in 2016.
