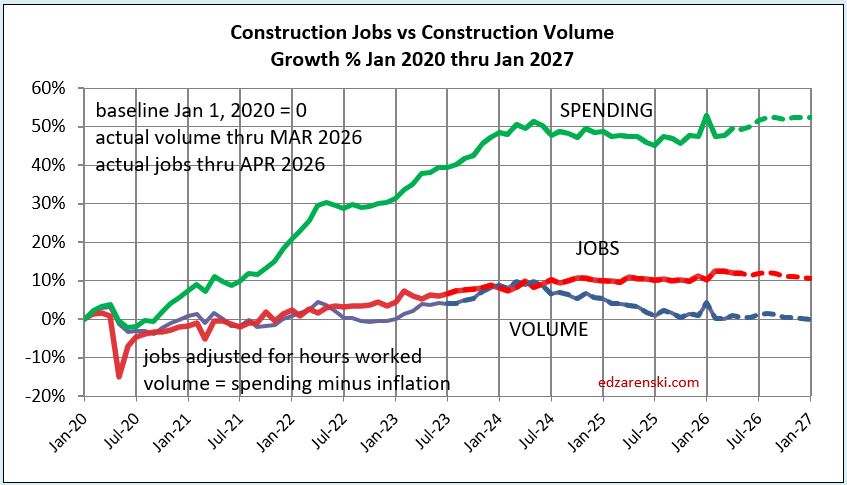
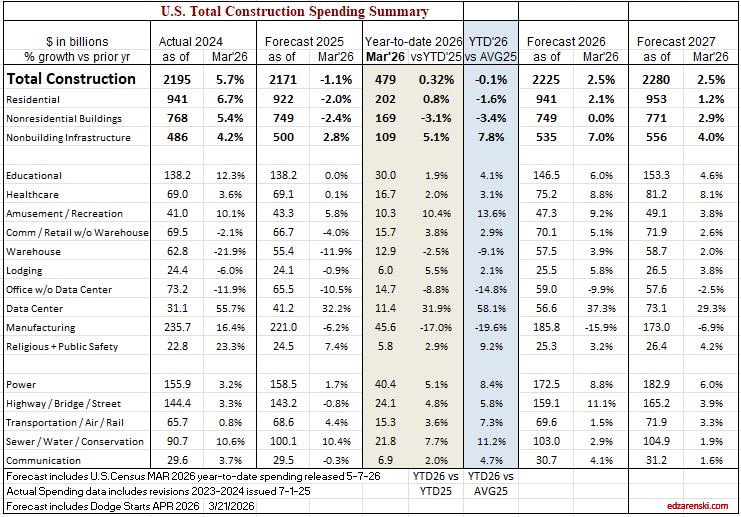
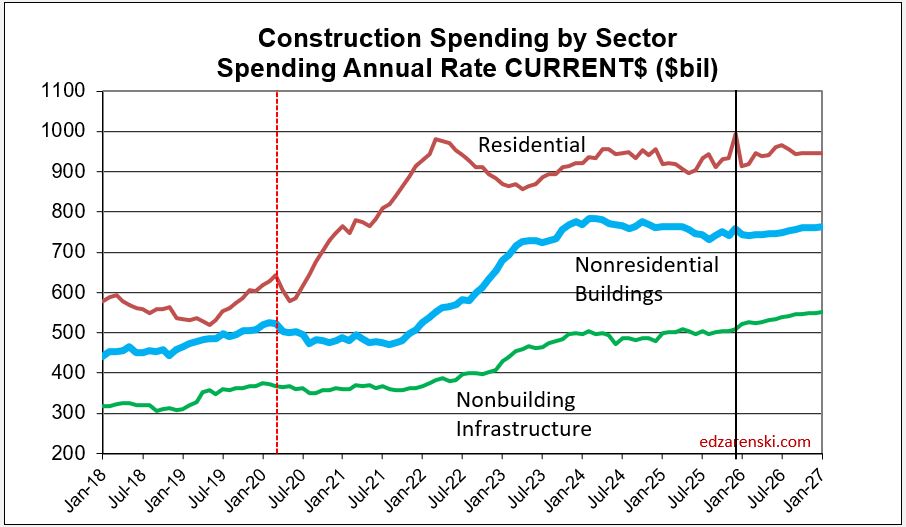
Construction Spending is now in for Jan, Feb and Mar. Spending is up 0.3% year-to-date (YTD) from 2025, but still 0.1% below the annual average 2025. The revised forecast for 2026 total construction spending is $2.225 trillion, expected to finish up 2.5% from 2025.
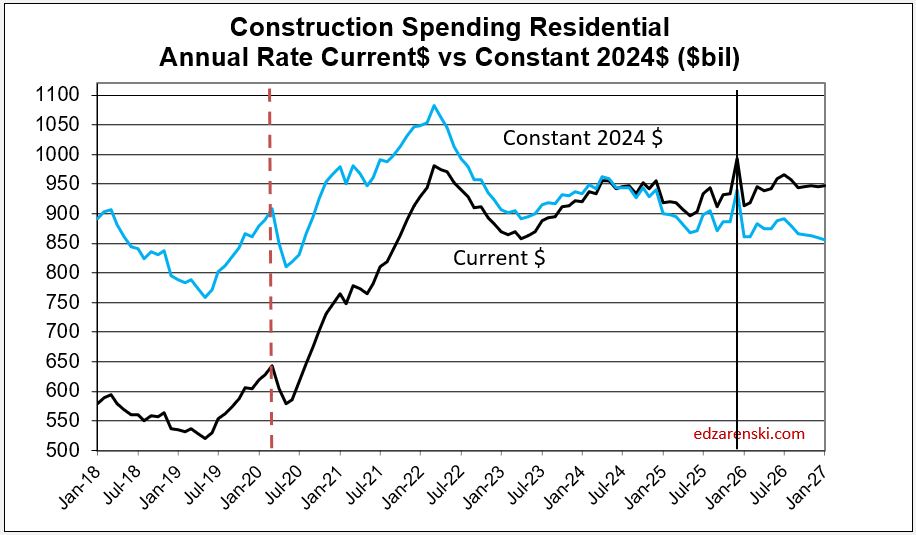
Forecast spending has increased slightly, almost entirely due to a March increase 3% above forecast for Single Family Residential. Residential renovations also added a sizable increase in March. Overall residential spending YTD thru March is 0.8% above Jan-Mar 2025, but it is still 1.6% below the annual average in 2025. The 2nd half of 2025 was much stronger than the 1st half, raising the 2025 average. Residential spending in 2026 is stronger midyear and is forecast to finish up 2.1% from 2025. However, after inflation, that is still a decline of 2%.
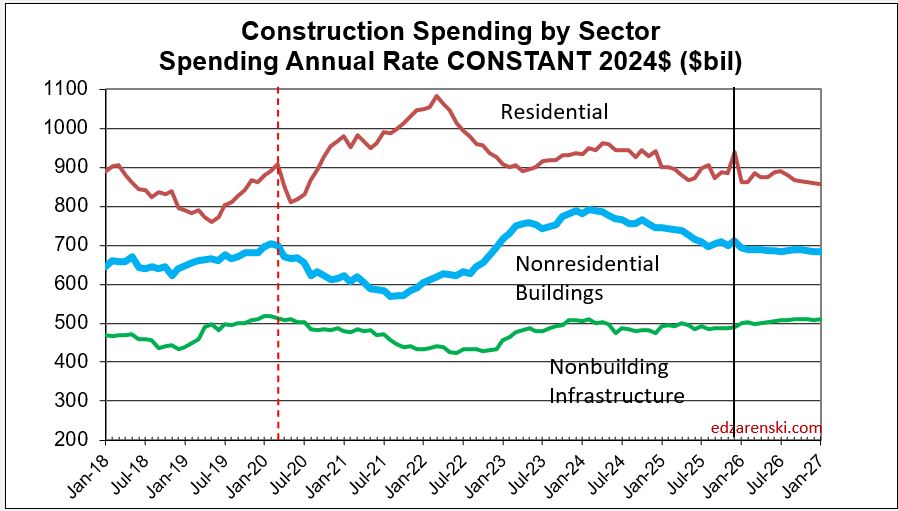
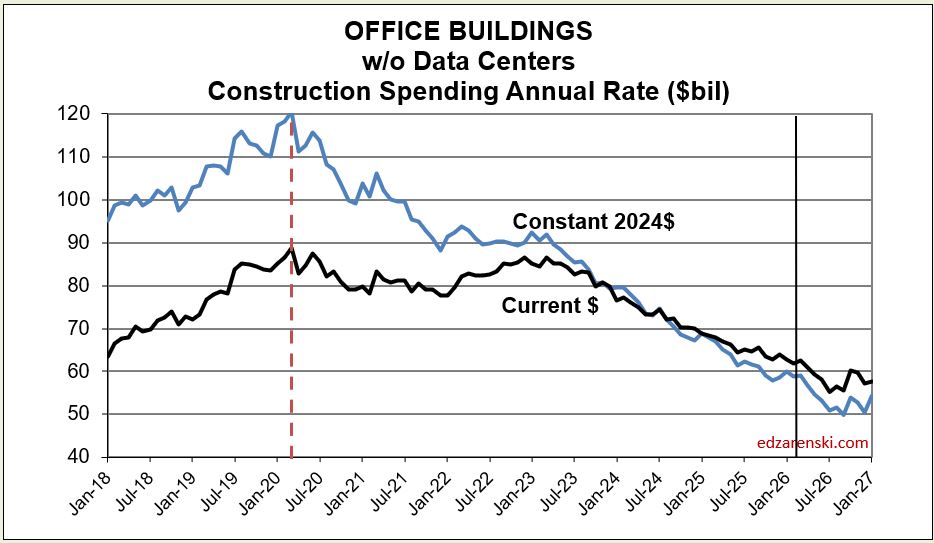
Nonresidential Bldgs spending is down 3.1% YTD from 2025 and down 3.4% from the annual average 2025. But spending improves throughout 2026 and is expected to wipe away any deficit and finish 2026 just equal to 2025. Keep in mind, with 4% inflation, that means real nonres bldgs construction volume declines in 2026, for the 2nd consecutive year. In fact, real nonres bldgs volume is currently down 10% from 2024.
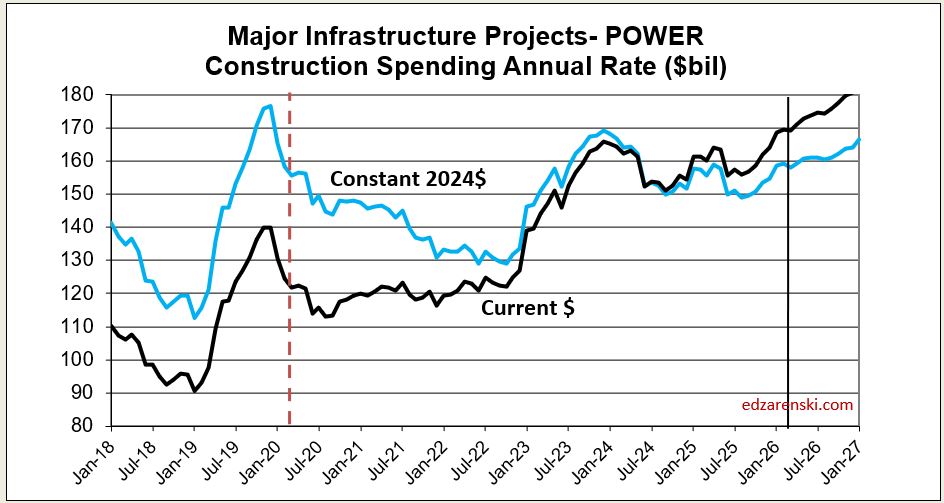
Non-building Infrastructure spending is currently up 5% YTD and is forecast to finish 2026 up 7% from 2025. Strong gains in Power and Highway carry infrastructure to a positive forecast.
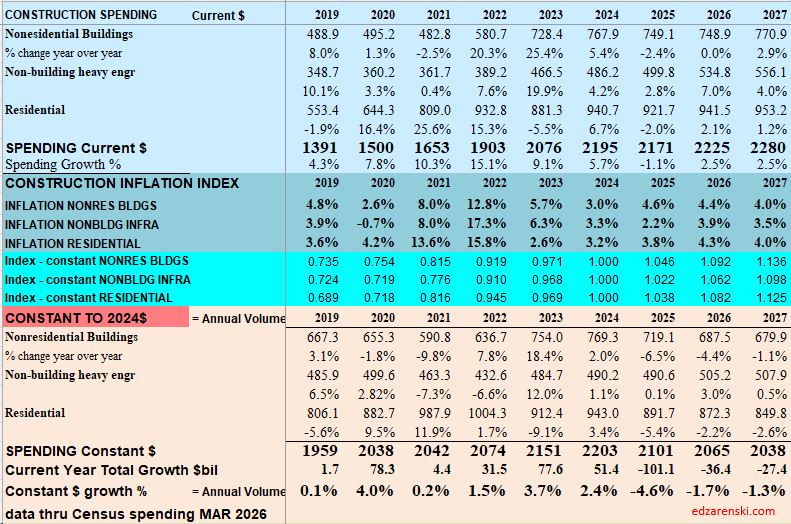
Notice in the table below, I carry inflation at about 4% in 2026. Actual inflation values are all final cost and are a composite of eight different sources, so the inflation carried in these reports will never be the highest or lowest. Predicted inflation reverts to historical averages with some influence of current conditions.
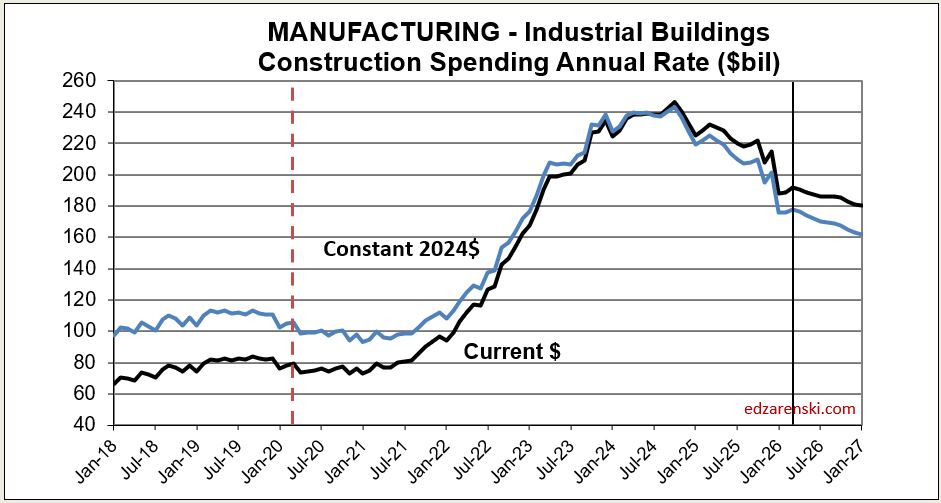
Taking 4% out of all the spending numbers above gives the Constant$ results or actual volume of business conducted. For 2025 business volume declined 4.6%. For 2026 it’s expected to decline about 1.7%. Only Non-bldg Infrastructure has posted real volume of business gains in 2025 and 2026. Spending is up, but volume of business is down.
Constant $ for all tables and plots in this report is inflation adjusted to mid 2024.
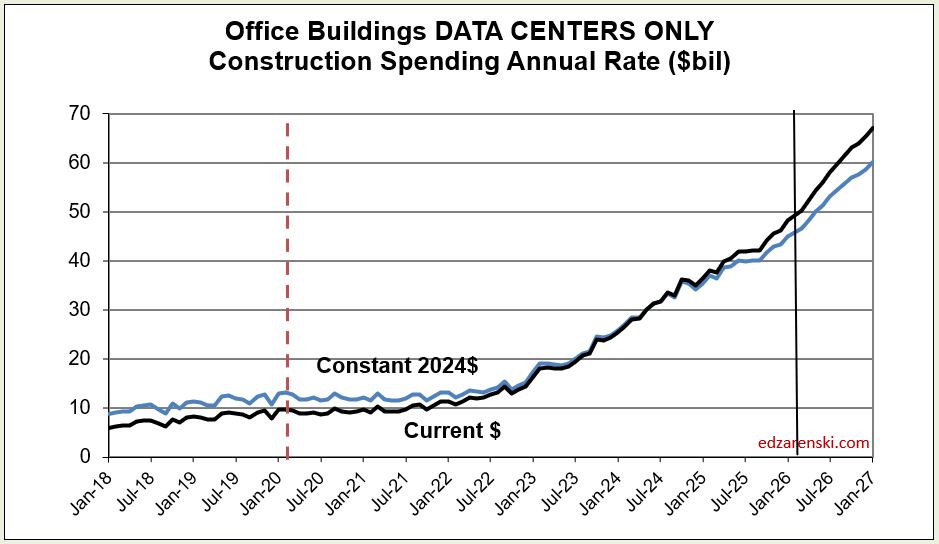
The rate of growth in construction spending for Data Centers averaged 3%+/mo for 36 months. Then for the last 6mo of 2025 it dropped back to <2%/mo. For 1st 3mo of 2026 it’s avg 2.8%/mo. Forecast avg for 2026 is 2.9%/mo.
As of March, DC spending is up 9% since Dec, up 22% from the Avg 2025.
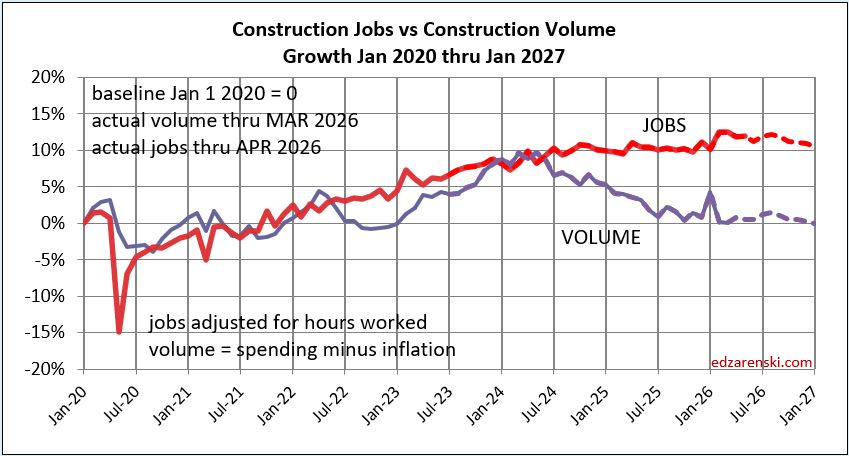
Construction Spending for Jan, Feb and Mar is up 0.3% year-to-date (YTD) from 2025. After adjusting for inflation Constant$ volume is down 1% for the 1st 3 months 2026 vs 2025. Jobs thru April are up 1.5% YTD from 2025.
Although there may be a couple months in 2026 when construction jobs do increase, we should not expect overall construction jobs growth in 2026. We are in the 2nd yr of a constant$ volume decline. If jobs do increase, (jobs up-volume down) we are experiencing a productivity decline.
This plot shows the last time jobs and volume were in sync was Q2-2024.