Home » Posts tagged 'escalation'
Tag Archives: escalation

Construction Inflation 2020
1-28-20 This original post, Inflation excerpt from the complete economic report – Construction Analytics 2020 Construction Economic Forecast – Jan 2020
SEE Construction Inflation 2023
8-25-20 See also Pandemic #14 – Impact on Construction Inflation
1-27-21 See 2021 Construction Inflation
Click Here for Link to a 20-year Table of 25 Indices
Construction Inflation
The level of construction activity has a direct influence on labor and material demand and margins and therefore on construction inflation.
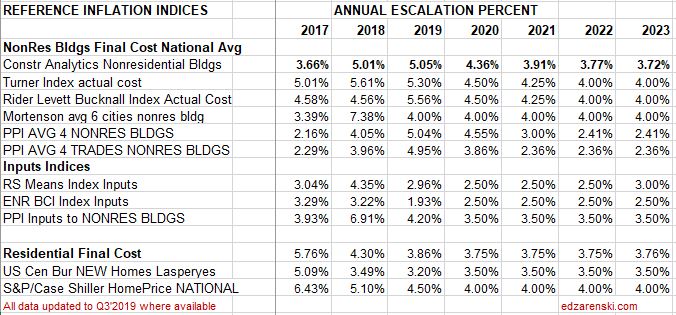
Nonresidential buildings inflation, after hitting 5% in both 2018 and 2019, is forecast for the next three years to fall from 4.4% to 3.8%, lower than the 4.5% average for the last 4 years.
Residential construction inflation in 2019 was only 3.6%. However, the average inflation for six years from 2013 to 2018 was 5.5%. It peaked at 8% in 2013 but dropped to 4.3% in 2018 and only 3.6% in 2019. Forecast residential inflation for the next three years is level at 3.8%.
Nonresidential Buildings and Non-building Infrastructure backlog are both at all-time highs. 75% to 80% of all nonresidential spending within the year comes from starting backlog. Most spending for residential comes from new starts in the year.
2020 starting backlog is up 5.5% across all sectors. However, while a few markets will outperform in 2020 (transportation, public works, office), predicted cash flow (spending) from backlog is up only 1% to 2%. Long duration projects added to backlog and will spread spending out over the next few years.
Residential new construction starts in 2019 (number of units started) gained 4% over 2018. In 2018, starts dropped every quarter after Q1, but then increased every quarter in 2019 and closed out the 2nd half of 2019 at 9% higher than the average of the previous six quarters. New starts measured in dollars dropped slightly in 2019. Spending from new starts fell 5% in 2019 but is forecast up 6% for 2020. Residential construction volume (spending after inflation) in 2019 dropped 8%, the largest volume decline in 10 years. Volume in 2019 dropped to a 4-year low. A volume gain of 2% in 2020 leaves residential still at a 4-year low.
General construction cost indices and Input price indices that don’t track whole building final cost do not capture the full cost of inflation on construction projects.
To differentiate between Revenue and Volume you must use actual final cost indices, otherwise known as selling price indices, to properly adjust the cost of construction over time.
Selling Price is whole building actual final cost. Selling price indices track the final cost of construction, which includes, in addition to costs of labor and materials and sales/use taxes, general contractor and sub-contractor margins or overhead and profit.
Consumer Price Index (CPI), tracks changes in the prices paid by consumers for a representative basket of goods and services, including food, transportation, medical care, apparel, recreation, housing. This index in not related at all to construction and should not be used to adjust construction pricing.
Producer Price Index (PPI) for Construction Inputs is an example of a commonly referenced construction cost index that does not represent whole building costs. Engineering News Record Building Cost Index (ENRBCI) and RSMeans Cost Index are examples of commonly used indices that do not capture whole building cost.
Producer Price Index (PPI) Material Inputs (which excludes labor and margins) to new construction increased +4% in 2018 after a downward trend from +5% in 2011 led to decreased cost of -3% in 2015, the only negative cost for inputs in the past 20 years. Input costs to nonresidential structures in 2017+2018 average +4.3%, the highest in seven years. Infrastructure and industrial inputs were the highest, near 5%. But input costs for 2019 are coming in at less than +1%. Material inputs accounts for only a portion of the final cost of constructed buildings.
Materials price input costs in 2019 slowed to an annual rate of less than 1%.
Labor input is currently experiencing cost increases. The National construction unemployment rate was recently posted below 4%, the lowest on record with data back to 2000. The average has been below 5% for the last 18 months. During the previous expansion it hit a low average of 5%. During the recession it went as high as 25%. An unemployment rate this low signifies a tight labor market. This may cause contractors to pay premiums over and above normal wage increases to keep valued workers from leaving. Some premiums accelerate labor cost inflation but are not recorded in published wage data, so aren’t easily tracked. Lack of experienced workers and premiums to keep labor drive labor cost increases higher than wage growth.
Although many contractors report shortages due to labor demand, labor growth may slow due to a forecast 2019-2020 construction volume decline. We might see a jobs decline lag spending/volume decline.
When construction activity is increasing, total construction costs typically increase more rapidly than the net cost of labor and materials. In active markets overhead and profit margins increase in response to increased demand. These costs are captured only in Selling Price, or final cost indices.
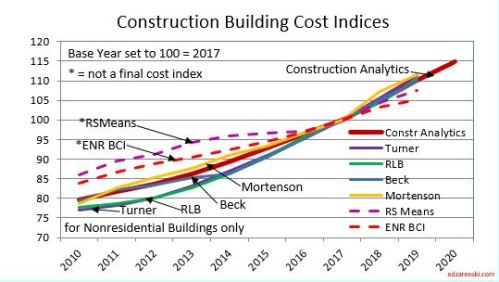
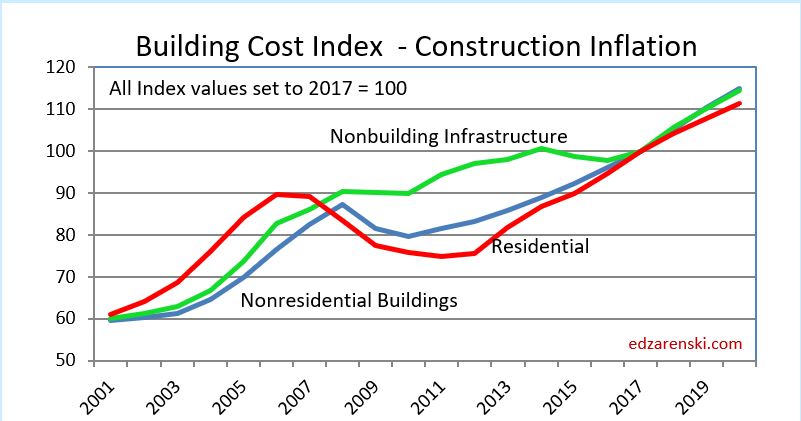
Construction Analytics Building Cost Index, Turner Building Cost Index, Rider Levett Bucknall Cost Index and Mortenson Cost Index are all examples of whole building cost indices that measure final selling price (for nonresidential buildings only). The average annual growth for all these indices over the past five years is 4.7%/year. For the last two years, average nonresidential buildings inflation is 5.3%.
- Long-term construction cost inflation is normally about double consumer price index (CPI).
- Average long-term nonresidential buildings inflation excluding recession years is 4.2%.
- Average long-term (30 years) nonresidential construction cost inflation is 3.5% even with any/all recession years included.
- In times of rapid construction spending growth, nonresidential construction annual inflation averages about 8%. Residential has gone as high as 10%.
- Nonresidential buildings inflation has average 3.7% since the Great Recession bottom in 2011. It has averaged 4.2% for the last 4 years.
- Residential buildings inflation reached a post-recession high of 8.0% in 2013 but dropped to 3.4% in 2015. It has averaged 5.8% for the last 5 years.
- Although inflation is affected by labor and material costs, a large part of the change in inflation is due to change in contractors/supplier margins.
- When construction volume increases rapidly, margins increase rapidly.
- Construction inflation can be very different from one major sector to the other and can vary from one market to another. It can even vary considerably from one material to another.
Residential construction inflation in 2019 was only 3.6%. However, the average inflation for six years from 2013 to 2018 was 5.5%. It peaked at 8% in 2013 but dropped to 4.3% in 2018 and only 3.6% in 2019. Residential construction volume in 2019 dropped 8%, the largest volume decline in 10 years. Typically, large declines in volume are accompanied by declines in inflation. Forecast residential inflation for the next three years is level at 3.8%.
A word about Hi-Rise Residential. Probably all of the core and shell and a large percent of interiors cost of a hi-rise residential building would remain the same whether the building was for residential or nonresidential use. This type of construction is totally dis-similar to low-rise residential, which in large part is stick-built single family homes. Therefore, use the residential cost index for single family but a more appropriate index to use for hi-rise residential construction is the nonresidential buildings cost index.
Nonresidential inflation, after hitting 5% in both 2018 and 2019, is forecast for the next three years to fall from 4.4% to 3.8%, lower than the 4.5% average for the last 4 years. Spending needs to grow at a minimum of 4.4%/yr. just to stay ahead of construction inflation, otherwise volume is declining. Spending slowed dramatically in 2019. However, new starts in 2018 and 2019 boosted backlog and 2020 spending will post the strongest gains in four years.
Several Nonresidential Buildings Final Cost Indices averaged over 5% per year for the last 2 years and over 4% per year for the last 5 years. Nonresidential buildings inflation totaled 22% in the last five years. Input indices that do not track whole building cost would indicate inflation for those five years at only 12%, much less than real final cost growth. For a $100 million project escalated over those five years, that’s a difference of $10 million, potentially underestimating cost.
Notice in this next plot how index growth is much less for ENR BCI and RSMeans, both input indices, than for all other selling price final cost indices. From 2010 to 2019, total final price inflation is 110/80 = 1.38 = +38%. Input cost indices total only 106/85 = 1.25 = +25%, missing a big portion of the cost growth over time.
Nonresidential Buildings Selling Price Indices vs Input Indices
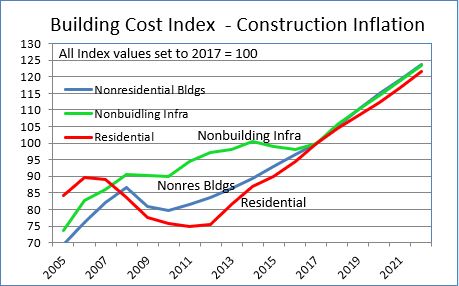
Non-building infrastructure indices are so unique to the type of work that individual specific infrastructure indices must be used to adjust cost of work. The FHWA highway index increased 17% from 2010 to 2014, stayed flat from 2015-2017, then increased 15% in 2018-2019. The IHS Pipeline and LNG indices increased 4% in 2019 but are still down 18% since 2014. Coal, gas, and wind power generation indices have gone up only 5% total since 2014. Refineries and petrochemical facilities dropped 10% from 2014 to 2016 but regained all of that by 2019. BurRec inflation for pumping plants and pipelines has averaged 2.5%/yr since 2011 and 3%/yr the last 3 years.
Anticipate 3% to 4% inflation for 2020 with the potential to go higher in specific Infrastructure markets, such as pipeline or highway. This link refers to Infrastructure Indices.
Construction Analytics Building Cost Index
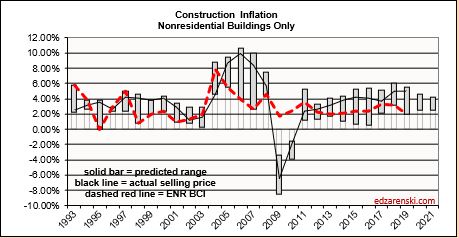
In the following plot, Construction Analytics Building Cost Index annual percent change for nonresidential buildings is plotted as a line against a bar chart of the range of all other nonresidential building inflation indices. Bars represent the predicted range of inflation from various sources with the solid line showing the composite final cost inflation. Note that although 2015 and 2016 have a low end of predicted inflation of less than 1%, the actual inflation is following a pattern of growth above 4%. The low end of the predicted range is almost always established by input costs (ENR BCI is plotted), while the upper end of the range and the actual cost are established by selling price indices.
Construction Analytics Nonresidential Buildings Cost Index
vs Range of Input Indices
As noted above, some reliable nonresidential selling price indexes have been over 4% since 2014. Currently most selling price indices are over 5% inflation since 2018.
Every index as published has its own base year = 100, generally the year the index was first created, and they all vary. All indices here are converted to the same base year, 2017 = 100, for ease of comparison. No data is changed from the original published indices.

Non-building Infrastructure indices are far more market specific than any other type of index. Link here to Reference specific Infrastructure indices rather than an average.
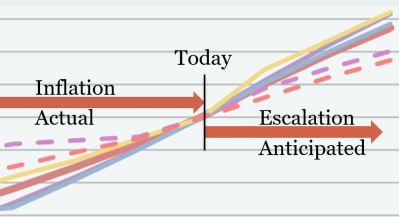
A word about terminology: Inflation vs Escalation. These two words, Inflation and Escalation, both refer to the change in cost over time. However escalation is the term most often used in a construction cost estimate to represent anticipated future change, while more often the record of past cost changes is referred to as inflation. Keep it simple in discussions. No need to argue over the terminology, although this graphic might represent how most owners and estimators reference these two terms.
This link points to comprehensive coverage of the topic inflation and is recommended reading. Click Here for Link to a 20-year Table of 25 Indices

Inflation and Forecasting Presentation Advancing Precon & Estm Conf 5-22-19
This is a PDF of slides (including notes) from my
Construction Inflation & Forecasting Presentation
at Hanson Wade
Advancing Preconstruction & Estimating Conference
Dallas, TX 5-22-19
Advancing Pre-construction & Estimating conference 2019
Full EdZ Presentation Inflation-Forecasting w notes HW-APE 5-22-19 PDF

Construction Economic Activity Notes 4-25-18
4-25-18
Brief notes on spending, starts, backlog, jobs and inflation from March and April tweets.
Nonresidential construction spending is not decelerating in 2018. Will see best growth since 14% in 2015.
Residential construction spending is slowing to +7% growth in 2018, after 6 consecutive years of strong growth averaging 13%/year.
Non-building Infrastructure forecast growth of 8% in 2018, potential to hit a new all-time high due to very large projects in Power and Transportation.
Public construction spending in 2018 is forecast to reach $307 billion, an increase of 8% over 2017, the best growth in 10 years. Educational and Transportation will contribute equally and together account for more than half of the Public spending growth in 2018.
In Oct 2016 and again in Feb 2017, I forecast Manufacturing spending would fall 13% in 2017 after hitting peak spending in 2015 from massive growth in new starts in 2014. At that time, the AIA consensus forecast (average of seven analysts) was that spending would increase +0.4%. By July the consensus had been revised to average -6.6%. I updated my forecast to -11.8%. Based on cash flows, from April 2016 through the end of 2017 I expected spending to decline in 17 of 21 months. It declined in 14 of those months. Manufacturing spending finished 2017 down 11.9%.
In Fall 2017, I predicted Manufacturing construction spending would increase +9% in 2018. However, through March, total construction starts for Manufacturing over the last 12 months would count as the 2nd highest year on record. Therefore I’ve recently revised my forecast up to +13% spending in 2018. I’m now expecting double digit % spending growth in both 2018 & 2019. The January 2018 AIA consensus estimate is for +2.8% increase in 2018 spending and +5.2% in 2019. Some analysts predict 2018 spending will decline. My data shows increases in starts and backlog indicate large gains.
Nonresidential Buildings new starts are up 55% in four years. 2018 starting backlog is the highest ever, up 24% in two years.
Nonresidential Bldgs 2018 starting backlog is 55% higher than at the start of 2014, the beginning of the current growth cycle. Spending is UP 38% with 2018 spending forecast up 9%. Institutional accounts for 52% of 2018 construction spending growth, Commercial 27%, Industrial 21%.
80% of all nonresidential buildings construction spending forecast in 2018 is already in backlog projects at the start of the year.
New Construction Starts are booming (need to look past the mo/mo and ytd)
- Residential – 2 highest qtrs since 2006 in last 12 months
- Nonres Bldgs – 3 highest qtrs since Q1 2008 in last 15 months
- Nonbldg Infra – highet qtr since Q1 2015 peak in last 6 months.
Construction Starts data is regularly misinterpreted in common industry forecasting articles. Starts do not directly indicate changes in spending. A Forecast Cash Flow from Starts gives an indication of the rate of change in spending.
Educational new construction starts total from the last five months of 2017 posted the highest 5mo total starts in at least seven years, 13% higher than the next best 5mo. Jan 2018 monthly spending up 12% from 2017 mid-year low.
Healthcare construction starts have quietly increased to a record high over the last two years, up 30% for the 12 months through August 2017 vs the previous 12 months. Spending will increase slowly.
Amusement/Rec construction starts avg of +15%/yr for 5yrs, up 30% in 2016, 5% in 2017. In last 6mo, Aug 2017 to Jan 2018, four very large billion$+ projects started, almost a year’s worth of new starts in 6mo. Backlog indicates 15%-20% spending increases for 2018 and 2019.
In 2010, Warehouse new construction starts were only 1/3 of Store new starts. In 2018, Warehouse starts will be 50% greater than Store starts. Warehouse starts have increased between 20%-40%/year for seven years and are now five times greater than in 2010.
Lodging starting backlog up 13% for 2018, having already averaged increases of 30%/yr since 2015. Starting backlog jumped from $7 bil/yr in 2014 to $17 bil/yr in 2018, supported similar spending growth. Although 2016 was peak starts, it looks like 2018 will be peak backlog.
New construction starts for Manufacturing total for the last 12 months would count as the 2nd highest year on record. I’m now expecting double digit % spending growth in both 2018 & 2019. The consensus estimate is for +2.8% increase in 2018 spending and +5.2% in 2019. Some analysts predict 2018 manufacturing bldg spending will decline.
Structural steel contract includes structural shapes, steel joists, metal deck, stairs and rails, about 10% of total building final cost.
Other steel in a building can include reinforcing steel, exterior metal wall panels, metal ceiling frames, wall studs, door frames, canopies, steel duct, steel pipe and conduit, about 6% of total building cost.
All steel (in a structural steel building) is at least 16% of total building cost. There are more hidden costs of steel in mechanical, electrical and plumbing equipment.
Raw mill steel is about one fourth the final cost of structural steel installed. A 25% increase in cost of mill steel could raise a structural steel subcontract bid price by 6.25%. At 10% of total building budget, that would raise total building cost by 0.625%.
A 25% increase in cost of mill steel could raise the other nonstructural steel costs by 6.25%. At 6% of total building budget, that would raise total building cost by 0.375%.
A 25% tariff on mill steel raises building cost inflation by at least 1%. That’s about $7.5 billion of unexpected cost inflation just in 2018.
Watch for unexpected impacts from steel tariffs, potentially adding 5% or more to total cost of bridges (plate steel). Also impacted, power industry, pipeline, transmission & communication towers, transportation.
Steel tariff could inflate the cost of the proposed $2.1 billion Gordy Howe International Bridge by $100 million. That would hurt the budget.
2018 Construction Spending Forecast – Nonresidential Bldgs construction spending in 2018 forecast to reach a new high, $459 billion, up 9% over 2017, passing the previous 2008 high. In constant $, 2018 will still be 18% below peak.
An estimator could be far off when indexing construction cost using a general cost index versus an actual selling price index.
Failure to account for the affect of inflation on the cost of construction could result in a failure to be profitable.
For the last 4 to 5 years average inflation for nonresidential buildings is 4.5% to 5%.
For the last 4 to 5 years average inflation for residential buildings is 5.5% to 6%. In 2013 it reached a 12-year high of 8%.
If you are hiring to meet your needs and you see that construction spending (revenue) has increased by 25%, do you hire to match revenue? No! Hiring requires a knowledge of volume growth, and revenue doesn’t show that. Revenue minus inflation shows volume.
Construction activity has a direct influence on construction inflation. Nonresidential Buildings and Non-building Infrastructure backlog are both at all-time highs.
Construction Jobs vs volume growth the last 5 years is nearly even, yet jobs imbalances exist within sectors. Nonresidential Buildings and Non-building Infrastructure show excess jobs while Residential shows a severe jobs deficit. But not all of the apparent deficit in residential jobs is real.
Are all residential jobs being counted? Several studies suggest that a large portion of residential construction jobs may be held by uncounted immigrant or day labor. So it’s possible the residential jobs deficit may not be as large as shown.
In addition to uncounted immigrant labor, some labor is mis-classified. Take for example, a high-rise multi-use building with commercial retail, office and residential space. Census definitions of spending classifications break out spending into the 3 market sectors, but the building is built by high-rise contractors (probably normally classified as commercial), not a residential contractor. This is residential space built using labor classified as non-residential commercial.
BLS writes this: “Establishments are classified into industries on the basis of their primary activity… For an establishment engaging in more than one activity, the entire employment of the establishment is included under the industry indicated by the principal activity.”
So, the mis-classified labor reduces the nonresidential excess and offsets a portion of the residential shortfall.
Construction added 1,339,000 jobs in the last 5 years. The only time in history that exceeded jobs growth like that was the period 1993-99 with the highest 5-year growth ever of 1,483,000 jobs. That same 1993-99 period had the previous highest 5-year spending and volume growth going back to 1984-88.
Construction added 177,000 jobs in the 4 months Nov’17-Feb’18. That’s happened, for any 4-month period, only 5 times since 1984. The last time was 2005-06, during the fastest rate of spending increases since 1984.
Construction jobs pulled back 15k in March, but this follows the strongest month (Feb +65k) in 12 years, so not totally unexpected. I think Mar Construction jobs, (-15k), more likely a pause after Feb (+65k), strongest month in 12 years.

Construction Spending is Back
3-9-18
We’ve all seen headlines like, “Construction Spending is back to previous level”, or “Construction Spending back to a new high.” Here’s how even true information can be deceiving.
It’s true, construction spending in current $ reached a new high in 2017 at $1,236 billion. The previous high in current $ was $1,161 in 2006. Spending surpassed that in 2014 and has been increasing since. But that is in current $, which includes inflation.
Let’s say a store will sell a bushel of apples, cost $100 in 2014, $110 in 2015, $120 in 2016 and $130 in 2017. If we look at the current $ spent on apples each year, it looks like business is booming, up 30% in 3 years. But the reality is, with the exception of inflation, the apple business has not changed at all. Only one bushel of apples sold every year. The year to year change in un-adjusted current $ is the increase in cost, not the increase in volume.
Comparing current $ spending to previous year spending does not give any indication if business is increasing. The inflation factor is missing. If spending is increasing at 4%/year in a time when inflation is 6%/year, real volume is declining by 2%.
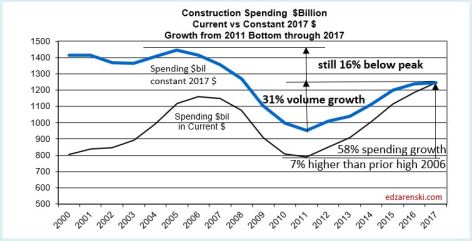
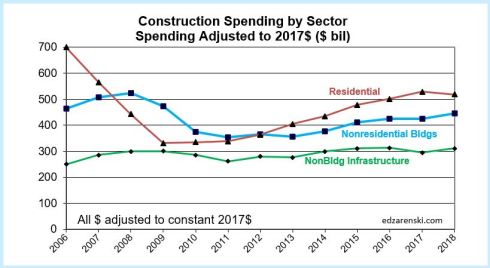
Total construction spending in constant $ (inflation adjusted $) reached $1,236 billion in 2017. After adjusting all previous spending to equivalent 2017$, we can see that all years from 1997 through 2008 had higher volume than 2017. In 2000-2001 volume was just over $1,400 billion and in 2005 volume reached a peak at $1,454 billion. While spending in current $ is 7% higher than the previous high spending, volume is still 15% lower than the previous high volume.

Nonresidential buildings construction spending in constant $ (inflation adjusted $) reached $419 billion in 2017. Previous spending adjusted to equivalent 2017$ shows that all years from 1995 through 2010 had higher volume than 2017. Volume reached a peak $536 billion in 2000 and went over $500 billion again in 2008. Spending in current $ is almost back to the peak of $438 billion in 2008, but volume is lower than almost all years from 1985 to 2010 and is still 22% lower than the 2000 high volume.

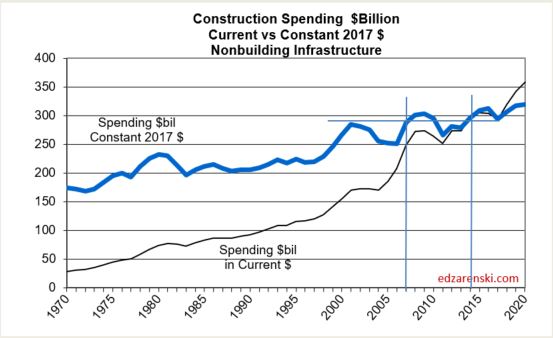
Non-building Infrastructure construction spending in constant $ reached $294 billion in 2017. Recent highs were posted in 2015 and 2016 at $305 billion and $304 billion and 2018 is expected to reach $319 billion. Previous spending adjusted to equivalent 2017$ shows that 2008 and 2009 were both just slightly higher than $300 billion. Volume reached a peak $313 billion in 2016. Spending in current $ hit new highs in 2015 and 2016. This is the only sector that has current $ and constant $ at or near all-time highs.
Residential buildings construction spending in constant $ reached $523 billion in 2017. Previous spending adjusted to equivalent 2017$ shows that all years from 1996 through 2007 had higher volume than 2017. Volume reached a peak $748 billion in 2005. Only the years 2004-2006 had higher spending in current $. The 2005 current $ peak of $630 billion is still 17% higher than 2017, but 2017 volume is still 30% lower than peak volume.

This has several implications besides misleading headlines that claim construction is at a new high. Just look at the period 1996-2007 on the residential plot. Spending in current $ increased 130% from $270 billion to $620 billion. But this was during a period that recorded some of the highest residential construction inflation on record. Inflation was 90%. Follow the guidelines up to constant$ and see that real volume increased only 40% from $530 billion to $750 billion.
If you are hiring to meet your needs and you see that spending (revenue) has increased by 130%, do you hire to meet revenue? No. Hiring requires a knowledge of volume growth. Residential jobs during this time frame increased by 55%, more than real volume growth, but no where near the 130% spending growth.
The above plots were developed using current and historical Census construction spending and inflation indices were developed from construction industry resources, documentation which can be found here on this blog.
See also
Residential Construction Jobs Shortages 2-3-18
Constant Dollar Construction Growth 11-2-17
Inflation in Construction 2018 – What Should You Carry? 2-15-18
ESCALATION / INFLATION INDICES
Inflation in Construction 2019. What Should You Carry?
1-28-20 See the latest post Construction Inflation 2020
8-26-19 go to this article for Added links to sources for international construction inflation rates
1-14-20 added new index table covering 2015-2023 at Index Table Link – see link to Tables below
This table updates 2018 and 2019 data and 2020-2023 forecast. Nonresidential inflation, after hitting 5% in both 2018 and 2019, is forecast for the next three years to fall from 4.4% to 3.8%, lower than the 4.5% avg for the last 4yrs. Forecast residential inflation for the next three years is level at 3.8%. It was only 3.6% for 2019 but averaged 5.5%/yr since 2013.
When construction is very actively growing, total construction costs typically increase more rapidly than the net cost of labor and materials. In active markets overhead and profit margins increase in response to increased demand. These costs are captured only in Selling Price, or final cost indices.
General construction cost indices and Input price indices that don’t track whole building final cost do not capture the full cost of inflation on construction projects.
To properly adjust the cost of construction over time you must use actual final cost indices, otherwise known as selling price indices.
ENRBCI and RSMeans input indices are examples of commonly used indices that DO NOT represent whole building costs, yet are widely used to adjust project costs. An estimator can get into trouble adjusting project costs if not using appropriate indices. This plot of cost indices for nonresidential buildings shows how input indices did not drop during the 2008-2010 recession while all other final cost indices did drop.

CPI, the Consumer Price Index, tracks changes in the prices paid by urban consumers for a representative basket of goods and services, including food, transportation, medical care, apparel, recreation, housing. The CPI is not related at all to construction and should not be used to adjust construction pricing. Historically, Construction Inflation is about double the CPI, but for the last 5 years construction inflation averages 3x the CPI.
Producer Price Index (PPI) Material Inputs (which exclude labor) to new construction increased +4% in 2018 after a downward trend from +5% in 2011 led to decreased cost of -3% in 2015, the only negative cost for inputs in the past 20 years. Input costs to nonresidential structures in 2017+2018 average +4.3%, the highest in seven years. Infrastructure and industrial inputs were the highest, near 5%. But material inputs accounts for only a portion of the final cost of constructed buildings.
Materials price input costs in 2019 slowed to an annual rate of less than 1%.
Labor input is currently experiencing cost increases. When there is a shortage of labor, contractors may pay a premium to keep their workers. Unemployment in construction is the lowest on record. The JOLTS ( Job Openings and Labor Turnover Survey) is at or near all-time highs. A tight labor market will keep labor costs climbing at the fastest rate in years.
Click Here for Link to a 20-year Table of 25 Indices
Inflation can have a dramatic impact on the accuracy of a construction budget. Usually budgets are prepared from known current costs. If a budget is being developed for a project whose midpoint of construction costs is two years in the future, you must carry an appropriate inflation factor to represent the expected cost of the building at that time.
The level of construction activity has a direct influence on labor and material demand and margins and therefore on construction inflation. Nonresidential Buildings and Non-building Infrastructure backlog are both at all-time highs. 75% to 80% of all nonresidential spending within the year comes from starting backlog.
Although nonresidential buildings new starts are up only 5% the last three years, spending from backlog in 2020 is up 20% in three years and reaches an all-time high.
Most spending for residential comes from new starts. Residential new starts in Q1-2018 reached a 12 year high. Spending from new starts in 2019 fell 6% but is up 6% for 2020. Spending from new starts in 2020 is back to the level posted in 2017 and 2018.
2020 starting backlog is up 5.5% across all sectors. However, while a few markets will outperform in 2020 (transportation, public works, office), predicted cash flow (spending) from backlog is up only 1% to 2%.
Although many contractors report shortages due to labor demand, labor growth may slow due to a forecast 2019-2020 construction volume decline. But, we might see a labor decline lag spending/volume decline.
Expect 2019 escalation in almost all cases to finish at or lower than 2018.
Residential construction inflation in 2019 was only 3.6%. However, the average inflation for six years from 2013 to 2018 was 5.5%. It peaked at 8% in 2013, but dropped to 4.3% in 2018 and only 3.6% in 2019. Residential construction volume in 2019 dropped 8%, the largest volume decline in 10 years. Typically, large declines in volume are accompanied by declines in inflation. Forecast residential inflation for the next three years is level at 3.8%.
Note 8-2-19: Residential inflation for the 1st half of 2019 has come in at only 3.5%.
A word about Hi-Rise Residential. Probably all of the core and shell and a large percent of interiors cost of a hi-rise residential building would remain the same whether the building was for residential or nonresidential use. This type of construction is totally dis-similar to low-rise residential, which in large part is stick-built single family homes. Therefore, use the residential cost index for single family but a more appropriate index to use for hi-rise residential construction is the nonresidential buildings cost index.
Nonresidential inflation, after hitting 5% in both 2018 and 2019, is forecast for the next three years to fall from 4.4% to 3.8%, lower than the 4.5% average for the last 4 years. Spending needs to grow at a minimum of 4.4%/yr. just to stay ahead of construction inflation, otherwise volume is declining. Spending slowed dramatically in 2019. However, new starts in 2018 and 2019 boosted backlog and 2020 spending will post the strongest gains in four years.
Material tariffs in 2018 and 2019 are already incorporated into inflation. Adjust for any new tariffs impact.
In another article on this blog, (see steel cost increase), I calculated the 25% tariff on steel would cost nonresidential buildings 1%. Some Infrastructure could be much more, i.e., bridges 4-5%. Residential impact would be small. A 25% increase in mill steel could add 0.65% to final cost of building just for the structure. It adds 1.0% for all steel in a building. If your building is not a steel structure, steel still potentially adds 0.35%.
Note 8-2-19: Nonresidential Buildings inflation for the 1st half of 2019 as tracked by most national selling price indices has come in at just over 5%.
Reliable nonresidential buildings selling price indexes have been over 4% since 2015. Some have averaged over 5% for the last four years. Construction Analytics forecast (line) for 2019 is currently 5.1%. This may move higher due to the impact of September 2019 tariffs which are not yet reflected in any indices.

Non-building infrastructure indices are so unique to the type of work that individual specific infrastructure indices must be used to adjust cost of work. The FHWA highway index increased 17% from 2010 to 2014, stayed flat from 2015-2017, then increased 15% in 2018-2019. The IHS Pipeline and LNG indices increased 4% in 2019 but are still down 18% since 2014. Coal, gas, and wind power generation indices have gone up only 5% since 2014. Refineries and petrochemical facilities dropped 10% from 2014 to 2016 but regained all of that by 2019. BurRec inflation for pumping plants and pipelines has averaged 2.5%/yr since 2011 and 3%/yr the last 3 years.
Anticipate 3% to 4% inflation for 2019 with the potential to go higher in rapidly expanding Infrastructure markets, such as pipeline or highway.
This link refers to Infrastructure Indices.
Watch for unexpected impacts from tariffs. Steel tariff could potentially add 5% to bridges. Also impacted, power industry, pipeline, towers, transportation.
- Long term construction cost inflation is normally about double consumer price inflation (CPI).
- Since 1993 but taking out 2 worst years of recession (-8% to -10% total for 2009-2010), the 20-year average inflation is 4.2%.
- Average long term (30 years) construction cost inflation is 3.5% even with any/all recession years included.
- In times of rapid construction spending growth, construction inflation averages about 8%.
- Nonresidential buildings inflation has average 3.7% since the recession bottom in 2011. It has averaged 4.2% for the last 4 years.
- Residential buildings inflation reached a post recession high of 8.0% in 2013 but dropped to 3.4% in 2015. It has averaged 5.8% for the last 5 years.
- Although inflation is affected by labor and material costs, a large part of the change in inflation is due to change in contractors/suppliers margins.
- When construction volume increases rapidly, margins increase rapidly.
- Construction inflation can be very different from one major sector to the other and can vary from one market to another. It can even vary considerably from one material to another.
The two links below point to comprehensive coverage of the topic inflation and are recommended reading.
Click Here for Link to a 20-year Table of 25 Indices
Click Here for Cost Inflation Commentary – text on Current Inflation
US Historical Construction Cost Indices 1800s to 1957
Historical Cost Indices Dating Back to 1800s
See pages 379-386 for indices
See page 387 for start of Housing
Chapter on Housing Historical Data
U S Census Historical Construction Spending Annual totals 1964-2002 USE Table 1

Cautions When Using PPI Inputs to Construction!
The Producer Price Index (PPI) for material inputs to construction gives us an indication whether costs for material inputs are going up or down. The PPI tracks producers’ cost to produce the product and supply finished products to retailers or contractors. However, that is far from the total cost from the contractor.
A good example is steel. The producer price for steel from the mill might be $750/ton for long beams and columns. The only increases captured at the producer level might be the changes in cost for raw material, energy to manufacture and the producers labor and markup. But the structural steel contractor is then responsible for delivery to shop, detailing, shop fabrication, transport to construction site, load and unload, cranes and welding equipment needed to install, installation crews and finally overhead and profit accounting for at least eight more points of potential cost change. Finally the steel subcontractor must then assess the market conditions, whether tight or favorable to higher profits, to adjust the bid price or selling price. The final cost of steel installed could be $3000/ton.
The PPI for Construction Inputs IS NOT a final indicator of construction inflation. It is an input to construction inflation. It does not represent the selling price, nor does it give any indication of the trend, up or down, of selling price.
In 2009 PPI for inputs was flat but construction inflation, as measured by final cost of buildings, was down 8% to 10%. In 2010, the PPI for construction inputs was up 5.3% but the selling price was flat. Construction inflation, based on several decades of trends, is approximately double consumer inflation. However, from mid-2009 to late 2012, that long-term trend did not hold up. During that period, PPI ranged from 0% to +6.8%, but construction inflation/deflation ranged from -10% to +2.3%, lower than PPI for all four years, something which seldom occurs. Construction inflation/deflation was primarily influenced by depressed bid margins, which had been driven lower due to diminished work volume.
The following table shows the differences between the PPI Inputs from 2011 to 2017 and the actual inflation for the major construction sectors. This table shows clearly that PPI Inputs and Inflation not only can vary widely but also may not even move in the same direction.

The PPI tables published by the Bureau of Labor Statistics do include several line items that represent Final Trades Cost or Whole Building Cost. Those PPI items don’t give us any details about the producer price or retail price of the materials used, but they do include all of the contractors costs incurred, including markups, on the final product delivered to the consumer, the building owner. I would note however that those line items in the PPI almost always show lower inflation than final Selling Price inflation indices developed separately from the PPI. Follow this link to table of inflation values which includes the PPI final cost for trades and buildings.
Construction Managers responsible for working with the client to manage project cost, part of which includes preparing a full building cost estimate, should not rely on PPI values as an indication of inflation. Selling price inflation indices are more appropriate indices to use to adjust project costs.
It is always important to carry the proper value for cost inflation. Whether adjusting the cost of a recently built project to predict what it might cost to build a similar project in the near future, or answering a client question, “What will it cost if I delay my project start?”, the proper value for inflation (which differs by sector and differs every year) can make or break your estimate.
Contractors responsible for a particular building material, although the PPI Inputs will not track market conditions sale prices from producer to the contractor, can get some indication of whether material prices are rising or falling. Contractors should be aware of PPI trends to interpret the data throughout the year.
PPI TRENDS HELP TO INTERPRET THE DATA
- 60% of the time, the highest increase of the year in the PPI is in the first quarter.
- 75% of the time, two-thirds of the annual increase occured in the first six months.
- In 25 years, the highest increase for the year has never been in Q4.
- 60% of the time, the lowest increase of the year in the PPI is in Q4.
- 50% of the time, Q4 is negative, yet in 25 years the PPI was negative only four times.
So when you see monthly news reports from the industry exclaiming, “PPI is up strong for Q1” or “PPI dropped in the 4th Qtr.” it helps to have an understanding that this may not be unusual at all and instead may be the norm.
PPI Construction Materials Inputs Index

Constant Dollar Construction Growth
11-2-17
Construction spending had been chugging along very nicely from 2012 through 2016 with annual growth ranging between +6.5% and +11.0%. The average spending growth for those 5 years is 8.5%/yr. For 2017, spending growth will come in at only just over 5%.
Perhaps what may be more important is the inflation adjusted growth or constant dollar growth. Constant dollar growth measures volume. Volume growth ranged from +3.0% to +8.0% in the 5 years from 2012 through 2016. The average constant$ growth for those 5 years is 5.4%/yr. The rest of the spending growth was inflation dollars. For example: a year in which spending growth is 7% but that has 4% inflation ends up with only 3% constant$ volume growth.
From 2005 peak volume ($1,448 bil in 2017$) to the lows reached in 2011 ($954 bil), constant dollar volume dropped 34%. Since the 2011 low, volume has increased 31%. In rapid growth years volume increases between 6% to 8%/yr. In average or low growth years, constant dollar volume growth ranges closer to 2% to 3%/yr.
2017 will post the highest composite construction inflation in 11 years, 4.5%. Residential inflation has averaged 6%/yr for the last 5 years. With 2017 at 5% construction spending growth, the lowest in six years, and at the highest inflation in years, 2017 volume growth will fall to only +0.6%.
Residential, with nearly 12% spending growth in 2017, still holds onto the best volume growth in 2017 at slightly over 5%. Residential has recorded the highest volume growth in 5 of the last 6 years, the lowest coming in at +5%, averaging 8%/yr for 6 years.
Nonresidential Buildings constant dollars is down slightly for 2017, posting a volume decline of -0.2%. This was predictable since Manufacturing, after recording 90% growth from 2011 to 2015, has worked off a big backlog and dropped 15% (from an all-time high) in the last two years, most of that drop in 2017. For 2017 that drop offset $8 billion of growth from other markets. Nonresidential Buildings volume increased 20% in the previous 3 years.
Non-building Infrastructure volume is down 6% in 2017 after growing only 5% in the previous 2 years. However, the non-building infrastructure sector led all growth in 2014 at +8.5%. It should be noted that 2015 posted the all-time high for Infrastructure spending. The largest declines since then are in Environmental Public Works projects, Sewer/Water/Conservation. All three markets posted declines in new project starts in 3 or 4 of the last 4 years. Spending in 2017 is down 17% from the most recent high in 2015.
Public works spending is responsible for 80% of the dollar decline in non-building infrastructure spending since the high in 2015.
In 2018, Nonresidential Buildings and Non-building Infrastructure lead spending growth. Residential spending will slow considerably after six years of solid growth. Constant$ volume growth after inflation will climb back to +2.3% with the two nonresidential sectors over 5% and residential dropping to a volume decline.
SEE INFLATION TABLES HERE CONSTRUCTION INFLATION
These articles all relate to Constant dollars (Inflation Adjusted)
Constant Dollars – Impact of Inflation
Are We at New Peak Construction Spending?

Construction Forecasting Presentation 2017
Attached PDF of my Forecasting presentation delivered 5-22-17 at Advancing Building Estimation in Houston
EdZ presentation ABE Forecasting Costs 5-22-17
A few bullets from this presentation
- Construction Starts is not construction spending
- Cash flow = Spending = Revenue
- Revenue is not Volume of work
- Spending minus inflation = Volume
- Understand what’s in an Index to avoid misguided inflation adjustments
- We can’t ignore productivity
- Spending activity has just as much influence on inflation as labor and material cost.
Slides in this presentation come from the following articles:
1st Qtr Update 2017 Construction Spending Forecast
Inflation Index vs Spending
The two plots lined up here represent spending and spending corrected for inflation or real volume growth in the top plot versus construction inflation in the bottom plot. On the Inflation plot, the black line represents final selling price, actual inflation. The red line represents the ENR Building Cost Index which is a fixed market basket of labor and materials, not a complete selling price index. All plots are for nonresidential buildings only.
The index shows how cost inflation climbs in periods when spending is accelerating and the index slows when spending is increasing slowly. Also we can see that the major decline in spending resulted in a major deflation in the index. Note the ENR BCI does not show the major decline in the inflation index. That’s because the ENR BCI is not final selling price. It shows what the cost of labor and materials did during that period, but does not capture how contractors adjusted their margins down so deeply due to loss of volume.
The takeaway from this comparison is this:
- Labor and material indices do not show what real total inflation is doing
- When spending increases rapidly, inflation increases rapidly
- When spending increases slowly, inflation increases slowly
- An understanding of which direction and how much spending is moving is more important to predicting inflation than the change in the cost of labor and materials

