3-9-18
We’ve all seen headlines like, “Construction Spending is back to previous level”, or “Construction Spending back to a new high.” Here’s how even true information can be deceiving.
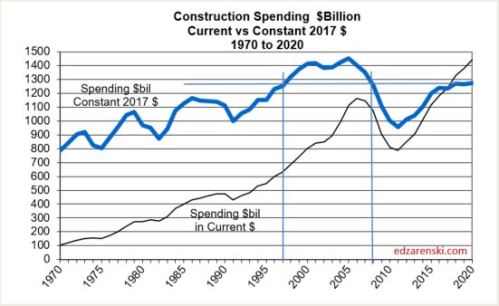
It’s true, construction spending in current $ reached a new high in 2017 at $1,236 billion. The previous high in current $ was $1,161 in 2006. Spending surpassed that in 2014 and has been increasing since. But that is in current $, which includes inflation.
Let’s say a store will sell a bushel of apples, cost $100 in 2014, $110 in 2015, $120 in 2016 and $130 in 2017. If we look at the current $ spent on apples each year, it looks like business is booming, up 30% in 3 years. But the reality is, with the exception of inflation, the apple business has not changed at all. Only one bushel of apples sold every year. The year to year change in un-adjusted current $ is the increase in cost, not the increase in volume.
Comparing current $ spending to previous year spending does not give any indication if business is increasing. The inflation factor is missing. If spending is increasing at 4%/year in a time when inflation is 6%/year, real volume is declining by 2%.
Total construction spending in constant $ (inflation adjusted $) reached $1,236 billion in 2017. After adjusting all previous spending to equivalent 2017$, we can see that all years from 1997 through 2008 had higher volume than 2017. In 2000-2001 volume was just over $1,400 billion and in 2005 volume reached a peak at $1,454 billion. While spending in current $ is 7% higher than the previous high spending, volume is still 15% lower than the previous high volume.
Nonresidential buildings construction spending in constant $ (inflation adjusted $) reached $419 billion in 2017. Previous spending adjusted to equivalent 2017$ shows that all years from 1995 through 2010 had higher volume than 2017. Volume reached a peak $536 billion in 2000 and went over $500 billion again in 2008. Spending in current $ is almost back to the peak of $438 billion in 2008, but volume is lower than almost all years from 1985 to 2010 and is still 22% lower than the 2000 high volume.

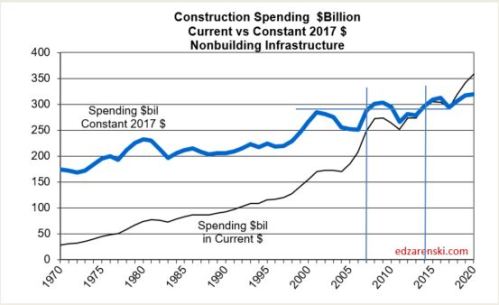
Non-building Infrastructure construction spending in constant $ reached $294 billion in 2017. Recent highs were posted in 2015 and 2016 at $305 billion and $304 billion and 2018 is expected to reach $319 billion. Previous spending adjusted to equivalent 2017$ shows that 2008 and 2009 were both just slightly higher than $300 billion. Volume reached a peak $313 billion in 2016. Spending in current $ hit new highs in 2015 and 2016. This is the only sector that has current $ and constant $ at or near all-time highs.
Residential buildings construction spending in constant $ reached $523 billion in 2017. Previous spending adjusted to equivalent 2017$ shows that all years from 1996 through 2007 had higher volume than 2017. Volume reached a peak $748 billion in 2005. Only the years 2004-2006 had higher spending in current $. The 2005 current $ peak of $630 billion is still 17% higher than 2017, but 2017 volume is still 30% lower than peak volume.
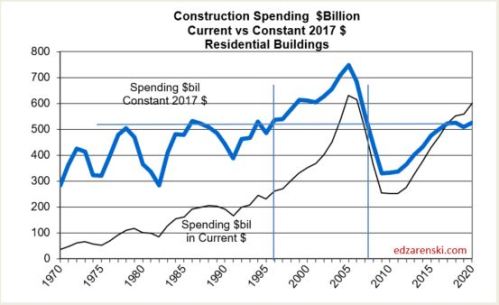
This has several implications besides misleading headlines that claim construction is at a new high. Just look at the period 1996-2007 on the residential plot. Spending in current $ increased 130% from $270 billion to $620 billion. But this was during a period that recorded some of the highest residential construction inflation on record. Inflation was 90%. Follow the guidelines up to constant$ and see that real volume increased only 40% from $530 billion to $750 billion.
If you are hiring to meet your needs and you see that spending (revenue) has increased by 130%, do you hire to meet revenue? No. Hiring requires a knowledge of volume growth. Residential jobs during this time frame increased by 55%, more than real volume growth, but no where near the 130% spending growth.
The above plots were developed using current and historical Census construction spending and inflation indices were developed from construction industry resources, documentation which can be found here on this blog.
See also
Residential Construction Jobs Shortages 2-3-18
Constant Dollar Construction Growth 11-2-17
Inflation in Construction 2018 – What Should You Carry? 2-15-18
ESCALATION / INFLATION INDICES
