Home » Posts tagged 'nonresidential'
Tag Archives: nonresidential
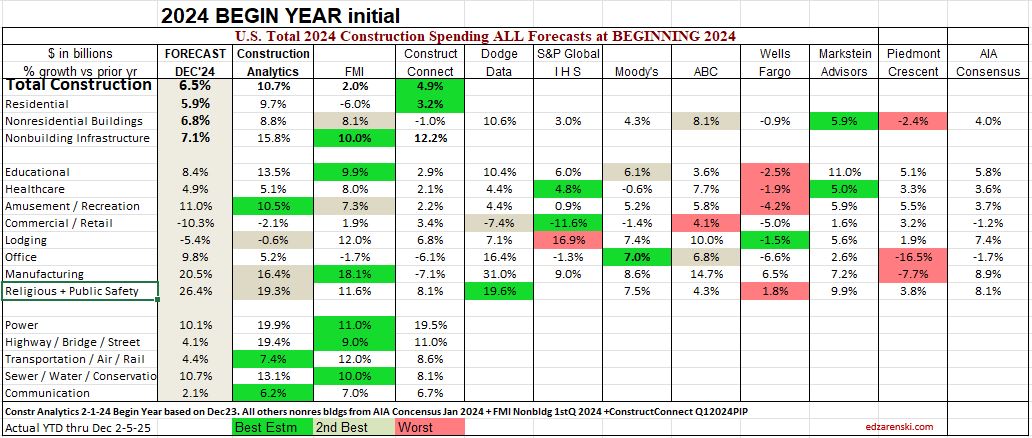
Compare 10 Construction Spending Forecasts for Nonres Bldgs Feb 2025
Construction Analytics updates the Construction Spending Forecast every month, usually publishing at least a Brief, every other month. The AIA Consensus solicits forecasts from 9 firms that prepare construction spending forecasts and publishes a Consensus Forecast every January and every June-July. The AIA Consensus reports only on nonresidential buildings.
This table captures the percents growth issued by the 9 firms reporting in the AIA Consensus and the Consensus average. Included is Construction Analytics full forecast. Also included, FMI and Construct Connect also provide full forecasts. Capturing this history provides a ready template to compare “How’d we do?” at the end of the year. It’s not often that we get to look back at forecasts to see how they performed when compared to the actual results. But I’m sure you’ve been asked, “Did you ever go back and look to see how you’ve done?”
You can see in this most recent 2025 table that some of the forecasts vary widely. For instance, in the most recent forecast for 2025: Data Centers forecasts range from +17% to +42%; Manufacturing from -11% to +18%; Educational -2% to +10%; Healthcare -1% to +21%; Warehouse -9% to +12%; Lodging -7% to +22%. Very few (if any) forecasts are in agreement. That’s why it’s valuable to capture the data and compare it to actuals once all the data is in at the end of the year. The first total for every year is issued in Feb., but the final annual actual value is subject to Census revisions until July of the following year,
These are the current Jan forecasts for 2025 nonresidential Buildings spending

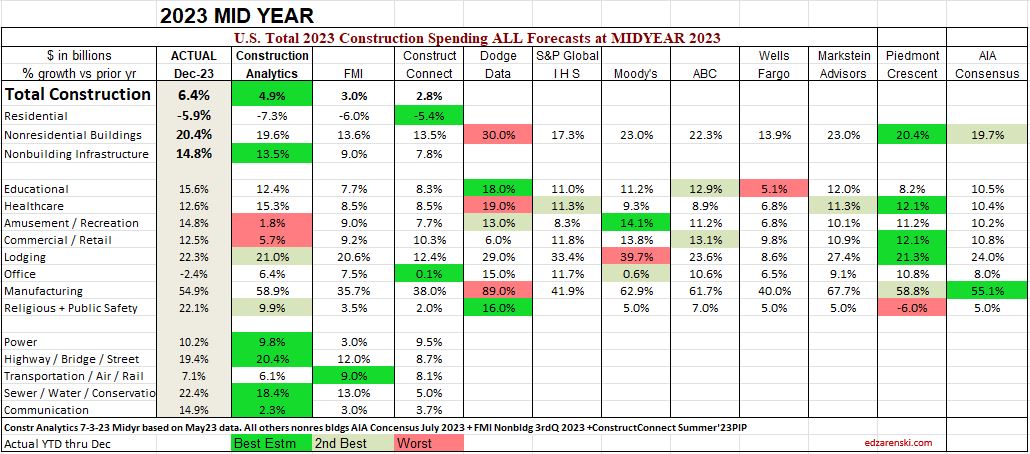
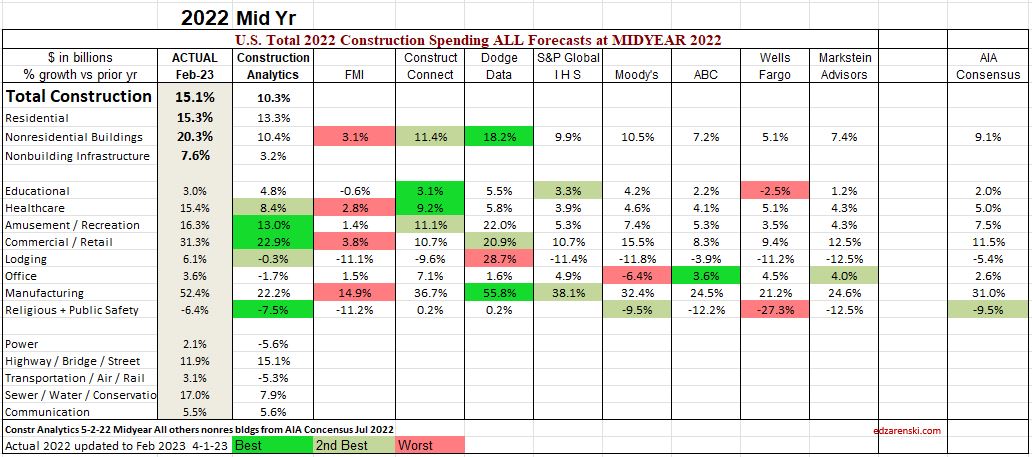
Here are some past results, looking back in chronological order. Each table summarizes the percent growth forecast issued by each forecaster. Then, the forecasts are compared to the actual value. Individual market forecasts are marked as best, 2nd best and worst forecast. Color makes it easy to see the performance at a glance. This is a simple table collecting all the forecasting data for one period into one table for ease of comparison. Nothing is changed after the forecasts are issued, except for the actual data at year-end to which it is compared, which gets revised three times through July of the following year after the annual results are posted. You will see that I’ve done better in some forecasts than others. I scored a lot of the 2nd best estimates. Other old posts on this blog show the year I absolutely bombed, 2021, I think. My column was a sea of red. You might think that the updated Midyear forecast is always an improvement from the Beginning of year forecast, but that is not always the case, as you will see. The numbers don’t lie. We post our forecasts and wish for the best. Sometimes we get the best.


The inquisitiveness in me wants to know how this shakes out, so I put a score to the results. Here’s three years of completed data with two forecasts each year, but I took out (low scoring 8pts) Piedmont, as they were not involved to provide a forecast for 2022. So, How’d we do? These six tables, two each from 2022, 2023 and 2024, are scored here. There are 8 Nonres Bldgs markets plus the Nonres Bldgs total included in the count, so there are 9 line items. I gave 3 pts for best, 2pt for 2nd and -1 for worst.
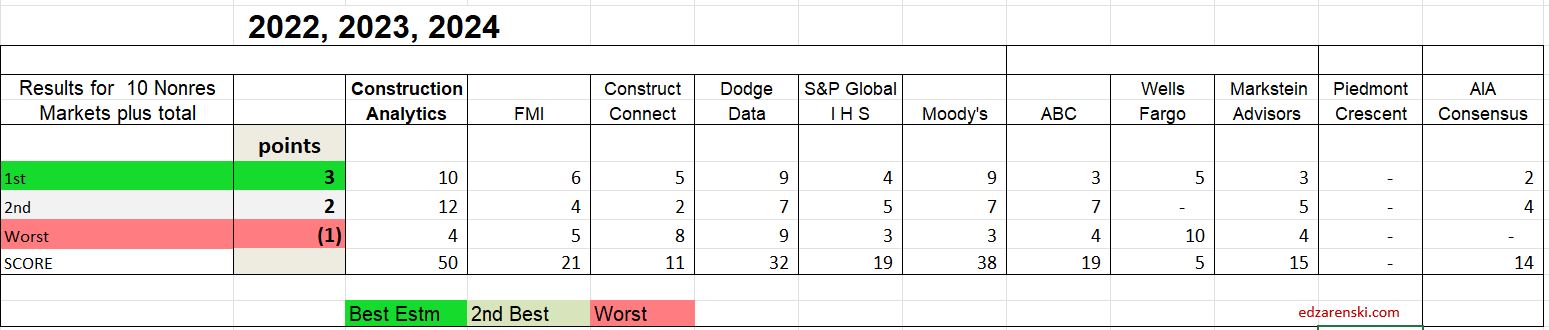
See any favorites of yours in the list of forecasters? Well, this is a small subset of their forecasting performance over recent years. What’s their score?
I summed the same sets of data back to 2020 to find if this trend, that Construction Analytics is scoring highest, is consistent. Again, I took out (low scoring 8pts) Piedmont, as they did not provide a forecast in 20, 21 or 22. The trend is similar. ABC picked up the most points (29), Markstein Advisors picked up 26, but Construction Analytics still picked up 22 points and retained the top spot.
The maximum any company can score in one forecast is 27 by scoring best on all 8 line items plus the total. The highest single forecast score in five years by any company is 17, that was by Construction analytics in the 2023 Beginning of Year forecast. Out of 11 firms across 9 forecasts in 5 years (no 2020 Beginning forecast and only 4 for Piedmont), or 94 forecasts, only 7 times has any firm scored higher than 10 out of a max 27. That might even make you think forecasting is difficult.
Sometimes, no forecast gets even close to the actual number. As an example, in the 2022 Beginning of year forecast, the average difference from forecasts to actual growth for Manufacturing was off by 40%+. The closest forecast was only within 23%. Why is that? Well, I base my forecast of construction starts. I’m sure others do too. New starts reported for a 3yr period 2020 thru 2022 averaged $50bil/year. But construction spending for the same period grew from $75bil/yr. to $125bil in 2022 and then shot up to $190bil in 2023. The starts report did not give a clear indication of what was leading into spending.

Some of the things I watch for when preparing my forecast are; What is the current rate of spending (Dec’24), compared to the year (2024) average, as we begin the new year (2025)? and What is the recent rate of growth? Does my forecast fit within the current trend? For example, as we begin 2025, the current rate of spending in Q4 2024 on Data Centers is already up 16% from the average of 2024, and it is climbing at a rate from 1%/mo to a few percent per month. That means that unless we experience some unexpected event that would cause spending to decline, we will easily increase from 16% growth to far greater by the end of 2025, or for that matter even by the end of Q1. So, the low is already established at 16% as we begin the year. All growth is an increase from there. New starts have averaged growth of 50%/yr for the last three years, so growth is established. There are a few low forecasts of 17%, 18% and 19% spending growth for the year. That would mean remaining spending growth for all of 2025 would be 1% to 3%, but that’s not realistic with new starts at 50% growth. Forecasts in the range of 20% +/- will be surpassed in the first few months of 2025. The AIA consensus 2025 forecast for Data Centers is +21.9%. I suspect that will be surpassed before Q1 is over.
There are some older posts on this blog that capture this info from earlier years. Not sure at this point what the title of the post would be to search for them. If you are so inclined, try searching for AIA or for the word Compare or Consensus. SEE Link Below. I had awful results one year.
So, I may not have prepared the best total forecast every year from 2020 thru 2024, but overall, I posted the most overall 1st or 2nd best line by line forecasts. In fact, for the Nonres Bldgs Totals (the sum of the 8 markets), out of the 9 forecasts from 2020 thru 2024, I had only 2 of the best Totals forecasts. Markstein Advisors is the only other firm that had 2 of the best totals forecasts.
I will close by saying, the data for the past 3 years or even 5 years shows that I’m providing you with the longest trend best forecast of Nonresidential Bldgs cost growth, and I’m happy to do so.

Construction Analytics Outlook Feb 2025
2-22-25 — A PDF of this entire Outlook article has been attached at the bottom of this post. 32pages, watchout. The Outlook has quite a bit more than in the post here.
Construction Spending
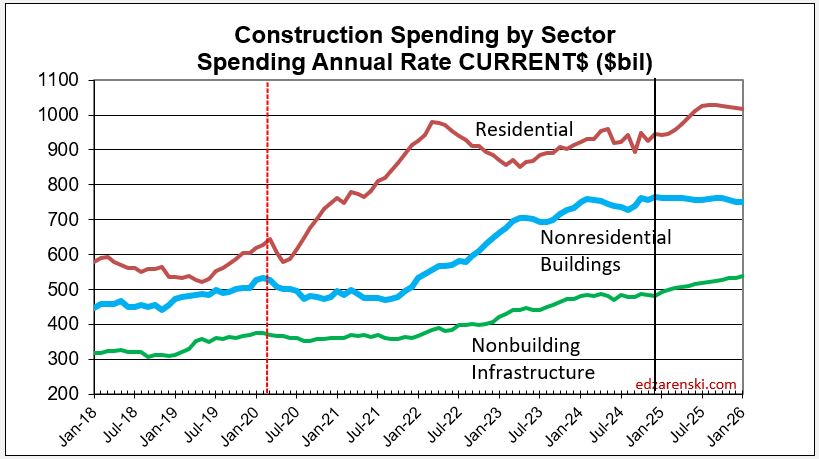
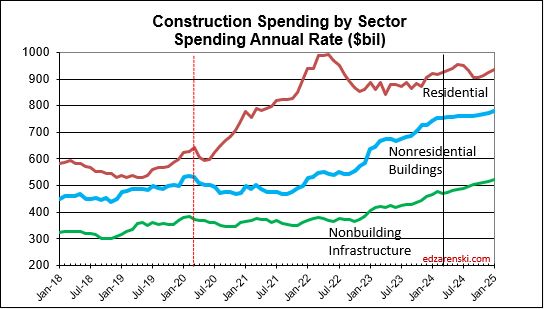
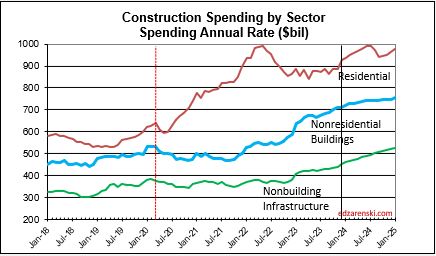
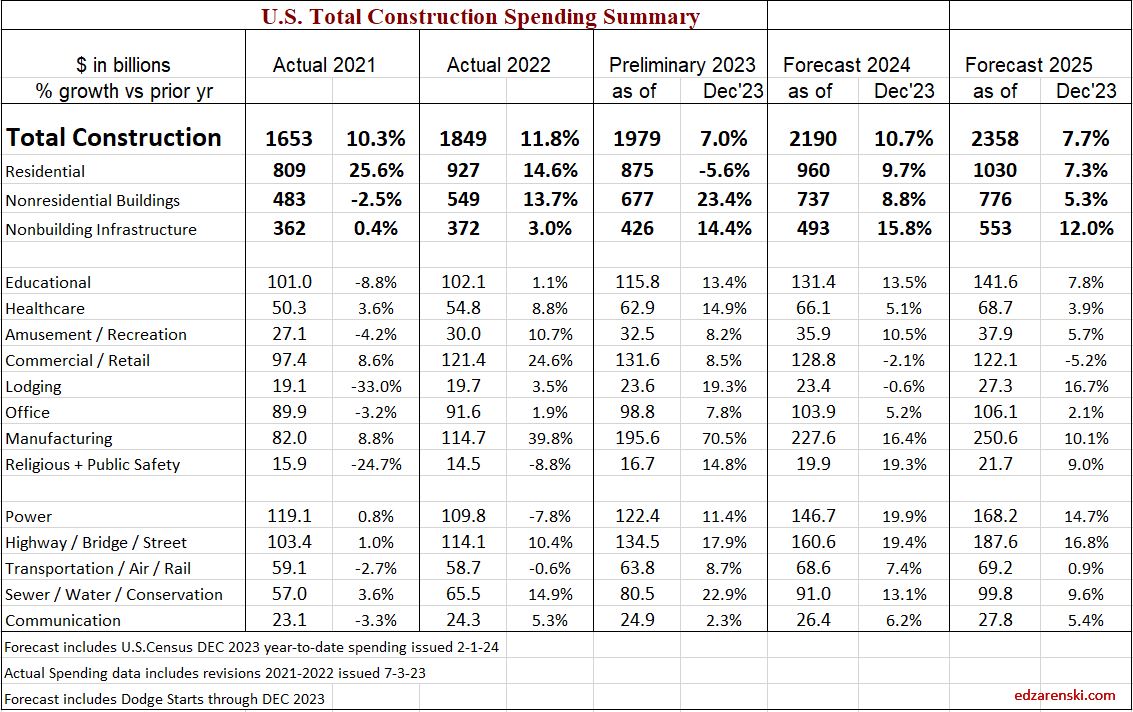
for 2024 vs 2023, as of Dec 2024 data, is up 6.5%. All sectors gained between 6% and 7% over 2023. Growth is forecast at 5.5% in 2025. While Residential and Non-building Infrastructure will both gain 7%, Nonresidential Buildings will only see growth of 2% in 2025.
In February of 2025, with the Dec 2024 data in hand, my forecast for 2025 spending is $2,272 billion, 5.5% higher than my current 2024 forecast of $2,154 billion. There is strength in most markets, but Manufacturing is starting a downward slope in spending after three years of blockbuster performance.
This is the first report of a full 12 months of data from 2024. This number gets revised in Mar and Apr and again in July, when any/all months for the last two years get revised.

Last year at this time, leading into 2024, many of the Nonres Bldgs and Non-bldg line items showed Nov-Dec spending was already several points higher than the 2023 average. This year, many markets show very small gains or a decline in the rate of spending from the 1st half of the 2024 into the 2nd half. Some notable declines are Warehouse (-2.7%), Office w/o Data Centers (-3.6%) and Highway/Bridge (-2.9%). All begin 2025 down from the average in 2024.
However, Data Center spending is already up 16% in Oct-Nov-Dec vs the average of 2024, so begins 2025 on a high note, up 16% from 2024. Data Center spending increased 45% in 2023 and 56% in 2024. With spending increasing at an average 3%+ per month in 2024, and starting out at that pace in 2025, it’s easy to predict Data Center spending may reach 40% growth for 2025.
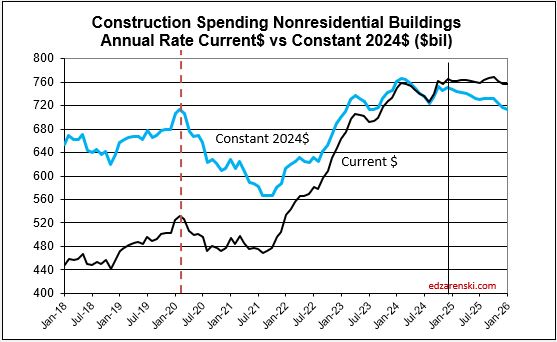
As we begin 2025, the current rate of spending (SAAR) for Nonresidential Buildings in Q4’24 is $761bil, only 2% higher than the average for 2024 ($746bil). If spending stays at the current level and no additional growth occurs, Nonresidential Bldgs spending will finish 2024 up 2%. Spending would need to have more monthly declines than increases to finish the year up less than 2%. The current forecast shows the monthly SAAR rates for Manufacturing, Warehouse and Office w/o DC are driving the downward pressure on overall spending.
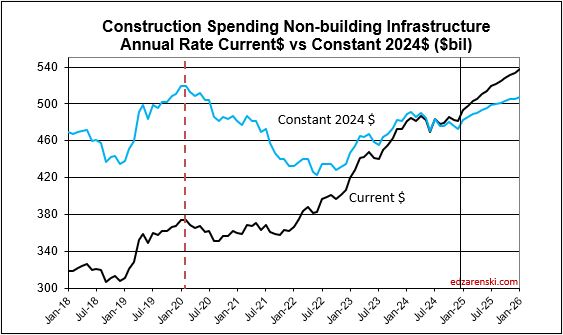
Non-building Infrastructure current rate of spending is only 1% higher than the average for 2024, however the forecast is indicating steady growth of 1.5%/mo for all of 2025. Highway, Transportation and Public Utilities are all contributing to that growth in the spending rate.
Residential current rate of spending is a bit less than 2% above the 2024 average. Growth of 1%/mo will occur in the 1st half 2025, then reverse to a slight decline in the 2nd half.
My construction spending forecast for 2025 Nonres Bldgs is only an annual gain of 2%. Low growth is driven by projects ending in Manufacturing and Warehouse. In the last 3 yrs, there were $230bil Mnfg starts, most in 2022, $130bil above normal, now some are ending. Without Manufacturing, Nonres Bldgs 2025 spending would be up 6%. So while outward appearance may be that Nonres spending is declining, in large part it is due to mega spending on Manufacturing buildings (and Warehouse) tapering down upon completion, creating very large annual declines, but normal. See The Manufacturing Spending Taper
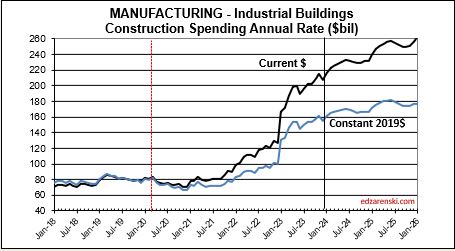
Whenever we get an unusually large increase in new construction starts and spending, the tapering off of those projects leads to a decline in spending in the 2nd half of the scheduled construction. Mnfg new starts peaked in late 2022 – early 2023, so some of these projects would now be in construction for anywhere from 24 to 30 months, well past the midpoint or peak spending. Here’s what the manufacturing spending taper may look like.

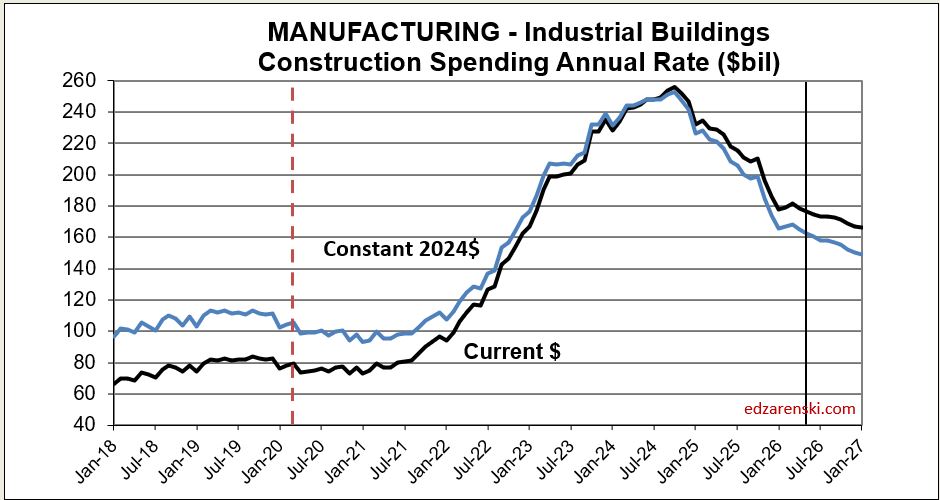
In three years, 2020-2022 Manufacturing new starts increased by over 200%. Now, even projects that started in late 2022 are more than 24 months into construction. Peak spending occurs at the midpoint of a project, so peak spending may already be behind us. The current rate of spending in constant$, with exception of Oct. which jumped 2%, remained near flat for the last 8 months. Mnfg new starts peaked in late 2022 – early 2023, so some of these projects would now be in construction for anywhere from 24 to 30 months, well past the midpoint or peak spending. It appears the slowdown in the 2nd half 2024 may be an indication that spending peaked. Although 2025 spending begins 4% higher than 2024 average, my model indicates the rate of spending drops 10% by midyear and by year-end is down 25% from current spending. I’m forecasting 2025 spending average falls 8.5% below 2024.
See The Manufacturing Spending Taper
This same scenario will occur in Highway/Bridge. Normal Highway starts have consistently been about $100bil/yr, with slow growth. But actual starts were closer to $500bil total for the last three years. This strong growth in starts is expected to continue at least into 2025, totaling near $650bil for four years. Again, consider that part of that is inflation, but the remainder is government investment growth. So a decline from the taper back to normal for Highway/Bridge may not show up at least for the next few years. Once the taper begins it will have the same effect on Non-bldg Infrastructure spending that we will see from Manufacturing in Nonres Bldgs.
Residential spending is 45% SF, 15% MF and 40% Reno. So, only 60% of the total is spending on new housing units. The other 40% is Renovations. Single family construction spending reached a post-2006 high in Q4’21 thru Apr’22. From Apr’22 to the low-point in May ’23 spending dropped 25%. By year-end 2023 it had recovered most of that drop. It fell again in mid-2024, but has since recovered again to the year-end’23 level. Single Family spending is up 7% in 2024 over 2023. Multi-family in Q4’24 is down 10% from Q4’23. Renovations is up 15% from Q4’23 to Q4’24.

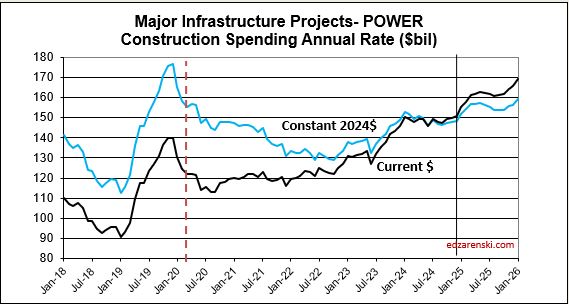
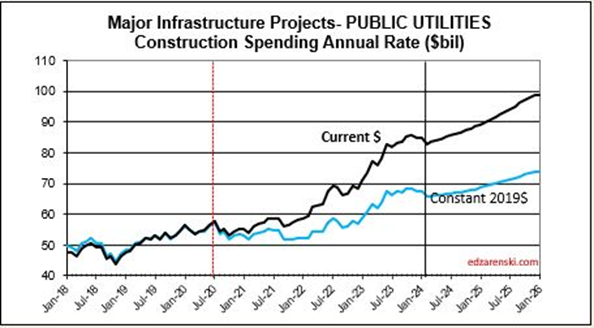
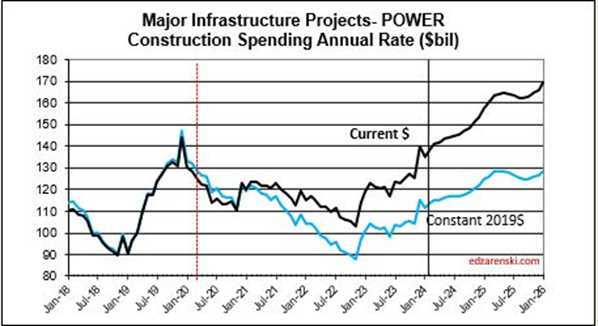
The Non-Building Infrastructure spending forecast for 2025 will be most affected by the fact that Power starts for the last 3 years range from 9% to 11%, Highway new starts range from 8% to 11% and Public Works new starts range from 13% to 17%. Starts have been greater than spending each of the last three years. Backlog increased 10% each in 2023 and 2024 and 9% in 2025. Power spending will increase $13bil (8.5%) in 2025, supported by 22% growth in starts the last 2 years. Public Utilities (Sewage and Waste, Water Supply and Conservation-Rivers-Dams) will increase $12bil (13%), with 30% growth in starts the last 2 years.
The Nonresidential Buildings spending forecast for 2025 is most affected by declines in Manufacturing and Warehouse, and increases in Educational and Data Centers. Starts in 2021 and 2022 increased at an average 14%/yr. But new starts in 2023 were only 5.5%, and in 2024 were only 2.6%. Starts in 2023, and especially 2024, have the most impact on 2025 spending. Backlog is increasing, but the rate of backlog growth has slowed from 15% in 2022 to 5% in 2024 and 2% in 2025. Although Data Center spending is expected to increase 42%, that is $12bil. Educational spending will also increase $12bil, even though that is only 9%.
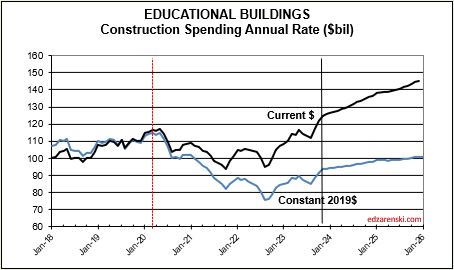
Educational SAAR rate of spending begins 2025 4.5% higher than the average for 2024. Starts are up 18% over the last 2 years. Spending finished 2024 3% higher than it started. The rate of spending is increasing at 0.50% to 0.75%/month for 2025. My forecast is for 9% spending growth in 2025.


Healthcare SAAR rate of spending begins 2025 0.5% lower than the average for 2024. Starts are up 22% over the last 2 years. The rate of spending, increasing since June, is flat in Q1’25, then increases at an average of 1.5%/month for Q2 and Q3 before slowing. My forecast is for 6% spending growth in 2025.
Amusement /Recreation SAAR rate of spending begins 2025 3.0% higher than the average for 2024. Starts are up 18% over the last 2 years. The rate of spending, up 9% from Q1’24 to Q4’24, increases at an average 1.25%/month for 2025. My forecast is for 13% spending growth in 2025.
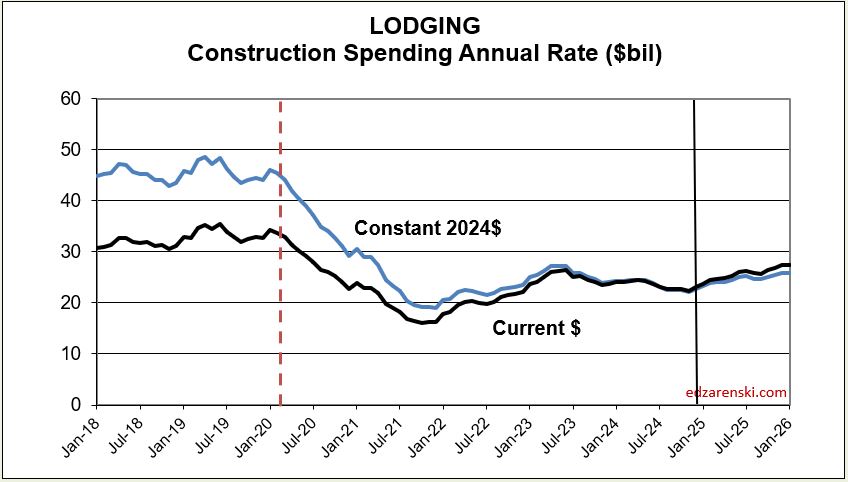
Lodging SAAR rate of spending begins 2025 3% lower than the average for 2024. Starts are up 14% in 2024 and 20% over the last 2 years. The rate of spending, lower in the 2nd half 2024, increases at an average of 1.25%/month for 2025. My forecast is for 9.5% spending growth in 2025.

Office Bldgs w/o Data Centers SAAR rate of spending begins 2025 3.6% lower than the average for 2024. Starts are down 15% over the last 2 years. Spending in the 2nd half of 2024 is down 5% from the 1st half, in fact from Q1’24 to Q4’24, the rate of spending fell 10%. The rate of spending increases 0.5%/mo in Q1’25, but then falls at 0.50% to 0.75%/month for Q2 thru Q4. My forecast is for a 4% spending decline in 2025.

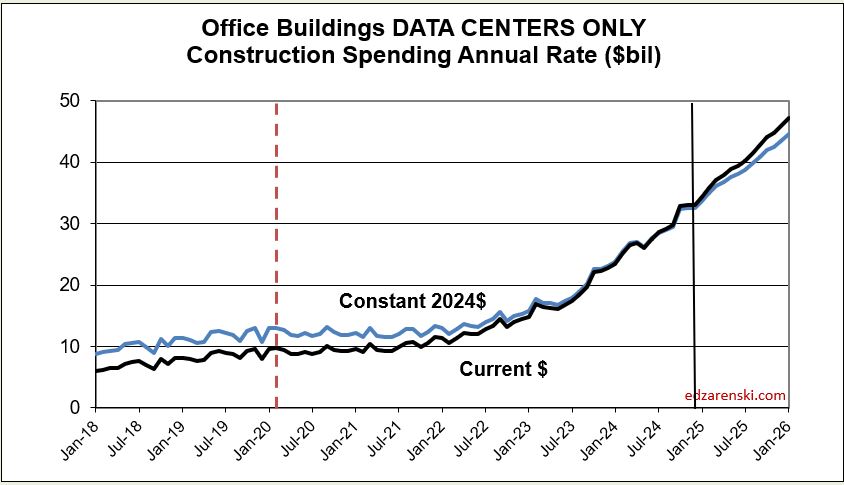
Data Centers SAAR rate of spending begins 2025 16% higher than the average for 2024. Starts are up 120% over the last 2 years. From beginning to end of 2024 spending increased 20%. The rate of spending increases at near 2%/month for 2025. My forecast is for 42% spending growth in 2025.
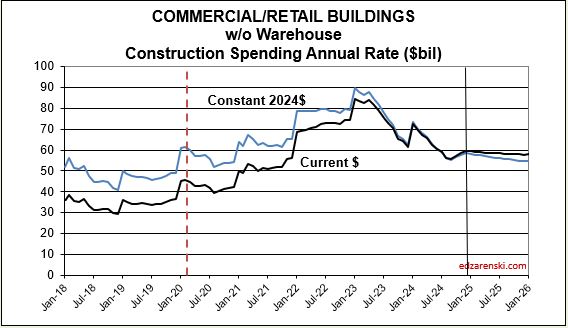
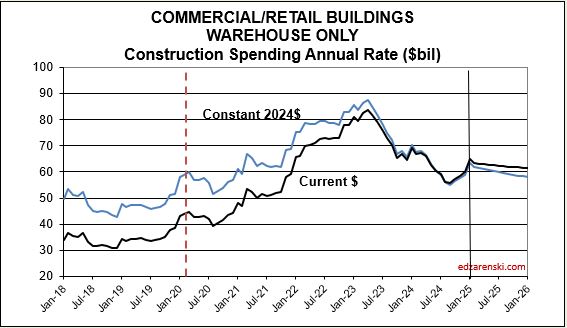
Commercial / Retail Bldgs w/o Warehouse SAAR rate of spending begins 2025 only 1.5% higher than the average for 2024. Starts are down 0.5% over the last 2 years. In 2024, the rate of spending fell 3% over the year. The rate of spending begins 2025 with a slight drop then is flat for the rest of the year. My forecast is for 1% drop in spending in 2025.

Warehouse Bldgs SAAR rate of spending begins 2025 2.7% lower than the average for 2024. Starts are down 17% over the last 2 years. Spending in the 2nd half of 2024 is already down 13% from the 1st half 2024. The rate of spending in 2025 drops at 0.25%/month. My forecast is for 4% spending decline in 2025.
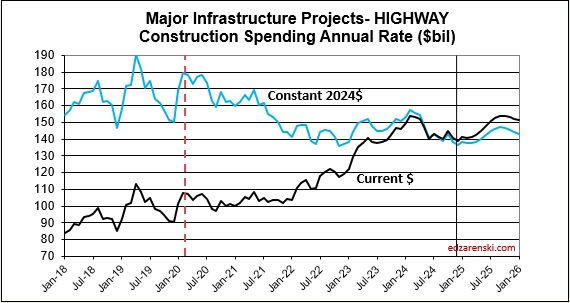
Highway SAAR rate of spending begins 2025 2.9% lower than the average for 2024. Spending fell 7% over the course of 2024, but still finished the year up 4%. Starts are up 18% over the last 2 years. Monthly spending is up and down, but averages 0.8%/mo for the year. My forecast is for 3% spending growth in 2025.
Power SAAR rate of spending begins 2025 2.0% higher than the average for 2024. Starts are up 22% over the last 2 years. 2024 spending finished level with where it started and begins 2025 up 2% over avg. 2024. The rate of spending starts strong at 2%/mo in Q1, then falls back to 0.3%/mo for the remainder of 2025. My forecast is for 8.5% spending growth in 2025.
Public Utilities SAAR rate of spending begins 2025 1.7% higher than the average for 2024. Starts are up 29% over the last 2 years. From Q1’24 to Q4’24, spending increased 9%. The rate of spending slows from 1.5%/mo at the beginning of 2025 to 1%/mo by year-end. Sewage/Waste and Water Supply provide the greatest $ growth. My forecast is for 13% spending growth in 2025.
Transportation SAAR rate of spending begins 2025 4.0% higher than the average for 2024. Starts are up 9% over the last 2 years. Spending finished 2024 6% higher than it started. The 2025 rate of spending starts strong just above 1%/mo, but averages only 0.75%/mo for the whole year. My forecast is for 8.7% spending growth in 2025.

STARTING BACKLOG
Starting backlog is the estimate to complete (in this analysis taken at Jan 1) for all projects currently under contract. The last time starting backlog decreased was 2011. If new construction starts in the year are greater than construction spending in the year, then for the following year starting backlog increases. It’s when new starts don’t replenish the amount of spending in the year that backlog declines.
80% of all nonresidential spending in any given year is from backlog and could be supported by projects that started last year or 3 to 4 years ago. Residential spending is far more dependent on new starts than backlog. Only about 30% of residential spending every year comes from backlog and 70% from new starts.
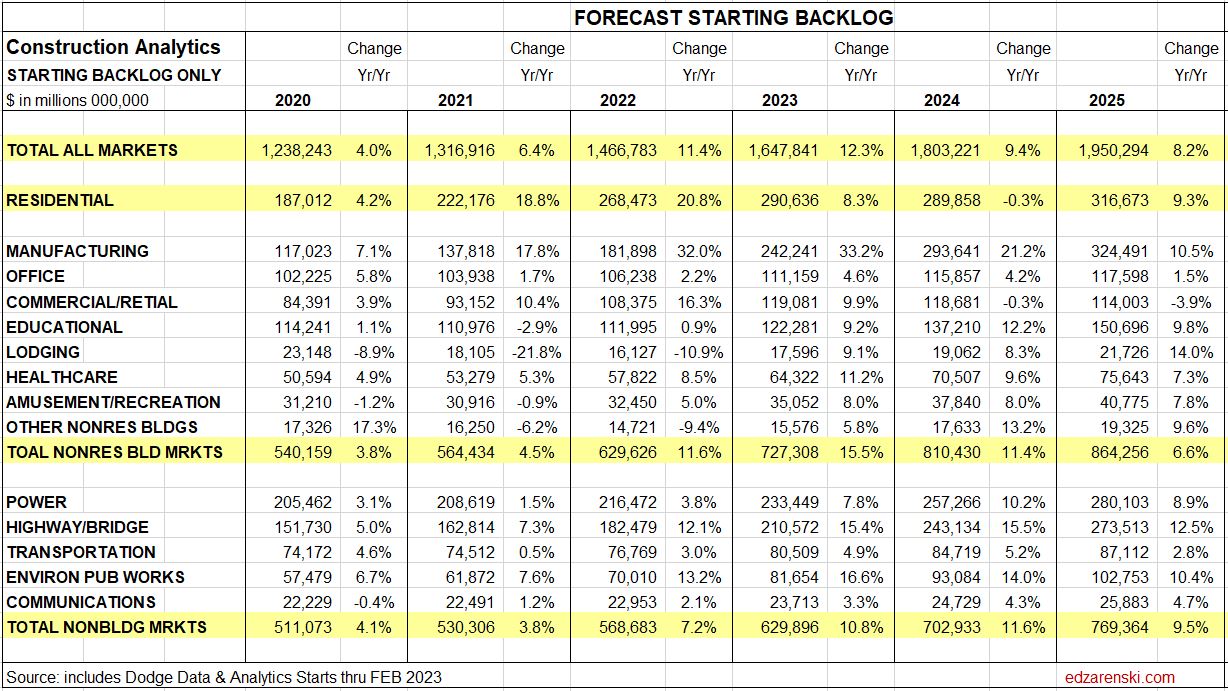
The table below, Forecast Starting Backlog, is model generated by Construction Analytics. Adjusted starts are spread over time to generate cash flow. Spending each year is subtracted from starting backlog and new starts are added to get starting backlog in the following year.

Construction Backlog leading into 2025 in total is up 53% from Jan 2020. Even though several markets are down for the year, every sector (Res, Nonres, Nonbldg) is at all-time high. Since 2020, construction starts have been greater than construction spending, therefore backlog is increasing, but the spread is decreasing. From 2015 through 2019, new construction starts were steady at 4% greater than spending. In 2020, 2021 and 2022, starts exceeded spending by 8%. In 2023 it fell to 6% and in 2024 it was 5%. For 2025, starts are expected to exceed spending by only 3%, indicating the rate of backlog growth is slowing.
Reaching new highs in Backlog could mean not enough labor to support advancing growth so quickly. Future workload from new starts is piling up faster than the current workforce can complete. And the labor force has limitations to how fast it can grow. Nonresidential Bldgs and Non-building posted higher than average starts growth vs spending.
Residential new starts average only 2% greater than spending. Residential new starts in 2023 were lower than spending, so, in 2024, for the first time in 10 years, residential backlog decreased. Even then, residential backlog beginning 2025 is up 61% since 2020. However, these backlog numbers are not inflation adjusted. 45%, or about ¾’s of the 61% residential backlog growth over 5 years is inflation. Real residential backlog growth since 2020 is 16%.
Nonresidential Bldgs starting backlog for 2025 received a boost from all the starts in 2021, 2022 and 2023. Backlog is up 55% from 2020. After 36% inflation, real backlog growth over 5 years is 19%.
Non-building Infrastructure starting backlog was also boosted by strong starts in 2021- 2024. For 2025, backlog is up 49% from Jan 2020. After 38% inflation, real backlog growth over 5 years is 11%.
Manufacturing backlog increased 130% from 2020-2025, from $117bil going into 2020 to $270bil beginning 2025. Prior to tracking Data Centers separately, no other market has ever been close to that growth. But, Manufacturing is 6 times the dollar value of Data Centers. Manufacturing was responsible for 60% of all the Nonres Bldgs spending $ growth in 2023 and 85% in 2024. It was also responsible for 33% of the Nonres Bldgs Backlog growth from 2020 to 2025.
Nonres Bldgs has a total 3.7 million jobs and has never increased by more than 150,000 jobs in one year. Manufacturing is 30% of all Nonres Bldgs spending, so we can assume 30% of Nonres Bldgs jobs. That’s 1.1 million jobs supporting just Manufacturing projects. So Backlog of $270bil, at 5000 jobs per billion per year, would need 1,350,000 jobs for a year. With a 1,100,000 jobs share of the workforce, $270billion in backlog would provide support for 15 months. Of course, new starts add to support throughout the year, but the calculation of how long backlog would support that market segment is valuable.
Likewise, Highway/Bridge has 2025 starting backlog of $240billion and represents 30% of Non-bldg Infrastructure spending, so may occupy 30% of Non-bldg jobs, or 345,000 jobs. But Non-bldg work requires fewer jobs, more like 3,000 jobs/bil/yr, so $240 billion at 3000 jobs/billion/year would need 720,000 jobs for 1 year to complete. Therefore, with a pool of only 345,000 jobs supporting highway work, the backlog of $240billion would provide support for 25 months.
Backlog at the beginning of the year or new starts within the year does not give an indication of what direction spending will take within the year. Backlog is increasing if new starts during the year is greater than spending during the year. An increase in backlog could immediately increase the level of monthly spending activity, or it could maintain a level rate of market activity, but extended over a longer duration. In this case, there is some of both in the forecast. It takes several years for all the starts in a year to be completed. Cash flow shows the spending over time.
NEW CONSTRUCTION STARTS
Total construction starts for 2024 are up 5.3%. Residential starts increased 5.7%.Nonresidential Buildings starts gained 2.6% and Non-building Infrastructure starts are up 8.3%.
Total construction starts for 2025 are forecast to increase 3.8%. Residential starts are forecast to increase 6.1%. Nonresidential Buildings starts are expected to gain 2.5% and Non-building Infrastructure starts will be up only 1.6%.
Residential starts increased 5.7% in 2024. Only about 30% of the spending in 2025 comes from 2024 starts. Most of the spending (70%) in 2025 comes from projects that starts in 2025. This is a result of short duration single-family and renovations projects. Residential starts are expected to increase 6.1% in 2025.
Nonresidential Buildings, starts fell 20% in the 1st half 2023 but still posted the 2nd highest 6-mo average ever. Some of these starts will still be adding to spending into 2025. Nonres Bldgs starts for 2024 gained only 2.6%, due to large declines of 7% to 8% in Manufacturing, Office w/o Data Center and Warehouse, and a moderate 1.2% decline in Commercial / Retail w/o Warehouse. Office w/o Data Center has fallen each of the last 5 years and is down 15% in the last 2 years. Manufacturing starts in 2025 are expected to drop -13%, Office w/o Data Center -4%. Strong growth in new starts in 2025 is expected from Data Centers, Lodging, Healthcare and Public Bldgs (80% of Other Nonres Bldgs). The forecast for Nonres Bldgs new starts in 2025 is +2.5%.
Non-building starts for the 6-mo period Mar-Aug 2023 posted the best 6 months on record, up 30% from the average of 2022. For 2024, Power, Highway/Bridge and Public Works have the strongest gains. These same three markets had the strongest gains in 2023. Power starts are up 22% the last two years. Highway starts are up 19% the last two years. Environmental Public Works are up 29% the last two years and up 50% the last three years. Total Non-building Starts for 2024 are up 8.3%. Non-building starts for 2025 are forecast up only 1.6%.

Data Center starts are up 300% since 2020, up 53% in 2023 and up 44% in 2024, and are expected to increase 27% in 2025. In 2014-2015, Data Centers was less than 5% of total Office+DC construction spending. Today it is approaching 30%. Next year it will approach 40%.
Warehouse starts have dropped 17% in the last two years. Warehouse spending will now slow after climbing 100%+ since 2019. In 2015, Warehouse was 25% of total Commercial spending. By 2022 it had climbed to 54%. In 2025, it will fall back to 45%. But spending will remain near the current level at least for the next three years. Warehouse starts will remain flat in 2025.
Manufacturing starts, the market with the largest $ movement, fell 8.7% in 2024, but still gained 115% from 2019 to 2024. Manufacturing projects can have a moderately long average duration because some of these are multi-billion $ projects and can have schedules that are 4 to 5 years, so some of these projects are still contributing a large volume of spending in 2025. However, as earlier projects begin to taper off, spending will begin to decline.
Manufacturing starts hovered near $80bil/yr from 2014 through 2019. By 2023 new starts had increased to $206bil/yr. Starts fell 9% in 2024 and are predicted to fall by $20bil/yr to $30bil/yr (10% to 15%) over the next three years. Spending is predicted to decline by approx. 10%/yr for the next three years.
Public Works project starts have increased on average 15%/yr for the last four years. Project starts are up 75% in the last four years. Spending is predicted to climb for the next three years.
CURRENT $ SPENDING / INFLATION / CONSTANT $ VOLUME
Volume = spending minus inflation. Spending includes inflation. Inflation adds nothing to volume.
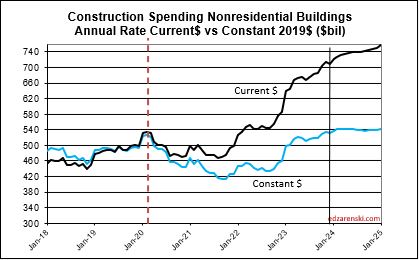
Many construction firms judge their backlog growth by the remaining estimate to complete of all jobs under contract. The problem with that, for example, is that Nonresidential Buildings spending (revenues) increased 14% in 2022, but after adjusting for 12% inflation the actual volume of work was up only 2%. By this method, firms are including in their accounting an increase in inflation dollars passing through their hands. Spending includes inflation, which does not add to the volume of work.
Total volume for 2024 is up 3.1%. Residential +2.7%, Nonres Bldgs +3.3%, Non-bldg +3.5%.
Total volume forecast for 2025 is +1.3%. Residential +2.9%, Nonres Bldgs -1.9%, Non-bldg +3.0%.
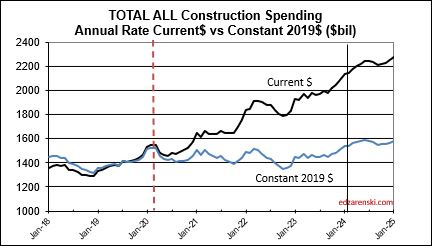
Since 2019, spending has increased 55%. Volume has increased only 10%. The difference is inflation.
Inflation adjusted volume is spending minus inflation, or to be more accurate, spending divided by (1+inflation). Inflation adds nothing to volume growth. The following table shows spending, inflation and volume (spending without inflation) for each year. Spending is current to the year stated. The values in the constant table are indexed to a constant value year, now using 2024. This shows business volume year to year, can be a lot different than spending would indicate. When inflation is positive, volume is always less than spending by the amount attributed to inflation.
Caution: the following table, showing Constant$ analysis, now shows Constant$ with base year at 2024. Since Q1-2020 I have used the base year at 2019. This update changes the Constant$ amount, but not the Constant$ percent growth. Slight changes in prior years inflation resulted in some minor changes in Constant$ growth.

Spending during the year is the value of business volume plus the inflation on that volume. When inflation is 12%, volume plus 12% = total spending. Revenue is generally measured by spending put-in-place during the year. Therefore, Revenue does not measure volume growth. In 2022, Nonresidential buildings inflation was 12%, so business volume was 12% less than spending, or 12% less than revenue. Residential volume was 15% less than spending.
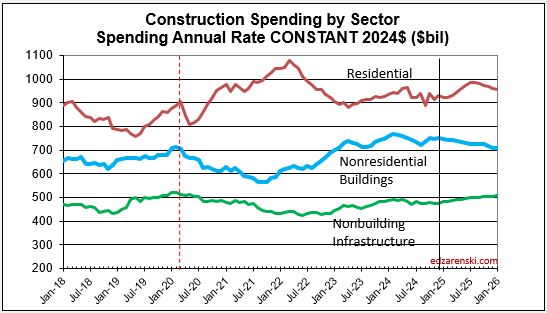
Construction spending includes inflation, which adds nothing to the volume of work put-in-place. Construction Volume is a measure of business activity. It eliminates inflation as a variable and shows Constant$ growth. As an example, 2021-22 posted some of the biggest spending increases we’ve seen in 20 years, up over 25% in two years. But, if you look at the bottom row in the table above, we see constant$ growth, or volume, increased only 1.6% in those two years. The inflation rates for those years confirms that almost all of the spending increases were inflation, not added business volume. Construction volume, (spending minus inflation) will finish 2025 up 1.3%, but up only 12% since 2019.

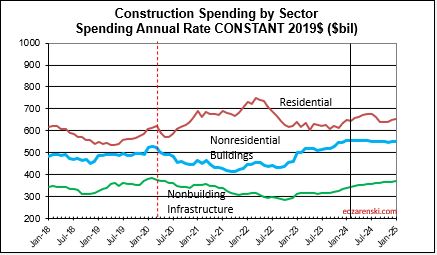
Compare this following Spending by Sector Constant$ plot to the Sector Current$ plot at the beginning of this article.
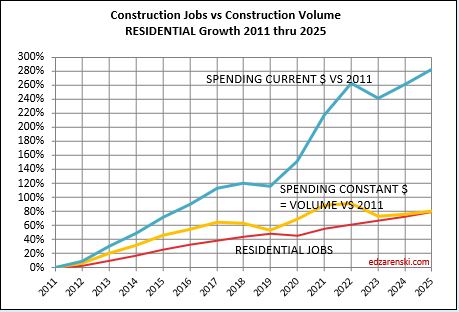
CONSTRUCTION JOBS
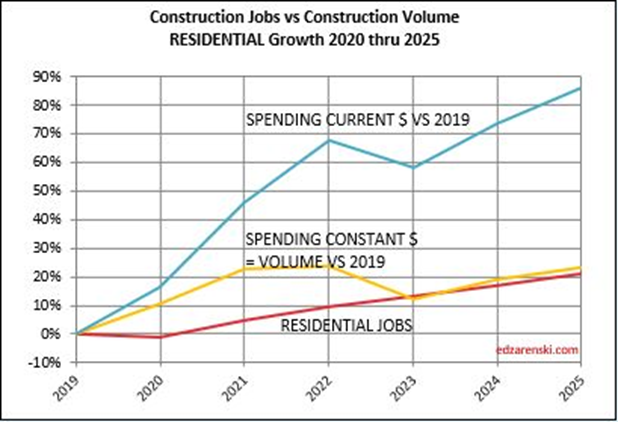
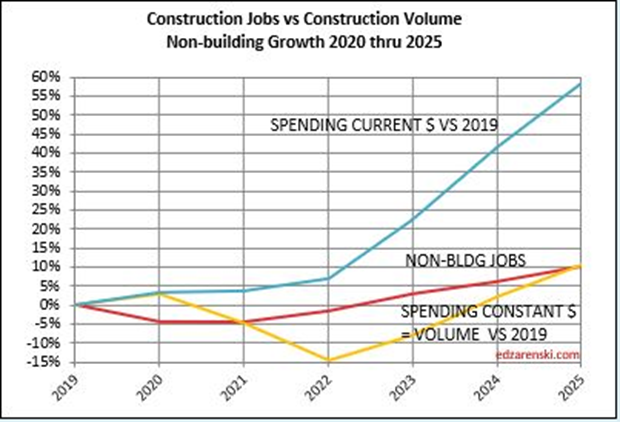
Construction Jobs should not get compared to construction spending. Spending includes inflation, which adds nothing to business volume. Compare Jobs growth to Volume growth. If volume is declining, there is little to no support to increase jobs. And yet, we’ve seen historically that jobs increase at an approximately 3.5%/yr, even when volume does not increase.

Construction Jobs increased 204,000 jobs or 2.5% in 2024. There are currently 8,291,000 construction jobs reported by BLS. The largest annual increase post 2010 is 321,000 jobs (+4.6%) in 2018. The average jobs growth post 2010 is 200,000 jobs per year.
From 2012-2019, we added an annual average 245,000 jobs/yr (+3.9%). From 2021-2024, we added 240,000 jobs/yr (3.1%). In 2024 we added only 204,000 jobs (2.5%). Since 2011, there have been only 3 years in which we added fewer than 200,000 jobs, 2012, 2020, 2021. Also, since 2011, there have been only 3 years in which we added more than 300,000 jobs, 2015, 2018, 2022. Seldom do jobs increase by 400,000 or by 5%/yr. Excluding down years, since 2012, average annual growth is 3.6%/yr.
Here’s an enlarged view of just Jobs/Volume. Removing Spending enhances the vertical scale.

From 2012-2019, we added an annual average 245,000 jobs/yr (+3.9%). From 2021-2024, we added an average of 240,000 jobs/yr (3.1%). In 2024 we added only 204,000 jobs (2.5%). Since 2011, there have been only 3 years in which we added fewer than 200,000 jobs, 2012, 2020, 2021. Also, since 2011, there have been only 3 years in which we added more than 300,000 jobs, 2015, 2018, 2022. Seldom do jobs increase by 400,000 or by 5%/yr. Excluding down years, since 2012, average annual growth is 3.6%/yr.
January jobs report shows we added 4k jobs in Jan, but the unemployment rate went up from an average 4.7% in Q4 2024 (5.2% in Dec), to 6.5% in Jan.
3-7-25 Construction gained 19k (+0.2% mo/mo) jobs in Feb, BUT total hrs worked fell -0.3%. Total jobs have increased but hrs worked has gone down in each of the last 5 months. We’ve posted minor jobs gains in both Jan and Feb, and yet unemployment has gone up from 5.2% in Dec to 7.2% in Feb.
The unemployment rate in construction goes UP in the 1st qtr every year, by at least 2% to 3% (data since 2011). Now, your 1st thought may be, if unemployment is increasing, that is probably because jobs are falling. Well, construction has ADDED jobs in the 1st qtr. every year since 2011 (excluding 2020), by an avg of nearly 30% of all jobs added annually. Construction unemployment is not going up in winter months because we lose jobs in winter. So how can the unemployment rate still go up? The numerator (jobs) is increasing. There’s only one number left in the equation, the denominator (workforce). The result goes up because the entire workforce increases. In this case, the workforce is increasing by greater than the number of jobs added. So, when the unemployment rate increases in Q12025, don’t assume it is because we are losing jobs.
The plot below shows how consistent jobs growth has been over the last 14 years. After the 2020 dip, the slope (annual rate of growth) of jobs growth is about the same as Jan2011-Jan2020. Jobs increase at about 3.5%/yr to 4%/yr., regardless of what volume is doing. In fact, since 2016, the last time volume increased by more than 4%, jobs are up 22%. Volume is up only 11%.

Since Jan 2011, average jobs growth is 3%/yr. Average volume of work growth since 2010 is 2.3%/yr. This plot above shows Jobs and Volume growth closely match from 2011 to 2018. With few exceptions for recession periods, this pattern can be seen throughout the historical data.
What’s remarkable about the growth is this; since 2016, spending has increased 77%, volume after inflation increased only 11% and jobs increased 22%. Volume and jobs should be moving together.
It takes about 5000 (Nonres) jobs to put-in-place $1 billion of volume in one year. It could easily vary from 3000 to 5000, depending on the type of work. So, on average, an add of $100 billion+ of Nonres Bldgs in one year would need 500,000 new jobs. Jobs should track volume, not spending growth. Volume = spending minus inflation. Normal construction jobs growth is about 250,000 jobs per year and maximum prior annual growth is about 400,000.

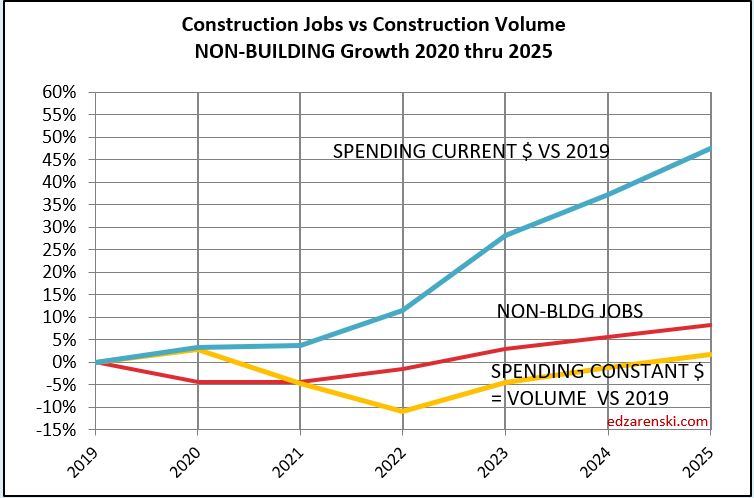
Non-building, over the next two years, could experience the same kind of growth spurt as Nonres Bldgs., a forecast increase in volume the next two years without an equal increase in jobs. Volume which was lower than jobs since 2021, is now increasing faster than jobs. Non-bldg volume is forecast up 6% to 8%/year the next 3 years. Jobs increase at an avg. 3.5%/year.
Residential volume has exceeded residential jobs all the way back to 2011. The recent decline in volume brings the two even, if the jobs hold the pace.

For as long as I can remember, the construction industry has been complaining of jobs shortages. And yet, as shown in the data mentioned above, jobs have increased greater than volume of work. With an exception for recession years, (2007-2010 and 2020), jobs increase at a rate of 2.5% to 3% per year. The greatest disparity between jobs and volume occurred in late 2022, when jobs growth had already resumed normal pace, but volume of work was still reeling from the effects of new construction starts that were canceled dating back to late 2020 and early 2021. Recent volume growth at a much faster rate than jobs growth is now closing the gap.
For the 4yr period 2021 thru 2024, jobs are up 13%, but volume of work put-in-place is up only 6%.
Don’t be surprised if 2025 construction jobs growth slows a bit. Jobs are slightly ahead of volume growth, particularly in the Non-building Infrastructure sector. Since 2019, both Jobs and Volume increased 10%. But that includes 2020, when volume increased 4% but jobs fell by 250k, or 3%.
When jobs increase without an equal increase in the volume of work, productivity declines. This recent increase in volume and the projected increase in volume in 2024, several points stronger than jobs, will offset some of the disparity which has been negative for a long time.
The Harvard Joint Center for Housing Studies recently posted that In Texas, California, New Jersey, and the District of Columbia, immigrants make up more than half of construction trade workers. This analysis will make no effort to discuss the potential impact of immigrants in the workforce, but we must recognize the makeup of who is filling these jobs. Keep in mind after this analysis reaches some conclusions that this aspect may weigh heavily on the outcome.
INFLATION
To properly inflation adjust the cost of construction, use a Final Cost Inflation Index.
General construction cost indices, that do not address labor, productivity or margins and Input price indices, don’t reflect whole bldg final cost and therefore do not capture the full cost of escalation in construction.
Final cost indices represent total actual cost to the owner and are usually higher than general indices. Producer Price Index (PPI) INPUTS to construction reflect costs at various stages of material production, may not represent final cost of materials to the jobsite and do not include labor, productivity or margins. That’s why a PPI Inputs index +20% for a material could be only a +5% final cost. PPI Final Demand indices include all costs and do represent actual final cost.
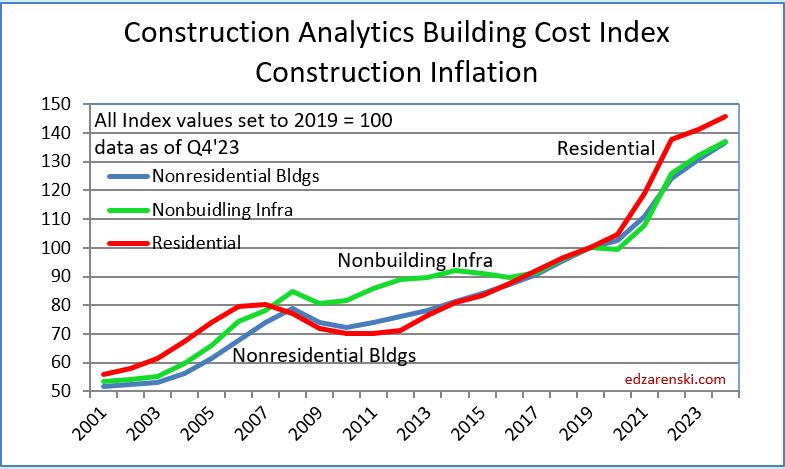
Construction Analytics Building Cost Index is a weighted average of eight final cost indices.
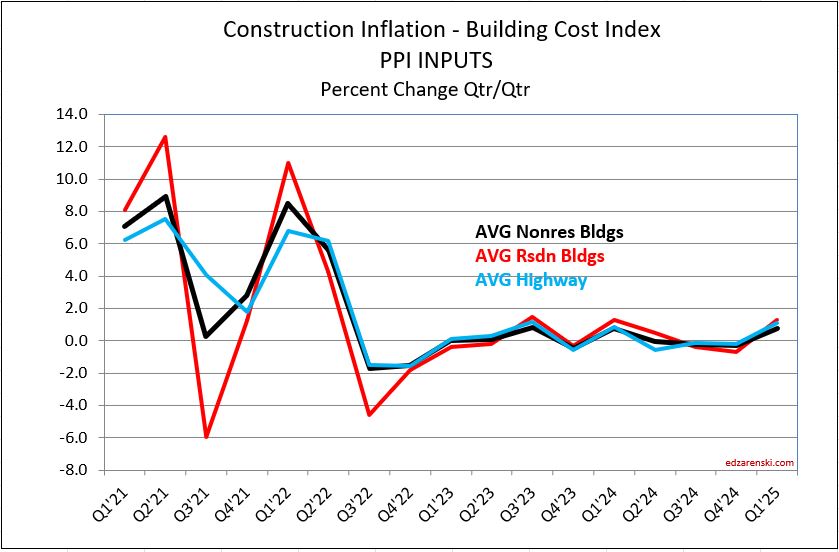
The following Construction Inflation plot (for Nonresidential Buildings only) shows three elements: 1) a solid grey bar reflecting the max and min of the 10 indices I track in my weighted average inflation index, 2) a solid black line indicating the weighted average of those 10 indices, and 3) a dotted red line showing the Engineering News Record Building Cost Index (ENR BCI). Notice the ENR BCI is almost always the lowest, or one of the lowest, indices. ENR BCI, along with R S Means Index, unlike final cost indices, do not include margins or productivity changes and in the case of ENR BCI has very limited materials and labor inputs.

The solid black line (above) represents the Construction Analytics Building Cost Index for Nonresidential Bldgs and is a final cost index.
This short table shows the inflation rate for each year. Useful to compare to last year, but you would need to mathematically do the compounding to move over several years. The plot below shows the cumulative inflation index, or the cumulative compounded effect of inflation for any two points in time.
30-year average inflation rate for residential and nonresidential buildings is 4.1%. But when excluding deflation in recession years 2008-2010, for nonresidential buildings the long-term average is 4.7% and for residential is 4.9%. For Non-bldg Infrastructure the 30-year average is 3.6%. When excluding deflation in recession years 2008-2010, Non-bldg long-term average inflation is 3.9%.
Since 2011, Nonres Bldgs inflation is 4.8%, Residential is 5.4% and Non-bldg is 4.3%.
Reference Inflation Data Construction Inflation 2024

Construction Analytics Nonres Building Cost Index is a weighted average of eight final cost indices. It is compared below to the PPI Inputs (not final cost) and PPI Final Demand (yes final cost).

Final cost indices represent total actual cost to the owner and are usually higher than general indices.
Producer Price Index (PPI) INPUTS to construction reflect costs at various stages of material production, generally do not represent final cost of materials to the jobsite and do not include labor, productivity or margins. Even with that, a PPI Inputs index +20% for a material could be only a +5% final cost. PPI Final Demand indices include all costs and do represent actual final cost.
We can’t always tell what affect changes in the cost of construction materials will have on the final outcome of total construction inflation. PPI materials index does not account for productivity or margins and varies on stage of input.
Jan’25 Inputs are up, +0.8% to Nonres, +1.2% to Residential and 1.2% to Highway, the largest increases since Jan’24. The largest Input item increases in January are Paving Mixtures (up 14.6%), Diesel Fuel (up 3.6%), Concrete Brick, Block & Pipe (up 2.2%), Copper & Brass Shapes (up 1.9%) and Flat Glass (up 1%). Steel Pipe & Tube is down 1.3%. Both Lumber/Plywood and Fabricated Structural Steel are down 0.5% or less.
The PPI Final Demand index (for Nonresidential Bldgs only) is one of several that does account for labor and margins, hence it is defined as a final cost index. In this plot, Jan’25 closes out Q4’24. Total growth in 2024 was only 0.4%.

A Check on Measuring Methodology
And finally, here’s one of the markers I use to check my forecast modeling, my forecasting performance tracking index. The light plot line is forecast predicted from my modeling. The dark plot line is actual construction spending. Even after any separation in the indices, the plots should move at the same slope. Almost without fail, the forecast model, estimated spending from cashflow, predicts the changes in direction of actual spending. The nonresidential buildings plots (and the residential plot prior to 2020) are remarkably close, providing an indication the method of analysis employed, cash flow of all construction starts to get spending forecast, is reasonably accurate.

Note the divergence of residential in Jul-Dec 2020. Actual residential spending finished much higher than predicted. Even the cash flow from an all-time high in new residential starts does not predict spending to increase so rapidly. But residential project spending was fully back to prior levels by August 2020, within 3 months from the May 2020 bottom. In 3 months, the actual spending pushed 15% higher than starts predicted. A part of the spending was the resumption of delayed projects, but another big part was renovations, which surged, and reno is 40% of all residential spending.
Construction Inflation 2025 – 2-21-25 PPI data, INDEX TABLES, Inflation History
Construction Briefs – As We Begin 2025 jobs and unemployment, PPI and tracking edz
Construction – Brief Thoughts Dec’24 thoughts on jobs and when spending mega ends
Compare 10 Construction Forecasts Jan 2025 Jan and Midyr Forecasts compared to actual at end of yr
The Next Forecast Challenge written Apr 2023. Nonres volume did climb much faster than Jobs.
This analysis does not take into consideration the inflation impact of a recession or significant new tariffs. Nor does it assume losing any portion of the workforce to deportation. These are all possible. Construction starts may be negatively affected, and if so, then construction spending will also be affected. Some business will be negatively affected. All will lead to higher inflation.
You can print the Summary report by selecting/printing just the first 5 pages.
The Manufacturing Spending Taper
11-21-24 My construction spending forecast for 2025 Nonresidential Bldgs is down 1.5%. But this decline is driven by projects ending in Manufacturing. In the last 3 yrs, there were $230bil Mnfg new starts, most in 2022, about $130bil above normal for 3yrs. Now some are ending. Without Mnfg, Nonres Bldgs 2025 spending would be up 4.5%. (This original article written 11-21-24)
(edit 4-15-25 only to update forecast. Mnfg data has not changed) Construction spending for 2025 Nonres Bldgs is forecast up 2.9%. Manufacturing is expected to fall 9%, from $233bil in 2024 to $212bil in 2025. Mnfg is forecast to drop to $174bil in 2026. Without Mnfg data, Nonres Bldgs 2025 spending would be forecast up 8.2% in 2025. Tariffs and/or recession would (will) lower this forecast.
Now, let me clarify. The spending I reference is Census PIP current$ spending. It doesn’t matter if we look at current$ or constant$ (inflation adjusted), by the end of 2025 spending on Mnfg bldgs will be down 25%. The new starts above are those reported by a firm that tracks construction starts. But, only about 40% of actual starts are captured in that number. Real Mnfg starts over last 3yrs is just over $600bil, whereas normal starts without any influx of government investment would be about $300bil/3yrs. Most of those starts were posted from Q3’22 thru 2023. By far the highest period of new starts was the 2nd half 2022. About $100bil of that spending growth over the 3 years is inflation, leaving the remainder of about $200bil in excess (but welcome) spending growth attributed to government investment.
Mnfg projects can have a longer spending curve (on average) than most nonres bldgs, so obviously end dates are pushed out further. The average spending for all nonres bldgs is spread out over a spending curve of approximately 20:50:30, where 20% of all the starts in the year gets spent in the year started, 50% in the 2nd year and 30% over the 3rd and 4th yr. The spending curve for Mnfg is more like 17:40:30:13. We will see declining spending from this pool that will impact total nonres bldgs spending at least for the next 2-3 years.
So while the outward appearance in the data may be that nonres spending in total is declining, in large part it may be due to mega-spending on mnfg bldgs tapering down upon completion, creating large, but normal, annual declines. This may have the effect of offsetting gains in other nonres bldgs markets. That influx of spending is unlikely to be repeated. So, as we see mnfg spending begin to taper off, we should not expect additional support from new mnfg starts. We should expect mnfg starts to return to a more normal growth rate.
edited 2-4-25 added next paragraph and following Mnfg spending plot
Whenever we get an unusually large increase in new construction starts and spending, the tapering off of those projects leads to a decline on the tail end of the timeline. Peak spending was near the midpoint of projects, so after that it’s all declining. Mnfg new starts peaked in 2022-2023. Here’s what the manufacturing spending taper may look like.

edited 4-11-25 added Warehouse Plot and text
This is exactly what happened in Warehouse spending. Warehouse contract starts began to rise in 2020, but rose rapidly in 2021 and 2022. Therefore, the rate of spending began to rise in late 2020, then rose substantially from late 2021 well into 2022, when project spending would have been expected to peak. New starts began to fall back in 2023 and more-so in 2024. Peak spending was reached in Q1 2023 and spending has fallen in 18 of the last 24 months. The current rate of spending is now back to the level of 2021.
This same scenario will occur in Highway/Bridge. Normal starts have consistently been about $100bil/yr, with slow growth. But for the last 3 years, actual starts were closer to $500bil for the 3 years. This strong growth in starts is expected to continue at least into 2025, totaling near $650bil for 4 years. Again, consider that part of that is inflation, but the remainder is government investment growth. So a decline from the taper back to normal for Highway/Bridge may not show up at least for the next few years. But once the taper begins it will have the same effect on Nonbldg Infrastructure spending that we will see from Mnfg in Nonres Bldgs.
If you know in advance what to expect, there should be no surprises when it occurs.
7-1-2026 updated to include this 2026 plot of Manufacturing spending, mirroring the one above original to this post. Looks to me I had it forecast pretty on the nose. In each respective chart everything to the left of the vertical black line is actual$. Everything to the right is forecast. 18 months ago I forecast the spending would drop and at this rate of decline.

Construction Data MAR Briefs 5-5-24
Updates to Forecast, spending, starts, inflation, jobs
SEE ALSO Construction Analytics Outlook 2024
A side note, before I begin with the economic data, sometime within the next few weeks, I expect by May 31st, this blog will record the 1,000,000 view. Nearly 500,000 people read on average 2.1 articles every visit. Inflation articles draw the most attention, with a read rate of about 1000 times a week on a slow week and 2,000 on a busy week. Thank you to all my visitors. Keep reading!
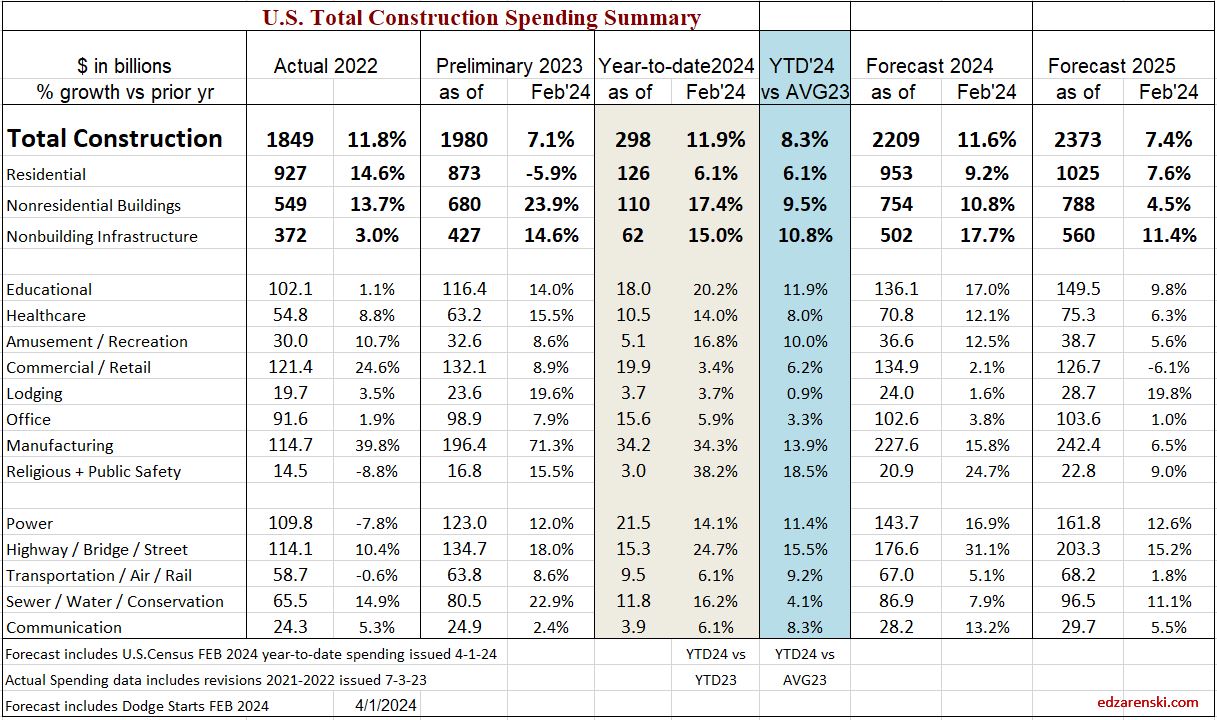
2024 construction spending will be measured to the avg of 2023, $1980 bil. The average Seasonally Adjusted Annual Rate (SAAR) for 2023 is the total spending for 2023, but is was lower in Jan and higher by Dec. By Dec the SAAR was already 6% higher than the average for 2023. So we began 2024 with Dec spending at a SAAR 6% above avg 2023.
As of MAR, the total SAAR is 8.1% above 2023. Rsdn is +5.4%, Nonres Bldgs +10.0%, Nonbldg +10.8%. If growth stalls at the current level for the rest of the year, meaning, if we were to end the year with the SAAR unchanged from today, then we would finish with these gains for 2024. The trend in most cases is up, so I expect end of year we will be a little higher than today.
5-24-24 Construction Starts $. Even though Nov and Mar were low, the last 9 months of Nonresidential Bldgs new starts $ was by far the 2nd strongest period of new Nonres Bldgs starts on record, averaging an annual rate (SAAR) of $435 bil. Best since 2nd half 2022 (avg $490 bil.). The last 9 months of Residential $ starts (annual avg $395 bil.) was the best since 1st half 2022 (avg. $438 bil.).
2024 construction spending for Nonres Bldgs, as of MAR, measured to the 2023 avg, is now up +10.0% and trending up. We began 2024 with Nonres Bldgs Dec spending at a SAAR 6% above avg 2023. The American Institute of Architects (AIA) Consensus for Nonres Bldgs, published at the beginning of the year, averages +4% growth over 2023. Only one of the 10 forecasts for Nonres Bldgs spending in the AIA 2024 Consensus is still above the current reading. So, I think it’s safe to say, the AIA Consensus was low right from the very start.
The trend in Nonres Bldgs construction spending is up 18 of the last 19 months and continues up for the next 12 months. To fall to the AIA Consensus average of +4% for the year from the current SAAR, up +10.0%, the remaining 9 months of 2024 would need to fall from the current +10% to average only +2% higher than 2023. It may not be apparent, but that is a continuous decline of more than 1.5% every month for the next 9 months. That’s like falling off a cliff next month and not being able to get up. That’s unrealistic. Unless something sets off a deep recession similar to 2009, that will not happen.
At the beginning of 2007-2010, the first sign of recession for construction was a decline in 2007 of 25% in residential starts. Then in 2008 residential starts fell 40%. In 2009, both residential starts and nonresidential buildings starts fell 30%. Nonbuilding starts fell only 6%. By 2010 starts were increasing. But spending lags starts. Residential spending fell 60% from 2006 to 2009. Nonresidential buildings spending fell 33% from 2008 to 2010.
Although nonres bldgs starts fell 18% in 2020 and residential starts fell 11% in 2023, neither led to a devastating drop in spending as recovery occurred quickly. There is nothing in the current outlook to indicate recession, on any horizon. This forecast does not anticipate a recession.

Since the end of 2019, (in Dec 2019 spending hit $1,464T) total construction spending as of MAR’24 is up 46%. After inflation, Volume is up only 6%. The real Volume of Business is spending minus inflation. More than 85% of the spending growth since Dec. 2019 is inflation. If current projections hold, the total business volume through year 2024 will have grown 10% since 2019. ALL business plan forecasts and labor demand should be based on this 10% growth. Inflation adds nothing to business volume.


Over the last 9 months, residential new starts (as reported by Dodge) averaged the highest since the peak high in the 1st half of 2022. For Q1’2024, residential starts are 27% higher than Q1’2023. Currently, residential starts for 2024 are averaging 8% higher than the total in 2023. Residential spending peaked at an all-time high in Q2’22. Spending has been level or increasing the last few months at a rate 6.5% lower than the peak, but at a rate 55% higher than Dec 2019. Due to the short durations in residential building, fluctuations in starts are more quickly apparent in spending. Expect both nominal and real (inflation adjusted) spending to continue increasing thru the 1st half 2024, then drop back slightly in the 2nd half 2024. Spending is expected to increase 7% in 2024 over 2023. Volume after inflation should grow 3%.
Single Family spending YTD through Mar. is up 16% from Q1’2023. Single Family rate of spending through Mar. is up 11% over the average (total) spending in 2023. Multi-family spending for Q1’24 is up 6% from Q1’23 and is 2.5% lower than peak spending in Aug ’23, however it’s still up 1% over the avg spending in 2023. These are all nominal values, so real growth is lower. But residential inflation for 2023 was only 3%, so not much lower.


An avg spending curve for long-duration Non-bldg Infra is 15:30:30:20:5. The greatest spending impact does not show up until year two and three after the year in which the projects start. Example: If 2024 posts $100bil in new starts for Infrastructure, only $15bil of that gets put-in-place in 2024. $30bil would get put-in-place in 2025 and 2026.

Plots below compare volume growth to jobs growth. Notice the slope of the increase in jobs is fairly constant, regardless of changes in volume growth.
In the past 18 months, Nonresidential Buildings construction spending increased 37%. Nonres Bldgs JOBS increased only 7%. Normally, this would be explained by inflation, but in this case after adjusting for inflation volume still increased 28%. 18 months, +28% volume, +7% jobs.
Jobs and volume of work should be moving together, evenly. The construction industry has been saying jobs shortages, and yet over an 18mo period, the nonresidential bldgs sector added 20% more volume of work than added jobs. Seems to me that would indicate that volume was absorbed by existing jobs. If there were a significant jobs shortage, either the existing crew would need to work overtime, hours worked would have increased, or the work would not have been put-in-place and would potentially have been delayed or postponed. Neither happened. The fact that the work was put-in-place would indicate that the existing workforce readily absorbed the excess workload.


Since 2016, TOTAL construction spending has increased 63%, but after inflation, business volume increased only 6%, or 1%/yr. From 2016 to 2023, jobs increased 2.5%/yr. When jobs are increasing at a greater rate than the volume of work, productivity is declining. That is shown on these plots when the jobs line is above the volume of work line. Volume and jobs should be moving together.
In 2024, construction volume may increase 6%. Don’t expect jobs to increase 6%.

Since 1980, the fastest rates of growth in construction jobs were 1983-85 avg 6.0%/yr. and 1994-99 at 5.4%/yr. All other plus years averaged +3.2%, with only six years above 4%.
Since 2000, (excluding negative yrs, all associated with recessions) construction jobs growth is 3.3%/yr. and average real volume growth is 3.4%. I would expect future jobs growth to remain within the historical averages, somewhere in the 3%-5% range.

Construction Data FEB Briefs 4-3-24
Updates to Forecast, spending, starts, inflation, jobs
SEE ALSO Construction Analytics Outlook 2024
2024 construction spending will be measured to the avg of 2023, $1980 bil. The average Seasonally Adjusted Annual Rate (SAAR) for 2023 is the total spending for 2023. By Dec the SAAR was already 6% higher than the average for 2023. So we begin 2024 with Dec spending at a SAAR 6% above avg 2023.
As of Feb, the SAAR is 8.3% above 2023. Rsdn +6.1%, Nonres Bldgs +9.5%, Nonbldg +10.8%. If growth stalls here for the year, if we were to end the year with the SAAR unchanged from today, then we would finish with these gains for 2024. The trend in most cases is up, so I expect end of year we will be higher than today..
2024 construction spending, as of FEB, measured to the 2023 avg for Nonres Bldgs, is now +9.5% and trending up. The American Institute of Architects (AIA) Consensus for Nonres Bldgs averages +4%. Only one of the 10 forecasts for Nonres Bldgs spending in the AIA 2024 Consensus is still above the current reading.
The trend in Nonres Bldgs construction spending is up 17 of the last 18 months and continues up 9 of the 10 remaining months in 2024. To come close to most of the forecasts in the AIA, Nonres Bldgs spending for next 10 months of 2024 would need to decline drastically. To fall to the AIA Consensus average of +4% from the current SAAR, up +9.5%, all of the remaining 10 months of 2024 would need to fall from +9.5% to only +3% higher than 2023. Unless something sets off a recession, that will not happen.
Since 2019, spending is up 42%. But after inflation Volume is up only 5%. Almost 90% of the spending growth since 2019 is inflation.

Construction Backlog, the amount of work under contract that is yet to be put-in-place, increased 9% to begin 2024. Nonres Bldgs and Nonbldg both increased over 11%. Although spending is at an all-time high, backlog increases if new starts exceed spending for the year. That could happen if spending decreased, but that is not the case here. It shouldn’t come as a surprise, but manufacturing construction backlog to begin 2024 is up 21%. Highway is up 15%. Environ Pub Works is up 14%.
Don’t try to correlate my Backlog calculation to the Associated Builders and Contractors (ABC) Backlog Indicator. They do not measure the same thing. ABC BI measures current backlog as a percent of previous fiscal year revenues, then multiplies that x12 to get what they refer to as the current remaining backlog months of support. I measure the backlog as the value under contract remaining to be completed at the start of this year compared to the backlog at the start of last year.
Neither of these give any indication of WHEN backlog gets spent. Backlog is never an indication of the amount of work to be completed in the given year. Some backlog gets spent over long duration projects that may go yet for several years.


An avg spending curve for long-duration Non-bldg Infra is 15:30:30:20:5. The greatest spending impact does not show up until year two and three. Example: If 2024 posts $100bil in new starts for Infrastructure, only $15bil of that gets put-in-place in 2024. $30bil would get put-in-place in 2025 and 2026.
Manufacturing construction spending increased 80% in the last 18 months. After inflation volume increased 70%. Mnfg is 30% of all Nonres Bldgs spending, but generated 60% of the increase in Nonres Bldgs spending over the last 18 months.

In my forecast, every major sector ticks up each of next 3mo. All markets tick up each of Feb-Mar-Apr, except for Commercial/Retail. Warehouse starts, which comprise 60% of Comm/Rtl, fell 20% in 2023 and are forecast down 10%+ in 2024.

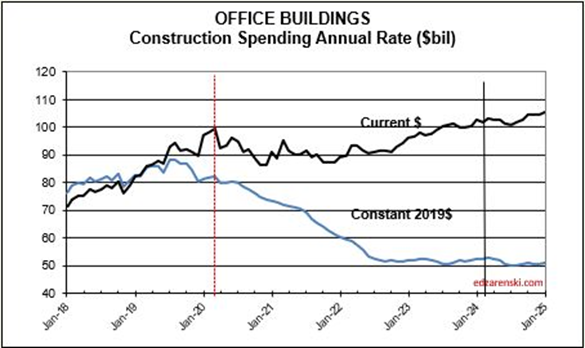
Looking at the Office Bldgs plot, keep in mind, the Office Bldg market includes Data Centers, where spending has increased.

In the past 18 months, Nonresidential Buildings construction spending increased 37%. Nonres Bldgs JOBS increased only 7%. Normally, this would be explained by inflation, but in this case after adjusting for inflation volume still increased 28%. 18 months, +28% volume, +7% jobs.
Jobs and volume of work should be moving together, evenly. The construction industry has been saying jobs shortages, and yet over an 18mo period, the nonresidential bldgs sector added 20% more volume of work than added jobs. Seems to me that would indicate that volume was absorbed by existing jobs.
In 2023 Nonresidential Building construction jobs increased 3.6%. In that same time Nonres Bldgs spending increased 24%. After inflation volume of business increased 17%. I wouldn’t be surprised if construction job openings remain elevated all through 2024.

Since 2016, construction spending has increased 63%, but after inflation, business volume increased only 1%/yr. From 2016 to 2023, jobs increased 2.5%/yr. Volume and jobs should be moving together.
In 2024, construction volume may increase 7%.
Construction Jobs increased every month since last Mar. In fact, there’s been only 2 down months in last 2 yrs. But in both Dec and Jan, avg hrs worked fell more than jobs added, so total hrs worked declined. Overall avg hrs worked for 2023 is up 4%. Volume is increasing.


Construction Analytics Outlook 2024
Construction Analytics Economic Outlook 2024 includes Construction Data – DEC 2023 Data 2-7-24
2-22-24 At the bottom of this article is a downloadable PDF of the complete 2024 Outlook
Here is a summary of construction spending through December 2023, Inflation through 4th qtr. or Nov where available, and resulting constant dollar volume. 2023 spending will be revised three times in 2024, Mar1, Apr1 and Jul1, and then again on Jul1 2025. Historically, almost all revisions are up.
Construction spending preliminary total for 2023 is up 7.0%. But nearly 80% of that total is inflation. Except for Nonresidential Bldgs, spending increased 23%, so inflation is only 25% of that. Even deducting inflation still leaves 75% of spending as volume growth Most of that growth is in Manufacturing buildings.
Spending is up a total of 42% since 2019; up 8% in 2020, 10% in 2021, 12% in 2022 and now 7% in 2023. But volume after adjusting for inflation is up only 5% total. You can see the Constant$ line, with one lower dip in 2022, has ranged between Constant$1400bil. to $1500bil. since mid-2019.

Construction spending total forecast for 2024 is up 10.7%. Nonresidential Buildings is forecast up 8.8%, Non-building Infrastructure up 15.8% and Residential up 9.7%. Lower inflation in 2024 means more of that spending is counting towards real volume growth. I’m expecting only 4% to 5% inflation for 2024, so real volume growth could reach 6% for the first time since 2015. From 2012-2016, volume growth averaged 6%/yr. For the last four years, 2020-2023, 42% spending growth vs 37% inflation growth netted only 5% total real volume growth. Since 2017, volume growth averaged less than 1%/yr. Non-building Infrastructure volume could increase 10%+ in 2024.

New Construction Starts
Dodge Construction Network (DNC) monthly news article of construction starts by sector provides the data from which the following is summarized.
Total construction starts for 2023 ended down 4%, but Nonresidential Buildings starts finished down 7% and Non-building Infrastructure starts were UP 16%. Residential starts decreased 12% in 2023.
Total construction starts for 2024 are forecast up 7%. Nonresidential Buildings starts are forecast up 5% and Non-building Infrastructure starts up 8%. Residential starts are forecast up 10% in 2024.
In recent years, Nonres Bldgs new starts averaged $300 billion/year. In the 2nd half of 2022, starts averaged near $500 billion/year. For the 1st half 2023 starts dropped to a rate of $390bil./yr., which is still well above the recent average. Then, for 2nd half 2023, starts came back up to average $430 billion/year, the 2nd highest half year average. A 50% increase in new nonresidential building starts in 2022 has a positive impact on the rate of construction spending in 2023 and 2024. It will continue to add lesser impact into 2025. Projects starting in 2nd half of 2023 could have midpoint of construction, point of peak spending, in 2024 or into 2nd half of 2025, some real long duration starts even later. So, the major spending impact from starts is sometimes one or two years later.
Residential construction (Dodge) starts posted the five highest months ever, all in the 1st 6 months of 2022. In the second half of 2022, residential starts fell 15%. In Q1 2023, residential starts dropped another 12% below 2nd half 2022, the lowest average since Q1-Q2 2020. Finally in July and August, starts regained some strength coming in 33% higher than the lows in Q1. Residential starts finish 2023 down 12% vs 2022. Forecast is up about 10% in 2024.
Nonresidential Buildings, in 2022 posted the largest ever one-year increase in construction starts, up 50%. Some of these starts will be adding to peak spending well into 2025. Nonres Bldgs starts in the 2nd half 2022, averaged 67% higher than any other 6mo period in history. Starts fell 20% in the 1st half 2023 but still posted the 2nd highest 6mo average ever. After two years of outstanding growth, Nonres Bldgs starts close 2023 down 7%. Although 2023 is down 7%, that’s still by far the 2nd best year ever. The forecast for 2024 is +5%.
Manufacturing starts, the market with the largest movement, gained 120% from 2020 to 2023. Manufacturing projects can have a moderately long average duration because some of these are multi-billion$ projects and can have schedules that are 4 to 5 years.
Educational, Healthcare, Lodging and Public Buildings all had starts of 20% or more the last two years.
Non-building starts for the 6 month period Mar-Aug 2023 posted the best 6 months on record, up 30% from the average of 2022. The 2nd half 2022 was up 50% over 1st half 2022. For 2023, Highway/Bridge and Power have the strongest gains. Total Non-building Starts for 2023 are up 16% and they were up 25% in 2022. These starts will help elevate spending through 2025. Non-building starts for 2024 are forecast up 8%.
Power starts are up 25% the last two years. Highway starts and Environmental Public Works are both up 33% the last two years and up 50% the last three years.
Starts data captures a share of the total market or only a portion of all construction spending, on average about 60% of all construction. The easiest way to understand this is to compare total annual construction starts to total annual spending. National starts in recent years about $800 billion/year, while spending in this period ranges from $1,300 billion/year to $1,500 billion/year. From this simple comparison we can see starts captures a share of about 60% of the total market. The actual share for each market varies from as low as 35% to as high as 70%. Before using starts data to forecast spending, starts here were first adjusted for market share.

Starting Backlog
Starting backlog is the estimate to complete (in this analysis taken at Jan 1) for all projects currently under contract. The last time starting backlog decreased was 2011. If new construction starts in the year are greater than construction spending in the year, then for the following year starting backlog increases. It’s when new starts don’t replenish the amount of spending in the year that backlog declines.
80% of all nonresidential spending in any given year is from backlog and could be supported by projects that started last year or 2 to 4 years ago. Residential spending is far more dependent on new starts than backlog. Only about 30% of residential spending comes from backlog and 70% from new starts.
The table below, Forecast Starting Backlog, is model generated by Construction Analytics. Adjusted starts are spread over time to generate cash flow. A sum of spending each month/year, subtracted from start of year plus new starts provides Backlog.

Construction Backlog leading into 2024, in every sector, is at all-time high, in total up 46% from Jan 2020. For the years 2022 and 2023, backlog is up 11% and 12%. Reaching new highs in Backlog could mean contractors are comfortable adding some backlog, or it could mean not enough labor, subcontractors or suppliers to support advancing growth so quickly, so growth advances slower and more of the work is retained in backlog for longer, essentially dragging out the timeline, or it could be long term workload, 4yr.-6yr. long projects from new starts, such as Manufacturing, where a very large amount enters backlog and gets spent over 4-6yrs., so, although the monthly drawdowns reduce the amount remaining in backlog, it remains in backlog for a long time.
Residential backlog in 2024 is down 0.5%, but from such a previous high, essentially, starts are riding flat along the top. Starts are up 55% since Jan 2020.
Nonresidential Bldgs starting backlog for 2024 received a boost from all the starts in 2022 and 2023. Backlog is up 12% from 2023 and up 50% from Jan 2020.
Nonbuilding Infrastructure starting backlog is up 12% each of the last two years boosted by strong starts in 2022 and 2023. For 2024, backlog is up 40% from Jan 2020.
Manufacturing backlog increased nearly 300% from 2020-2024, from $117bil going into 2020 to $300bil beginning 2024. No other market has ever been close. Manufacturing was responsible for 60% of all the Nonres Bldgs spending growth in 2023. It was also responsible for 60% of the Backlog growth leading into 2024. Nonres Bldgs has a total 3.6 million jobs and has never increased by more than 150,000 jobs in one year. Manufacturing is 30% of all Nonres Bldgs spending, so assume 30% of Nonres Bldgs jobs. That’s 1.2million jobs supporting just Manufacturing projects. So Backlog of $300bil, at 5000 jobs per billion per year, would need 1,500,000 jobs for a year. With a 1,200,000 jobs share of the workforce, that backlog would provide support for 15 months. Of course, new starts add to support throughout the year, but the calculation of how long backlog would support that market segment is valuable.
Backlog at the beginning of the year or new starts within the year does not give an indication of what direction spending will take within the year. Backlog is increasing if new starts during the year is greater than spending during the year. An increase in backlog could immediately increase the level of monthly spending activity, or it could maintain a level rate of market activity, but spread over a longer duration. In this case, there is some of both in the forecast. It takes several years for all the starts in a year to be completed. Cash flow shows the spending over time.
Current Rate of Spending
The current seasonally adjusted annual rate (SAAR) of spending gives an indication of how spending will perform in the following year. As we begin 2024, the current rate of spending (SAAR) for Nonresidential Buildings in Q4’23 is $709bil., already 4.5% higher than the average for 2023 ($677bil). If spending stays at the current level and no additional growth occurs, Nonresidential Bldgs spending will finish 2024 up 4.5%. Spending would need to have more monthly declines than increases to finish the year up less than 4.5%. The current forecast shows a monthly SAAR rate of growth for Nonresidential Bldgs. averaging about 0.5%/mo in 2024, so we have a minimum, but we can expect 2024 total spending to rise considerably higher than the current rate.
Non-building Infrastructure current rate of spending is now 3.7% higher than the average for 2023, however the forecast is indicating steady growth of 1%/mo for all of 2024.

Residential current rate of spending is 2.4% above the 2023 average and is forecast to average an increase of just under 1%/mo for 2024.

2024 Construction Spending Forecast
Starts lead to spending, but that spending is spread out over time. Starts represent a contract award. Spending takes the amount of that contract award and spreads it out by a cash flow curve over the duration of the job. An average spending curve for the sum of nonresidential buildings is 20:50:30 over three years. Only about 20% of new starts gets spent in the year started. 50% gets spent in the next year and 30% in YR3/4. An average spending curve for Non-building Infrastructure is more like 15:30:30:20:5. The effect of new starts does not show up in spending immediately. For example: If 2024 posts an additional $100 billion in new starts for Infrastructure, only about $15 billion of that would get put-in-place in 2024. The cash flow schedule for that $100 bil of new starts would extend out over 3 to 5 years. Most of that $100 bil would get spent in 2025 and 2026.
Total Construction Spending $2,190 billion +10.7% over 2023.
Nonresidential Buildings $737 billion +8.8% over 2023.
Non-building Infrastructure $493 billion +15.8% over 2023.
Residential Buildings $960 billion +9.7% over 2023.
This forecast does not include a recession.
The largest increases to construction spending in 2023 are Manufacturing +$80bil, Highway +$20bil, Public Utilities (Sewage and Waste, Water Supply and Conservation-Rivers-Dams) +$15bil and Educational +$14bil.
Residential regains the top growth spot in 2024 with a forecast spending increase of +$68bil. Manufacturing is forecast to add +$32bil. Highway gains +$26bil, Power +$24bil and Educational gains +$15bil.
One big question is how did the forecast for Manufacturing increase so much since the beginning of 2023. Since January 2023, the starts forecast for 2023 increased by 35%. How much of that 35% is real growth in starts vs an increase in the capture rate of data gathering is yet to be determined, but has an impact of 2023-2024 spending. Also, starts for future years were increased by 50%. Starts (contract awards) drives up the spending forecast, since spending is a function of the future monthly cash flow (spending) of starts.
As we begin the year, Manufacturing SAAR current rate of spending is already 8% higher than the average for 2023. The current rate of spending is increasing at an average of near 2%/month for the next 6 months, then slows or dips slightly for the remainder of the year, indicating total spending for 2024 will finish well above the current rate of 8%. I’m forecasting 16% growth for the year.
Highway SAAR rate of spending begins the year 6.5% higher than the average for 2023, with the current rate increasing at an average of 1%/month for all of 2024, indicating total spending for 2024 will finish well above the current rate of 6.5%. Starts have increased +15%/yr the last three years. My forecast is for 19% growth in 2024 spending.

Power SAAR rate of spending begins the year 4% higher than the average for 2023, with the current rate increasing at an average over 1%/month for 2024, indicating total spending for 2024 will finish much higher. My forecast is for 20% growth in 2024.

Public Utilities SAAR rate of spending begins the year 6% higher than the average for 2023, with the current rate increasing at an average over 1%/month for 2024. Public Works averaged +15%/yr new starts the last three years. My forecast is for 13% spending growth in 2024.

Residential regains the top spot in 2024 with a forecast spending increase of $68bil. Residential SAAR rate of spending in Q4’23 was up 2.5% over 2023, but December was up 5%. So we begin the year 2.5% to 5% higher than the average for 2023. The rate of spending is forecast to increase 1%/month for 6 months, then fall 0.5%/mo for H2 2024. My forecast is for 10% growth in 2024.

Educational SAAR rate of spending begins 2024 7% higher than the average for 2023, and the current rate is increasing at an average of 0.7%/month for 2024. My forecast is for 13% growth.
Inflation
Construction Inflation differs from other common types of inflation, i.e., Consumer Price Index. It must be accounted for in order to make reasonable calculations for business volume and past or future costs.
30-year average inflation rate for residential and nonresidential buildings is 3.7%. Excluding deflation in recession years 2008-2010, for nonresidential buildings is 4.2% and for residential is 4.6%.
Deflation is not likely. Only twice in 50 years have we experienced construction cost deflation, the recession years of 2009 and 2010. That was at a time when business volume dropped 33% and jobs fell 30%. During two years of the pandemic recession, volume reached a low down 8% and jobs dropped a total 14%.But we gained back far more jobs than volume. That means it now takes more jobs to put-in-pace volume of work. That increases inflation.
The following Construction Inflation plot (for Nonresidential Buildings only) shows three elements: 1) a solid grey bar reflecting the max and min of the 10 indices I track in my weighted average inflation index, 2) a solid black line indicating the weighted average of those 10 indices, and 3) a dotted red line showing the Engineering News Record Building Cost Index (ENR BCI). Notice the ENR BCI is almost always the lowest, or one of the lowest, indices. ENR BCI, along with R S Means Index, unlike final cost indices, do not include margins or productivity changes and in the case of ENR BCI has very limited materials and labor inputs.

Final cost indices represent total actual cost to the owner and are generally higher than general indices. Producer Price Index (PPI) INPUTS to construction reflect costs at various stages of material production, generally do not represent final cost of materials to the jobsite and do not include labor, productivity or margins. Even with that, a PPI Inputs index +20% for a material could be only a +5% final cost. PPI Final Demand indices include all costs and do represent actual final cost. The solid black line (above) represents the Construction Analytics Building Cost Index for Nonresidential Bldgs and is a final cost index.

This short table shows the inflation rate for each year. Useful to compare to last year, but you would need to mathematically do the compounding to move over several years. The plot below shows the cumulative inflation index, or the cumulative compounded effect of inflation for any two points in time.
Typically, when work volume decreases, the bidding environment gets more competitive. We can always expect some margin decline when there are fewer nonresidential projects to bid on, which typically results in sharper pencils. However, when labor or materials shortages develop or productivity declines, that causes inflation to increase. We can also expect cost increases due to project time extensions or potential overtime to meet a fixed end-date.
Current$ Spending, Inflation, Constant$ Volume
Volume = spending minus inflation. Spending includes inflation. Inflation adds nothing to the volume.
Inflation adjusted volume is spending minus inflation, or to be more accurate, spending divided by (1+inflation). Inflation adds nothing to volume growth. The following table shows spending, inflation and volume (spending without inflation) for each year. Spending is current to the year stated. The values in the constant table are indexed to a constant value year, 2019. This shows business volume year to year, can be a lot different than spending would indicate. When inflation is positive, volume is always less than spending by the amount attributed to inflation.
Lower inflation in 2024 means more of that spending is counting towards real volume growth. Expecting only 4% to 5% inflation for 2024, real volume growth could reach 6% for the first time since 2015. From 2012-2016, volume growth averaged 6%/yr. For the last four years, 2020-2023, 42% spending growth vs 37% inflation growth netted only 5% total real volume growth. Since 2017, volume growth averaged less than 1%/yr. Non-building Infrastructure volume could increase 10%+ in 2024.
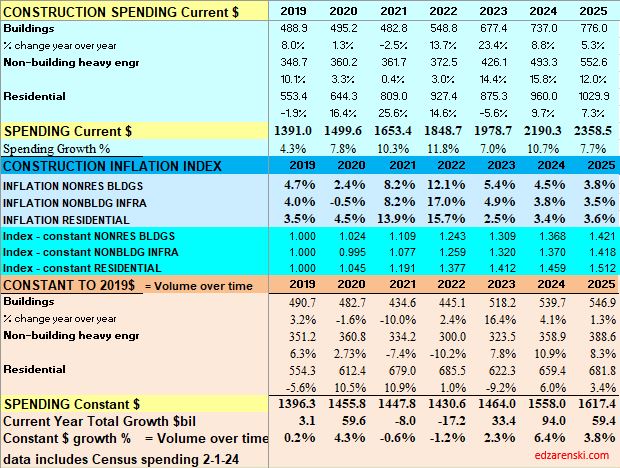
Spending during the year is the value of business volume plus the inflation on that volume. When inflation is 12%, volume plus 12% = total spending. Revenue is generally measured by spending put-in-place during the year. Revenue does not measure volume growth. In 2022, Nonresidential buildings inflation was 12%, so business volume was 12% less than spending, or 12% less than revenue. Residential volume was 15% less then spending.
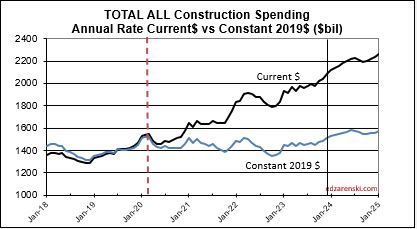
When referencing Constant $ growth, remember the dollars for all years are reported here as 2019$. If the baseline year is changed to this year (divide all indices by this year’s index), the resulting comparison would be all years reported as 2024$. The dollars would all be greater, but the percent change would be the same. In this table, nominal spending is divided by the inflation INDEX for the year. You can also deduct the percent inflation from any individual year of spending to find inflation adjusted $ for that year alone, however that method would not allow comparing the adjusted dollars to any other year. A baseline year is necessary to compare dollars from any year to any other year.
Reference Inflation Data Construction Inflation 2024
Through December 2023, Total Construction Spending is up 40% for the four years 2020-2023, but, during that same period inflation increased 35%. After adjusting for 35% inflation, constant $ volume is up only 5%. So, while the current $ spending plot shows a four-year total increase of 40% in spending, the actual change in business volume is up only 5% and has just in the last few months returned to the pre-pandemic peak in Feb-Mar 2020.

Jobs are supported by growth in construction volume, spending minus inflation. If volume is declining, there is no support to increase jobs. Although total volume for 2023 is up 2.3%, Residential volume is down 9%, Nonresidential Bldgs volume is up 16% and Non-building volume is up 8%. Inflation was so high in 2021 and 2022 that it ate away most of the spending gains in those years.
Jobs vs Volume
Construction Jobs increased 2.75% in 2023. We added 214,000 jobs (avg’23-avg’22). There are currently 8,056,000 construction jobs. The largest annual increase post 2010 is 321,000 jobs (+4.6%) in 2018. The average jobs growth post 2010 is 200,000 jobs per year.
Since 2010, average jobs growth is 3%/yr. Average volume of work growth since 2010 is 2.3%/yr. This plot shows Jobs and Volume growth closely match from 2011 to 2018. With few exceptions for recession periods, this pattern can be seen throughout the historical data.
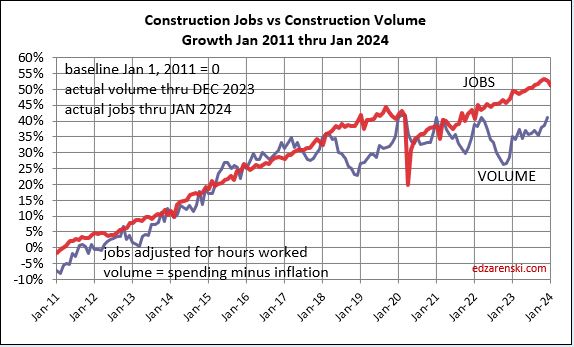
What’s remarkable about the growth is this, since 2016, spending has increased 63%, volume after inflation increased 6% and jobs increased 19%. In the last 7 years, 2017-2023, jobs increased 2.5%/yr. Volume of work increased only 0.8%/yr. Volume and jobs should be moving together.
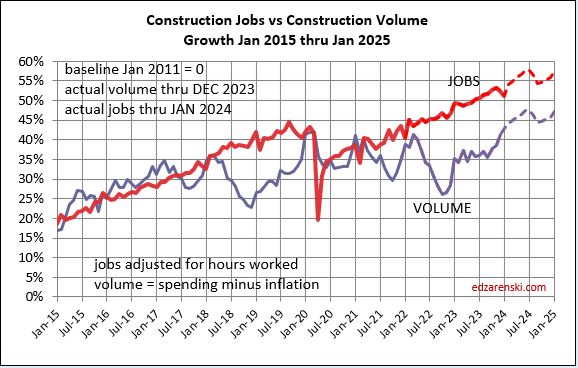
It takes about 5000 jobs to put-in-place $1 billion of volume in one year. It could easily vary from 4000 to 6000. So, an add of $100 billion+ in one year would need 500,000 new jobs. Jobs should track volume, not spending growth. Volume = spending minus inflation.
Normal construction jobs growth is about 250,000 jobs per year and maximum prior growth is about 400,000. From the table above, Nonresidential Bldgs and Non-building Infrastructure added $100bil of volume in 2023 and will add $60bil in 2024. The workload discussed above would theoretically require 500,000 new jobs in 2023 and 300,000 more in 2024. That’s an expansion of the industry workforce by 10% in two years, for just half the industry, in an industry that normally grows in total 3%/yr. This industry can’t grow that fast. This may have some impact if over-capacity growth results in a potential reduction or extension in future forecast. You can’t increase spending that fast if you can’t also expand the labor force and the suppliers to the industry that fast.
In the last 12 months, Dec’22 to Dec’23, Nonres Bldgs jobs are up 4%. Nonres Bldgs spending is up 23%, by far driven by Manufacturing, but after ~5.4% inflation, volume of nonres bldgs workload is up 16%. So, we have a 4% increase in jobs versus a 16% increase in volume.
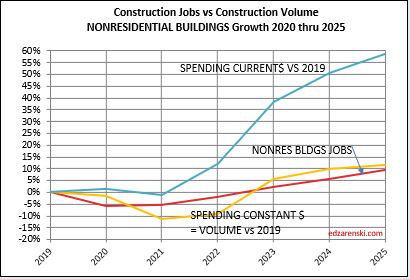
The last year has shown a huge increase in the volume of nonres bldgs work, without an equal increase in jobs. Is this excess nonres bldgs jobs for the past three years now absorbing added workload, (a 4% increase in jobs but a 16% increase in volume), without collapsing the labor force or canceling the volume?
Non-building, over the next two years, could experience the same kind of growth spurt as Nonres Bldgs., a forecast increase in volume the next two years without an equal increase in jobs. Volume which was lower than jobs since 2021, is now increasing faster than jobs. Non-bldg volume is forecast up 6% to
8%/year the next 3 years. Jobs increase at an avg. 3.5%/year.

Residential volume has exceeded residential jobs all the way back to 2011. The recent decline in volume brings the two even, if the jobs hold the pace.
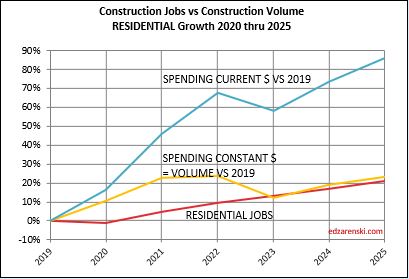
For as long as I can remember, the construction industry has been complaining of jobs shortages. And yet, as shown in the data mentioned above, jobs have increased multiples times greater than volume of work. With an exception for recession years, (2007-2010 and 2020), jobs increase at a rate of 2.5% to 3% per year. The greatest disparity between jobs and volume occurred in late 2022, when jobs growth had already resumed normal pace, but volume of work was still reeling from the effects of new construction starts that were canceled dating back to late 2020-early 2021. Recent volume growth at a much faster rate than jobs growth is now closing the gap.
When jobs increase without an equal increase in the volume of work, productivity declines. This recent increase in volume and the projected increase in volume in 2024, several points stronger than jobs, will offset some of the disparity which has been negative for a long time.

Reference Inflation Data Construction Inflation 2024
Reference Article The Next Forecast Challenge
Reference Article Midyear ’23 Jobs Outlook
Reference Article Reliability of Predicted Forecast
Reference Link to Web Dodge Construction News
Below is a downloadable 24 page PDF of the complete 2024 Outlook

Nonresidential Bldgs Forecast 2022 Improves
11-8-21
Lots of construction data came out last week. Sept spending, Oct jobs and Dodge Outlook 2022 for new starts. There have been major revisions to new starts since the June and July starts reports. Since June data, starts increased over what had been forecast for 2021 in Residential +12%, Comm/Rtl +20%, Mnfg +41%, Educ +4%, Rec +38%, Enviro+6%. These increases to 2021 starts improve the spending forecast for 2022. Mnfg, Rec and Enviro starts for 2022 were all reduced slightly.
See Construction Economics in Pictures 11-5-21 for current forecast.
Nonresidential buildings starts increased in 2021 by more than the marked up equivalent of $40 billion in spending (over the life of the projects). About half of that increase in spending would occur in 2022. So this increase in the starts forecast really pushed up the forecast for 2022 spending. All sectors now are forecast higher spending in 2022, but the biggest change is in nonres bldgs. These two plots show nonres bldgs as it was forecast based on June data on Aug. 1, and again as of Sept spending/Outlook22 starts data released Nov. 3. The expectation now is for an upward turn in spending beginning in the 4th quarter 2021. Previous models all had poor 2020/2021 starts reflecting a bottom in nonres bldgs spending just about mid-2022. The spending increase leading into 2022 moves the spending bottom to a point much sooner in 4th quarter 2021.
Nonres bldgs spending prior to release of Dodge Outlook 2022

Nonres bldgs spending forecast as of 11-3-21 includes release of Dodge Outlook 2022
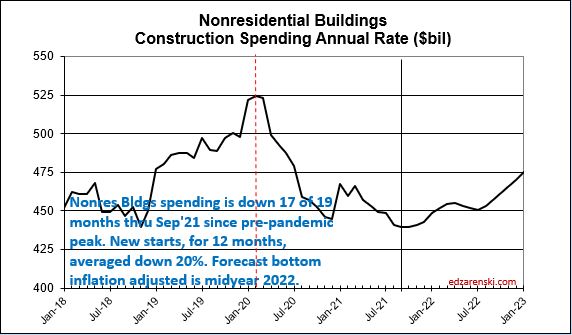
Forecast spending bottom was mid-2022, now is Q4 2021. Although total spending is now forecast to increase 2.5% in 2022, that is still less than inflation, so real construction volume in nonres bldgs is still down slightly for 2022. The forecast bottom for nonres bldgs inflation adjusted constant $ is still mid-2022.

2019 Construction Economic Forecast – Nonresidential – Dec 2018
Construction Analytics 2019 Construction Economic Forecast – Nonresidential
This Dec. 2018 Construction Economic Forecast analysis addresses New Construction Starts, Inflation, Cash Flow or distribution of construction work over time, Annual Backlog and Spending. New Starts is new work entering Backlog. Cash Flow gives the pattern of Spending. Inflation differentiates between Revenue and Volume. Backlog, which can be referenced to assess expected future Volume and Spending, provides an indication of when Volume occurs or in what year Revenues occur. Starts data is from Dodge Data & Analytics. Spending data is from the U.S. Census Bureau. Jobs data is from the Bureau of Labor Statistics. Inflation data is from the source labeled. Cash flow, Backlog and Inflation forecast data are developed internally. All data in this report is national level data. All forecast data is by Construction Analytics.
NOTE 12-6-18: Dodge Data and Analytics new construction starts for October, released 11-20-18, reached the 2nd highest seasonally adjusted annual rate ever, 2nd only to June 2018. Most spending from these new starts will occur in 2020. This will increase the 2020 nonresidential buildings spending forecast, with the largest increase in manufacturing. Construction Starts for October, the Dodge end-of-year report and October spending, all released between 11-21-18 and 12-3-18 significantly alter this analysis. The biggest changes reduced residential spending for the next two years. See the 2019 Construction Economic Forecast – Summary for the residential analysis.
This analysis was edited 12-6-18 to include that most recent starts data and the U S Census October spending data.
For a fully formatted PDF of this Nonresidential report 2019 Construct Econ Forecast – NONRES – Dec 2018 RVSD 12-6-18
Link to 2019 Construction Economic Forecast – Summary
Summary
Total of All construction spending is forecast to increase 6% to $1.321 trillion in 2018 and 1.5% to $1.341 trillion in 2019. Spending in 2020 is forecast to reach $1.426 trillion.

Nonresidential Buildings construction spending is forecast to increase 6% to $444 billion in 2018, 0% to $443 billion in 2019 and 9% to $482 billion in 2020. The forecast for 2019 will be supported by Office (which includes data centers) and Amusement/Recreation but there is downward pressure from slowdowns or timing of cash flow in Manufacturing, Lodging, Healthcare and Educational. Educational, Healthcare, Recreation, Office and Manufacturing all support growth in 2020.
Residential construction spending for 2018 was recently revised down and starts for 2019 are expected flat to down slightly. The forecast is now for an increase of 5.6% to $562 billion in 2018, 0.5% to $564 billion in 2019 and 2.3% to $577 billion in 2020. Although residential spending is still increasing, growth has slowed to less than inflation. Real volume after inflation is declining.
Nonbuilding Infrastructure construction spending is forecast to increase 7.2% to $316 billion in 2018, 5.7% to $334 billion in 2019 and 10.1% to $368 billion in 2020. Transportation spending provides strong growth for the next three years from record new starts in 2017 and the 2nd best year of starts in 2018. Public Works had strong growth in 2018 starts and Highway starts hit a new high in 2018.

In July of the following year the spending data for the previous two years gets revised. Those revisions are always up, although some markets may increase while others decrease. So, even though the current forecast for 2018 is $1,328 trillion, a gain of 6.5%, that will most likely increase.
Dodge Data construction starts are initially anticipated to finish 2018 flat compared to 2017. However, starts are always revised upward in the following year. I expect revisions will show 2018 starts increased by 4% over 2017. Even with revisions, 2018 starts will post the slowest growth since 2011. Starts increased 84% in the period 2012-2017, residential 150% and nonresidential buildings 80%. This forecast includes only a total of 10% growth for the 3-year period 2018-2020.
Starting backlog, currently at an all-time high, increased on average 10%/year the last three years. For 2019 starting backlog is forecast up 10% over 2018. 80% of all Nonresidential spending within the year will be generated from projects in starting backlog. Due to long duration jobs, 2019 nonresidential buildings starting backlog is up 50% in the last 4 years. Current indications are that 2019 backlog will be up 6%-8% across all sectors.
Construction Inflation Indices
Outside of recession years, nonresidential buildings construction spending year over year growth dropped below 4% only SIX times in 50 years. The long-term average inflation is 3.75%. Every year that spending dropped below 4% growth, nonresidential buildings real volume declined.
Construction Analytics Nonresidential buildings inflation forecast for 2018 is 4.9%. Current reliable inflation forecasts range from 4.7% to 5.6%. Inflation in this sector has been at 4% or higher the last four years.
Anticipate national average construction inflation for nonresidential buildings for 2018 and 2019, including steel tariff impact, of 4.25% to 5.5%, rather than the long-term growth average of 4%. Adjust for any other yet unknown tariffs that may hit after Jan 1, 2019.
In the following plot, Construction Analytics Building Cost Index annual percent change for nonresidential buildings is plotted as a line against a bar chart background of the range of all other nonresidential building inflation indices. Usually the lows are formed by market basket input indices while the highs are formed by other selling price indices.

Non-building Infrastructure indices are far more market specific than any other type of index. Reference specific Infrastructure indices rather than any average.
These links point to comprehensive coverage of the topic inflation and are recommended reading.
Click Here for Link to a 20-year Table of 25 Indices
Click Here for Cost Inflation Commentary – text on Current Inflation
New Construction Starts
All construction starts data in this report references Dodge Data & Analytics Starts Data.
For nonresidential buildings, approximately 20% of the spending occurs in the year started, 50% in the next year, 25% in the third year and only 5% in the fourth year or later year. This means that nonresidential spending growth in 2019 is still being affected by starts from 2016.
The following plot show the 3-month moving average and trend line of starts for Nonresidential Buildings. Starts can be erratic from month to month. The trend line gives a better impression of how starts impact spending. It is the rate of change in starts cash flows that provides a predicting tool for spending.

Starts are sometimes misinterpreted in common industry forecasting articles. Starts dollar values represent a survey of about 50% to 60% of industry activity, therefore Starts dollar values cannot ever be used directly to indicate the volume of spending. Also, Starts do not directly indicate changes in spending per month or per year. Only by including an expected duration for all Starts and producing a forecast Cash Flow from Starts data can the expected pattern of spending be developed. Finally, it is the rate of change in Starts Cash Flows that gives an indication of the rate of change in spending.
Starts is a survey sample of a portion of all construction, on average about 50% to 60% of all construction. This can introduce potential error when using starts to predict spending. In any survey, if sample size remains constant, let’s say at 50% of population, but survey response increases 5%/year, then output of the population should increase at 5%/year. However, if survey response increases at 5%/year but sample size is increasing at 3%/year then output of the population should increase at only 2%/year.
If starts survey sample size varies from year to year, it’s possible some of the anticipated spending growth reported by new starts may not represent growth in real volume of future work but could simply represent a change in sample size. Potential significant variations in sample size are seen in the data and may cause errors in the forecast. The detail of Education spending provides an example.
Starting Backlog
Nonresidential Buildings starting backlog at the beginning of 2018 reached an all-time high. For nonresidential buildings this backlog will contribute spending until the end of 2021. Starting Backlog for 2019 is forecast to increase 8%. For purposes of this analysis, I’ve set only moderate or low increases in starts for 2020 and 2021, so this forecast may hold down the future backlog and spending forecast. However, backlog leading into 2019 is up 70% in 5 years.
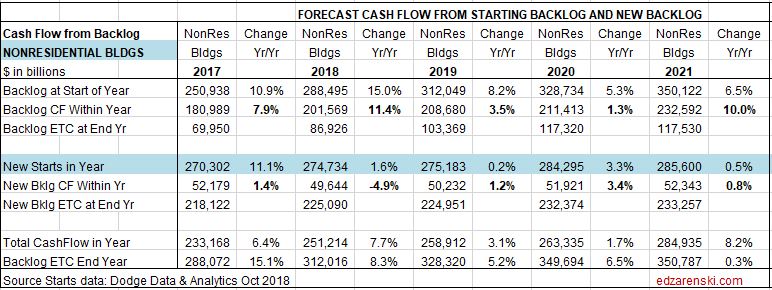
Starting Backlog is the Estimate-to-Complete (ETC) value of all projects under contract at the beginning of a period. Projects in starting backlog could have started last month or last year or several years ago.
- 75%-80% of all Nonresidential Buildings spending within the year will be generated from projects in starting backlog.
- 80%-85% of all Non-Building Infrastructure spending within the year will be generated from projects in starting backlog.

Non-building Infrastructure starting backlog at the beginning of 2018 reached an all-time high. Some of this is very long-term work that will contribute spending until the end of 2025. In fact, more than half of all spending in 2019 comes from projects that started prior to Jan 2018. 2019 Backlog is forecast to increase 10%. Backlog is up 45% in 5 years but is up 50% in just the last 3 years.

Cash Flow
Simply referencing total new starts or backlog does not give the complete picture of spending within the next calendar year. Projects, from start to completion, can have significantly different duration. An office building could have a duration of 18 to 24 months and a billion-dollar infrastructure project could have a duration of 3 to 4 years. New starts within any given year could contribute spending spread out over several years. Cash flow totals of all jobs can vary considerably from month to month, are not only driven by new jobs starting but also by old jobs ending, and are heavily dependent on the type, size and duration of jobs.
Although new nonresidential buildings starts increased only 1.6% in 2018 note that cash flow increases by almost 8% due to a very large increase from starting backlog. To a lesser extent the same thing happens in 2019.
Non-building infrastructure starts and cash flow follows a similar pattern. In 2018 and 2019 new starts decline moderately, spending from new starts declines substantially but starting backlog and spending from starting backlog increases are so strong that total cash flow within the year continues to increase.
Nonresidential Buildings Spending
Construction spending is strongly influenced by the pattern of continuing or ending cash flows from the previous two to three years of construction starts. Current month/month, year/year or year-to-date trends in starts often do not indicate the immediate trend in spending.
Nonresidential Buildings construction spending is forecast to increase 5.8% to $444 billion in 2018, fall -0.2% to $443 billion in 2019 and climb 8.9% to $482 billion in 2020. Office (which includes data centers) and Amusement/Rec support the 2019 forecast but there is downward pressure from slowdowns or timing of cash flow in Manufacturing, Lodging, Healthcare and Educational. Educational, Healthcare, Recreation, Office and Manufacturing all support growth in 2020.


Nonresidential buildings construction spending in constant $ (inflation adjusted $ to base 2017) will reach $424 billion in 2018 after hitting a post-recession peak of $431 billion in 2016 and dropping to $419 billion in 2017. In 2019 constant $ spending will total $420 billion. Constant $ spending or real volume growth shows all years from 1996 through 2009 had higher volume than any years 2016-2019. Volume reached a peak near $530 billion in 2000 & 2001 and went over $500 billion again in 2008. In constant $ volume, I don’t see returning to that peak before 2023.
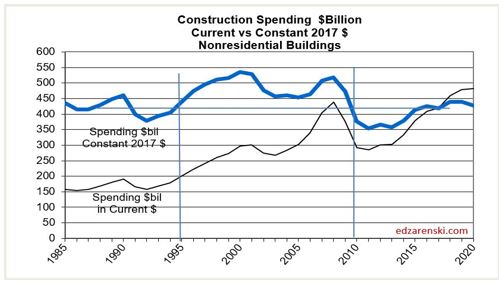
Educational
New Starts averaged YOY growth of 11%/year for the last five years. Starts from the last five months of 2017 posted the highest 5mo total in at least seven years, 13% higher than the next best 5mo. The highest and 2nd highest quarters were both within the last 15 months, so both those periods contribute fully to 2018 spending. 2017 starts will support 25% of spending in 2019. Starts are expected to finish 2018 up 5%. 2018 starts will support 50% of spending in 2019 and 20% of spending in 2020.

Backlog in five years 2014-2018 increased 11%/year. It is unusual that Starts and Backlog continue to grow for five years but that growth is not reflected in actual spending. From 2013 to 2018 new starts increased 66% but spending for the period of those starts will increase only 34%. That would seem to indicate a very large volume of work is growing in backlog and spending at some point should boom and remain high for an extended period, but the cash flow model is not in agreement. A possible explanation is the sample survey of new starts has been increasing, so not all the starts growth for five years represents growth in new work. Some of the increase in starts is simply growth in sample size. Educational starts 2012-2015 averaged 50% sample size of total spending. In 2016-2018 the average sample size vs spending was 60%.
Spending is now at a post-recession high. Spending increased 6%/year for 2015, 2016 and 2018, while 2017 increased only 1%. 2017 and 2018 are still subject to revision. Expect to see growth level off until mid-2019. Leveling at post-recession high is not a bad thing. A build-up of backlog is indicating that spending should increase substantially, but a disconnect in the analysis was noted above. Spending growth increases again in 2020.
At peak, educational represented 30% of all nonresidential buildings spending. Now it’s only 22%. That’s expected to increase slightly for the next three years.
Educational construction spending is forecast to reach $96 billion in 2018, $93 billion in 2019 and $103 billion in 2020.
Healthcare
Starts are at an all-time high, up almost 40% in the last 5 years. Some longer duration projects push a substantial amount of spending out to 2020.

Backlog increased 11% for 2017 and 8% for 2018. Backlog has been increasing unevenly and grew 30% in 4 years. Backlog increases 3% to start 2019 but is not indicating spending growth in 2019. Cash flow from backlog is indicating spending growth in 2020.
Spending has been very slow to recover, experiencing declines as recently as 2013 and 2014, hitting an 8 year low in 2014, when all other nonresidential building markets had already returned to growth. 2017 posted a gain of 4.4% but then 2018 gained less than 1%. Backlog is increasing but real spending gains won’t materialize until 2020.
Like Educational, backlog growth has been exceeding spending growth for the last few years. That would indicate spending at some point may boom and remain high for an extended period. Cash flow models indicate this may occur in 2020. Other possible explanations are; starts are overstated; cash flow curves (average 28mo) are too short in duration; projects got canceled after starts were recorded; large spending revisions could get posted in the future.
Healthcare construction spending for 2018 is forecast to finish at $42 billion, an increase of only 0.7% over 2017. Considering 4% inflation, Healthcare real volume has declined every year since 2012 with exception of 2017 which would have been flat. It will decline again in 2019 with a forecast -2.7% decline in spending. 2020 realizes the 1st big spending increase in 8 years, +14% to $47 billion.
Amusement/Recreation
Starts are up 13% in 2018. Although down 1% in 2017, starts increased at an average rate of 15%/yr. from 2013 through 2017. Within the past 15 months there have been five billion-dollar project starts.

Starting backlog increased 20%/yr for the last four years while spending was increasing at a rate of 10%/year. This means backlog should continue to support increased spending at least for the next few years.
Spending hit an 8 year low in 2013 but we’ve had 3 years of excellent growth of 10%/yr or more since then. 2017 spending increased only 7% and 2018 11%, but cash flow is indicating a 12% increase for 2019. This market is only 5% of nonresidential buildings spending.
Amusement/Recreation construction spending for 2018 is forecast to reach $28 billion, an increase of 12% over 2017. 2019 is forecast to increase 12% to $31 billion.
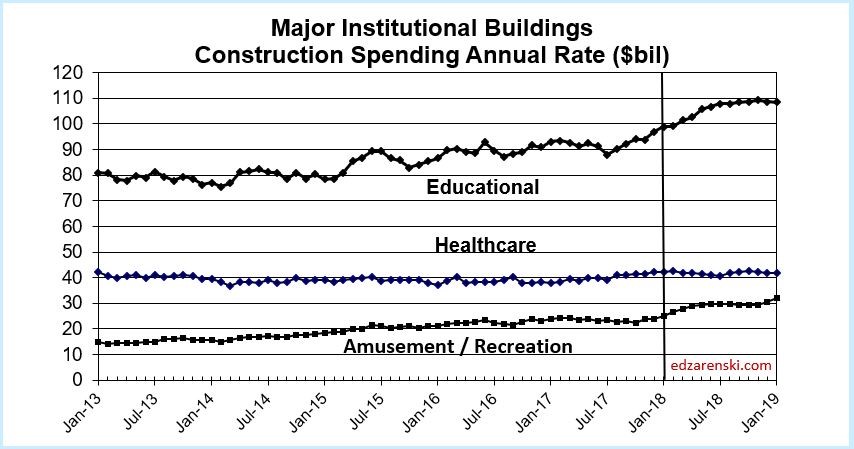
Commercial/Retail
Commercial/Retail starts have been increasing every year since 2010 but starts in 2018 are flat vs 2017 Starts are at a peak but after 5 years of 15%-20% growth/year are up only 4% in the last two years.
Commercial starts are seeing strong gains from distribution centers (warehouses which are in commercial spending). The decline in retail stores is being hidden by the increase in warehouses, which are at an all-time high. Stores are down 10% from the peak in 2016. Warehouses are still up only 4% in 2018 but increased 500% from 2010 to 2017.
In 2010, Warehouse starts were only 1/3 of Store new starts. In 2018, Warehouse starts are 25% greater than Store starts. Warehouse starts have increased between 20%-40%/year for seven years and are now five times greater than in 2010. See this Bloomberg article Warehouses Are Now Worth More Than Offices, Thanks to Amazon

Some big projects from a period of strong new starts growth are ending. This will slow spending after 7 years of strong growth. 2018 backlog still produces a spending increase which may finish close to +5%, but forecast shows spending slows even more to only 2% in 2019 and less than 1% in 2020.
The biggest change in Commercial/Retail in the last few years is that backlog is now more heavily weighted with warehouse projects than store projects. The mix has shifted from 60/40 stores in 2014-2015 to 55/45 warehouses in 2018-2019.
Spending dropped from the high of $90 billion in 2007 to $40 billion in 2010. It has been growing steadily since reaching bottom in early 2011 and has recovered to an annual total rate of $92 billion in 2018. Spending increased an average of 13%/year for six years from 2012 through 2017. Spending growth will be flat in 2019 and 2020 but we are currently near the all-time high. It is worth noting that the $92 billion in 2018 dollars after accounting for inflation is still 30% lower than the $90 billion of spending in 2007.
Commercial/Retail construction spending is forecast to reach $92 billion in 2018, $91 billion in 2019 and $90 billion in 2020, flat to no growth after seven strong years.
Office
Starts finished 2018 up 8%. In 2016 starts were up 30% and had reached similar too highs in 1998 and 2006-2007. Starts have been increasing since 2010 with the strongest growth period 2013-2016, up 25%/year. Although the rate of growth slowed in 2017 and 2018, the total amount of starts is at an all-time high. In the last 12 months there are no less than a dozen project starts valued each at over $500 million, a few of those over $1 billion. That high-volume period of starts will elevate spending through 2019 and well into 2020. Data centers are included in Office.

Backlog for 2017 was the highest in at least 8 years, more than double at the start of 2014 when the current growth cycle of office construction spending began. For 2018, backlog reached a new high, up 25% over 2017. Starting backlog for 2019, up 19%, is three times what it was just five years ago. Office starting backlog 2017-2019 increased an average of 20%/year. Backlog growth should support strong spending into 2020.
Growth of only 1% in starts for 2019 and 3% increase for 2020 keeps office starts near the all-time high. Even with low growth in new starts for the next two years, the amount of work in backlog from starts on record provides growth in spending for the next three years.
Spending increased by 20%/year from 2013 to 2016, but in 2017 it turned to a 1% decline. That was unusual and unexpected since 2016 starts and 2017 backlog had both reached 10-year highs. Possible explanations might be: a very large number of projects were canceled or delayed; potential revisions to 2017 Office spending may still be pending (In July every year, the previous two years of spending gets revised); but highly probable is the sample size of starts increased dramatically in 2016 and the 30% increase in starts was not all growth in real volume but was partially just a change in sample size, therefore the spending forecast may have been significantly overstated.
Again, it is worth noting that spending in 2018, which for the first time returned to the previous highs posted in 2008, once adjusted for inflation is still about 25% lower in real volume than 2008.
Office construction spending is forecast to reach $74 billion in 2018, $79 billion in 2019 and $84 billion in 2020.
Lodging
Lodging posted a new high for starts in 2018, up 8% over 2017. For the period 2011-2016 starts averaged over 30%/year growth for six years. In 2017, starts declined 4% but that remained near the 2016 high. Now with a gain in 2018, those three years average very evenly. Peak starts were in 2016.
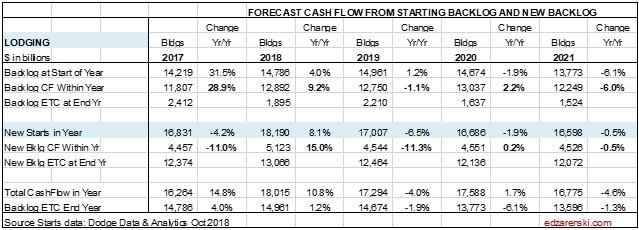
Starting backlog averaged increases of 30%/yr. from 2015 to 2017. Lodging starting backlog jumped from $7 billion/yr. in 2014 to $15 billion/yr. in 2018. It has supported similar spending growth. Lodging projects have relatively short duration and timing of starts within the year is important to spending and next-year starting backlog. Compared to most other types of nonresidential buildings, a greater than average percentage of lodging spending occurs within the year started. So, movement in starts has a greater impact on spending within the year.
Lodging spending recorded the largest drop of any market, falling 75% from $36 billion in 2008 to $9 billion in 2011. However, it also recorded the strongest rebound of any market, climbing 20% to 30% per year for the 5-years 2012-2016. In 2011, Lodging dropped to only 3% of total sector spending. It rebounded to 7% in 2017. Lodging actual spending increased 12% in 2018. It’s still not back to the previous high of $36 billion in 2008. Beyond 2018, spending will decline, but this is after 6 years of growth totaling 300%.
Lodging construction spending for 2018 is forecast to reach $32 billion, an increase of 12% over 2017. Spending is forecast at $31 billion for 2019 and $32 billion for 2020.

Religious and Public Safety
Spending of $11-$12 billion/year represents only 2.5% of total nonresidential building spending. In 2008-2009 it was 5% of the total. The religious building market has been declining since 2002 and is down 55% since then. Public Safety peaked in 2009 and has declined every year through 2017, down 40% from the peak. In 2018, public safety spending is increasing.
I don’t track starts or backlog for these markets. I do track monthly spending and carry a forecast in the Table of Construction Spending classified as Other Nonres Buildings.
Religious and Public Safety currently amounts to $12 billion/year. A 10% change in spending of $1.2 billion in a year would amount to only 0.2% change in all nonresidential buildings spending. This category doesn’t often change by 10% yr/yr, so it’s affect is very small.
Manufacturing
Manufacturing reached record high starts in 2014 and record spending in 2015, posting a 100% increase in new starts in 2014 that drove starting backlog and spending to new highs in 2015 and 2016. New starts declined 20%-30%/year for the next two years after the high in 2014 but then 2017 starts increased 27%. Now 2018 starts have increased by 18%, yet that is still 15% lower than 2014.
Starts in June came in at four times the average of all monthly starts in the last three years. October came in at three times the average. Those two months would add up to more than half of annual starts for any of the last three years. Some of these projects will still be contributing to spending in 2023.

Starting Backlog remained equally high in 2015 and 2016, but then dropped 17% in 2017. Backlog dropped 17% in 2017 and actual spending dropped 13%. That was expected. What was unexpected is that 2017 posted another very strong year of new starts, up 27%. This will support a spending rebound in the future but not before a temporary drop in mid-year 2019.
Spending was forecast to fall in 2017 after peaking in 2015 from massive growth in new starts in 2014. Based on cash flows from starts, from April 2016 through the end of 2017 spending was expected to decline in 17 of 21 months. It did decline in 14 of those months. Over the next 30 months there are only six months have a forecast to decline, all of those between March and September 2019, all caused by uneven cash flows from very large projects either ending or pushing spending out to future years. This will hold down total spending in 2019. Although backlog for 2019 is up 40%, much of the cash flow from that will occur in 2020.
Manufacturing construction spending is forecast to reach $67 billion in 2018, $65 billion in 2019 and then jump 25% to $82 billion in 2020. Given the growth in backlog and some very long duration projects started recently, spending growth may increase again in 2021.
Non-building Infrastructure Spending
Non-building Infrastructure construction spending is forecast to increase 7.2% to $316 billion in 2018, 5.5% to $334 billion in 2019 and 9.9% to $367 billion in 2020. The forecast growth for 2019 will be supported by Transportation and Public Works but will be held down somewhat by Highway. Transportation terminals and rail project starts both increased more than 100% in 2017 and both are long duration projects types that will contribute spending for several years. Environmental Public Works project starts increased 20% in 2018 and boost spending in 2019 and 2020.

Non-building Infrastructure constant $ volume reached a high of $309 billion in 2015 and peaked at the all-time high of $311 billion in 2016, but then dropped to $295 billion in 2017. 2018 saw a return to $303 billion and 2019 is projected to reach $309 billion. Only twice before, 2008 and 2009, did Infrastructure exceed $300 billion. Constant $ spending or real volume growth has been within +/- 3% for the last 5 years.

Non-building Infrastructure spending, always the most volatile sector, in mid-2017 dropped to 2013 lows. However, this short dip was predicted. Cash flow models of Infrastructure starts from the last several years predicted that dips in monthly spending would be caused by uneven project closeouts from projects that started several years ago, particularly in Power and Highway markets.

Current backlog is at an all-time high, up 10%+ each of the last 3 years, and spending is expected to follow the increased cash flows from the elevated backlog. Transportation terminals new starts in 2017 jumped 120%. Rail project starts increased more than 100%. Starting backlog for all transportation work is the highest ever, up 100% in the last two years. Transportation spending is projected to increase 15-20%/year for the next two years.
No future growth is included from infrastructure stimulus and yet 2018 spending is projected to increase by 7%. 2019 and 2020 are forecast to increase 6% to 10%.
Power
Power spending as reported by U.S. Census includes infrastructure for all electric power generation plants and distribution, gas and LNG facilities and all pipelines. In the last year there were more than twenty $billion+ project starts and a dozen more projects valued over $500 million each. In 2015 pipeline starts represented less than 10% of all power starts. In 2018 year-to-date, pipelines are half of all power work started. In three years, pipeline work increased by more than $20 billion or 500%.
Starts, completions and pauses in work cause erratic movement in actual spending. Cash flow may be adversely impacted by very large projects ending or by the delay of large projects that started previously. A multi-billion-dollar nuclear power plant stopped work and large pipeline project delays after the start was recorded have adversely impacted the cash flow forecast. This impacted the spending forecast in 2017, which finished down 5%, 15% below initial projections, and again 2018 will finish 10% below initial projections for 2018 posted back in Nov. 2017.

Although total power starts for 2018 are down 13%, electric / power generation is down 35% but gas/LNG and pipelines starts are up. Starts peaked in 2015-2016, but total in backlog reached a peak in 2018. However, much of this work is very long duration projects, so 2018 backlog will be providing spending at least through 2021. Spending could see 5% gains in 2019 but unless 2019 starts increase 2020 will experience a modest decline. Dodge is predicting 2019 starts will decline 3%.
Power construction spending is forecast to reach $102 billion in 2018, $109 billion in 2019 but then only $107 billion in 2020.
Power spending highlights one of the biggest shortfalls of judging expected performance based on year-to-date change. Notice in the 1st quarter of 2018, spending year-to-date (YTD) was down 8% to 10% from 2017. It is clear now that did not give a good indication of how 2018 would proceed. A better indication is provided by the trend line expected in the current year versus the trend line in the previous year. If they diverge, then early YTD changes will not give a clear indication of expected performance in the current year. An example follows. Note, SAAR data shows performance trend but cumulative NSA$ is needed to get YTD$.
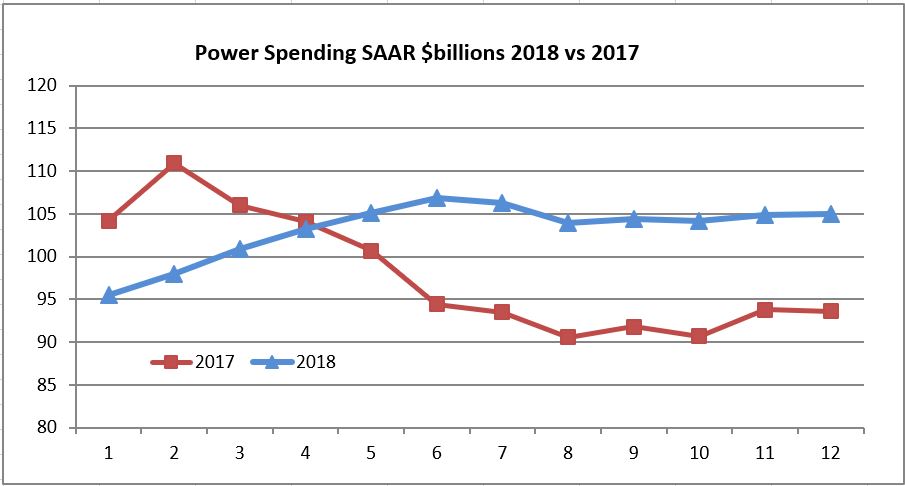
![]()
Power posted the highest spending for 2017 early in the year, then declined in the 2nd half. In 2018, the beginning of the year posted the lowest rate of spending for the year, increased through June, then stayed higher in the 2nd half. The YTD percent growth compared to 2017 has been increasing throughout the year. Higher spending in the 2nd half 2018 compared to the lowest values of the year in late 2017 will boost year-to-date spending every month through year end. Although YTD spending through August is up only 2%, I expect the total for the year will finish up 6%. Even if power spending declines 1% per month for the remainder of the year it will still finish up 5% over 2017.
Highway/Street/Bridge
Highway starts hit an all-time high in 2017 and are forecast to climb another 8% in 2018. This model is predicting starts growth will slow or level off after 2018.

Starting backlog increased 30% in the last 3 years and will increase another 14% leading into 2019. This long duration backlog is going to provide for a large increase in spending but not until late 2020 and even more-so into 2021.
Spending in 2018 did not increase in tandem with backlog, because the share of spending within the year from projects that started 1 or 2 years before began to decline. In 2020 and 2021, the share of spending within the year from projects that started 2, 3 and 4 years before is increasing.
Highway construction spending is forecast to reach $92 billion in 2018, $93 billion and then jump to $105 billion in 2020. 2021 may see an increase of 10% in spending.
Transportation
Transportation starts have two main parts, Terminals and Rail. Some analysts include transportation in nonresidential buildings. That does not account that airports include not only land-side terminals but also air-side runway work and rail includes platforms and all railway right of way work, which includes massive civil engineering structures. About half of all transportation spending is rail work.
Terminals and rail starts reached record high in 2017, both up 120% after a 35% increase in 2016. Spending in 2018 is forecast to finish up more than 20%. Starting Backlog increased 22% in 2017 then jumped 95% in 2018. However, Transportation sample size of new starts potentially increased 30%, far more than any other market. A large portion of the 2017 increase in starts is expected to be change in sample size. This model adjusts 2017 starts down by 20%. Still, most of that backlog spending will occur in future years. Some of the project starts in 2016 and 2017 have an eight-year duration. In the last 24 months there have been sixteen $billion+ new project starts and seven $500million+ new starts.

2018 total starts are 100% higher than any other year prior to 2017. Starting Backlog skyrocketed from $15 billion in 2016 to $55 billion for 2019. Backlog will support spending for several years to come. Keep in mind, when a $4 billion project first gets recorded in starts, that is the general contract. Many subcontracts will be awarded by the general contractor over the next few years.
Based on predicted cash flows from starts, spending is expected to increase at least into mid-2021. 2018-2019-2020 should see increases of 15% to 20%/year. Dodge is forecasting 2019 starts will stay close to the elevated levels of 2017 and 2018. I’m predicting starts in 2019 will decline from 2018 simply due to the huge volume of new work that started in the last two years. Even with that, backlog could set a record high in 2020.
Transportation construction spending is forecast to reach $55 billion in 2018, $62 billion in 2019 and $75 billion in 2020. Given the growth in backlog and some very long duration projects started recently, spending growth may increase again in 2021.
Environmental Public Works
Environmental Public Works includes sewerage projects, Water supply and Conservation, or Dams, water resource and river/harbor projects. New starts for all these type projects declined from 2014 through 2017. Then all showed gains in 2018 and the forecast is more gains in 2019. All of these projects are public spending and saw no real gains in spending from 2010 through 2017. With the projected increases in starts in 2018 and 2019, spending is now forecast to increase the next three years to a new high by 2020.

Public Works construction spending is forecast to grow 9% to reach $43 billion in 2018, $46 billion in 2019 and $56 billion in 2020.
Communications
Starts data for communications is not regularly reported. Total starts for the year is always recorded well after year end. A moderate forecast is included for future starts growth the next two years.
Actual spending is erratic, up 10% one year down 3% the next then up 25% followed by 2% growth. 2018 should finish down 1% after a 12% gain in 2017. The forecast shows a 5% decline in 2019 and flat spending into 2020.

Communication construction spending was up 12% in 2017 and finished at $24.8 billion The forecast for 2018 is down 1% to $24.5 billion. Expect $23 billion in 2019 and $23 billion in 2020.
For a PDF of this Nonresidential report 2019 Construct Econ Forecast – NONRES – Dec 2018 RVSD 12-6-18

2019 Construction Economic Forecast – Summary – Dec 2018
Construction Analytics 2019 Construction Economic Forecast
This Dec. 2018 Construction Economic Forecast analysis addresses New Construction Starts, Inflation, Cash Flow or distribution of construction work over time, Annual Backlog and Spending. New Starts is new work entering Backlog. Cash Flow gives the pattern of Spending. Inflation differentiates between Revenue and Volume. Backlog, which can be referenced to assess expected future Volume and Spending, provides an indication of when Volume occurs or in what year Revenues occur. Starts data is from Dodge Data & Analytics. Spending data is from the U.S. Census Bureau. Jobs data is from the Bureau of Labor Statistics. Inflation data is from the source labeled. Cash flow, Backlog and Inflation forecast data are developed internally. All data in this report is national level data. All forecast data is by Construction Analytics.
NOTE 12-6-18: Dodge Data and Analytics new construction starts for October, released 11-20-18, reached the 2nd highest seasonally adjusted annual rate ever, 2nd only to June 2018. Most spending from these new starts will occur in 2020. U.S. Census construction spending for October posted large reductions to several months of residential spending. Construction Starts for October, the Dodge end-of-year report and October spending, all released between 11-21-18 and 12-3-18 significantly alter this analysis, by far most of the 2019 and 2020 changes are significant reductions in residential spending. See the 2019 Construction Economic Forecast – Nonresidential for detail on all nonresidential and non-building markets
This analysis was edited to include the most recent starts data and the U S Census October spending data.
For a fully formatted PDF of this Report click
2019 Construction Economic Forecast – Summary – Dec 2018
Link to the 2019 Nonresidential Forecast Report
2019 Construction Economic Forecast – Nonresidential – Nov 2018
Summary
Total of All construction spending is forecast to increase 6.0% to $1.321 trillion in 2018 and 1.5% to $1.341 trillion in 2019. Spending in 2020 is forecast to reach $1.426 trillion.

Nonresidential Buildings construction spending is forecast to increase 5.8% to $444 billion in 2018, dip -0.2% to $443 billion in 2019 and climb 8.9% to $482 billion in 2020. Office (which includes data centers) and Amusement/Recreation support the 2019 but there is downward pressure from slowdowns or timing of cash flow in Manufacturing, Lodging, Healthcare and Educational. Educational, Healthcare, Recreation, Office and Manufacturing all support growth in 2020.
Residential construction spending for 2018 was recently revised down and starts for 2019 are expected flat to down slightly. The forecast is now for an increase of 5.6% to $562 billion in 2018, 0.5% to $564 billion in 2019 and 2.3% to $577 billion in 2020. Although residential spending is still increasing, growth has slowed to less than inflation. Real volume after inflation is declining.
Nonbuilding Infrastructure construction spending is forecast to increase 7.2% to $316 billion in 2018, 5.5% to $334 billion in 2019 and 9.9% to $367 billion in 2020. Transportation spending provides strong growth for the next three years from record new starts in 2017 and the 2nd best year of starts in 2018. Public Works had strong growth in 2018 starts and Highway starts hit a new high in 2018.

In July of the following year the spending data for the previous two years gets revised. Those revisions are always up, although some markets may increase while others decrease. So, even though the current forecast for 2018 is $1,321 trillion, a gain of 6.0%, that will most likely increase.
Dodge Data construction starts are initially anticipated to finish 2018 flat compared to 2017. However, starts are always revised upward in the following year. I expect revisions will show 2018 starts increased by 4% over 2017. Even with revisions, 2018 starts will post the slowest growth since 2011. Starts increased 84% in the period 2012-2017, residential 150% and nonresidential buildings 80%. This forecast includes only a total of 10% new starts growth for the 3-year period 2018-2020.
Starting backlog, currently at an all-time high, increased on average 10%/year the last three years. For 2019 starting backlog is forecast up 10% over 2018. 80% of all Nonresidential spending within the year will be generated from projects in starting backlog. Due to long duration jobs, 2019 nonresidential buildings starting backlog is up 50% in the last 4 years. Current indications are that 2019 backlog will be up 6%-8% across all sectors.
Construction Inflation Indices
When construction is very actively growing, total construction costs typically increase more rapidly than the net cost of labor and materials. In active markets overhead and profit margins increase in response to increased demand. These costs are captured only in Selling Price, or final cost indices.
General construction cost indices and Input price indices that don’t track whole building final cost do not capture the full cost of inflation on construction projects.
Revenue is spending but real volume is spending minus inflation. Outside of recession years, nonresidential buildings construction spending year over year growth dropped below 4% only SIX times in 50 years. The long-term average inflation is 3.75%. Every year that spending dropped below 4% growth, nonresidential buildings real volume declined.
To differentiate between Revenue and Volume you must use actual final cost indices, otherwise known as selling price indices, to properly adjust the cost of construction over time.
Construction Analytics Nonresidential buildings inflation forecast for 2018 is 4.9%. Current reliable inflation forecasts range from 4.7% to 5.6%. Spending needs to grow at a minimum of 4.7% just to stay ahead of construction inflation. Inflation in this sector has been at 4% or higher the last four years.
Selling Price is whole building actual final cost. Selling price indices track the final cost of construction, which includes, in addition to costs of labor and materials and sales/use taxes, general contractor and sub-contractor margins or overhead and profit.
Construction Analytics Building Cost Index, Turner Building Cost Index, Rider Levett Bucknall Cost Index, Beck Cost Index and Mortenson Cost Index are all examples of whole building cost indices that measure final selling price of nonresidential buildings only. The individual average annual growth for all these indices over the past 4-years is 4.6%/year.
Producer Price Index (PPI) for Construction Inputs is an example of a commonly referenced construction cost index that does not represent whole building costs. The PPI tracks material cost at the producer level, not prices or bids at the contractor as-built level.
Engineering News Record Building Cost Index (ENRBCI) and RSMeans Cost Index are examples of commonly used indices that DO NOT represent whole building costs yet are commonly used to adjust project costs. The ENRBCI tracks a limited market basket of labor and materials. RSMeans holds the quantity of materials and labor for a building constant. Neither index addresses contractor margins. However, they are useful in that they also publish input cost indices from many cities. This provides a reference to compare those cities to the national average, but still, only for a limited basket of labor and materials. Neither gives any indication of the level of market activity in an area.
Residential construction saw a slowdown in inflation to only +3.5% in 2015. However, the average inflation for six years from 2013 to 2018 is 5.7%. It peaked at 8% in 2013. It climbed back over 5% for 2016 and currently is near 5.5% in 2018. Anticipate national average residential construction inflation for 2018 at least 5.5 % to 6%.
Nonresidential Buildings indices have averaged 4% to 4.5% over the last five years and have reached over 5% in the last three years. Nonresidential buildings inflation totaled 18% in the last four years. My forecast shows nonresidential buildings spending in 2018 will reach the fastest rate of growth in three years, which historically has led to accelerated inflation.
There are clear signs of increasing construction activity and a tightening construction labor market. The national construction unemployment rate recently posted below 4%, the lowest on record with data back to 2000. During the previous expansion it hit a low average of 5%. During the recession it went as high as 25%. The average has been below 5% for the last 18 months. An unemployment rate this low potentially signifies labor shortages. The Job Openings and Labor Turnover Survey (JOLTS) for construction is at or near all-time highs. A tight labor market will keep labor costs climbing at the fastest rate in years. Labor shortages cause contractors to pay premiums over and above normal wage increases to keep workers from leaving. Some premiums accelerate labor cost inflation but are not recorded in published wage data.
Recent news of tariffs has extended beyond just steel. I calculated a 25% tariff on raw steel would add 1% to the cost of nonresidential steel buildings. Hi-rise residential buildings, if building is structural steel, would fall in this category. Wood framed residential impact would be small. A 25% increase in mill steel could add 0.65% to final cost of building just for the structure. It adds 1.0% for all steel in a building. If your building is not a steel structure, steel still potentially adds 0.35%.
Anticipate national average construction inflation for nonresidential buildings for 2018 and 2019, including steel impact, of 4.25% to 5.5%, rather than the long-term growth average of 4%. Adjust for any other yet unknown tariffs that may hit after Jan 1, 2019.
In the following plot, Construction Analytics Building Cost Index annual percent change for nonresidential buildings is plotted as a line against a bar chart background of the range of all other nonresidential building inflation indices. Usually the lows are formed by market basket input indices while the highs are formed by other selling price indices.
As noted above, some reliable nonresidential selling price indexes have been over 4% since 2014. Currently most selling price indices are over 5% inflation in 2018. Notice during that same period seldom did any input indices climbed above 3%.

Every index as published has its own base year = 100, generally the year the index was first created, and they all vary. All indices here are converted to the same base year, 2017 = 100, for ease of comparison. No data is changed from the original published indices.
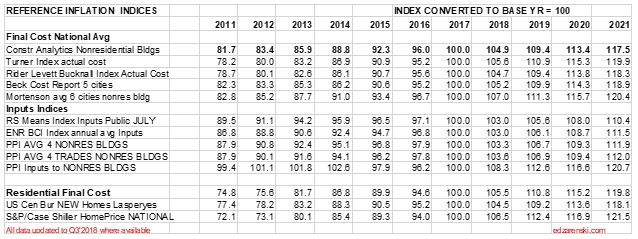
Non-building Infrastructure indices are far more market specific than any other type of index. Reference specific Infrastructure indices rather than any average.
These links point to comprehensive coverage of the topic inflation and are recommended reading.
Click Here for Link to a 20-year Table of 25 Indices
Click Here for Cost Inflation Commentary – text on Current Inflation
Current$ vs Constant$
Comparing current $ spending to previous year spending does not give any indication if business volume is increasing. The inflation factor is missing. If spending is increasing at 5%/year at a time when inflation is 4%/year, real volume is increasing by only 1%.
The current Nonresidential buildings forecast of spending growth at 6.0% for 2018 would suggest that after inflation, nonresidential buildings construction volume is growing slightly. So expect volume growth in 2018, but next year 4.3% inflation and no spending growth is signaling a volume decline in 2019.
Nonresidential spending increased 43% since 2010, but there was 30% inflation. Real nonresidential volume since 2010 has increased by only 12%. Nonresidential jobs increased by 27% during that period, 15% greater than volume growth.
Residential spending increased by 110% since 2010, but after inflation, real residential volume increased by only 57%. Jobs increased by only 37%, 20% short of volume growth.
When comparing inflation adjusted constant dollars, 2018 spending will still be lower than all years from 1998 through 2007. In 2005 constant $ volume reached a peak at $1,450 billion. At current rates of growth, we would not eclipse the previous high before 2022.

Spending in current $ is 14% higher than the previous 2006 high spending.
Volume after adjusting for inflation is still 14% lower than the previous 2005 high volume.
Jobs and Volume
The period 2011-2017 shows both spending and jobs growth at or near record highs.
A spending forecast of 6.6%+ in 2018, or an increase of $83 billion in construction spending, demands a few words on jobs growth. Construction requires about 5000 workers for every added $1 billion in construction “volume”. But construction jobs growth seems to closely follow growth in spending. Construction jobs have increased by 400,000 in a year only four times in the last 50 years, each time accompanied by one of the four highest spending growth increases in 50 years. However, $80 billion in added spending is not the same as $80 billion in volume, and jobs needed is based on volume.
Although spending will increase 6.6%, construction inflation has been hovering near 4.5% for the last five years. Real volume growth in 2018 after inflation is expected to be near 2% or only $26 billion. That would mean the need, if there are no changes in productivity, is to add only about 130,000 additional jobs in 2018, a rate of growth that is well within reach. That is less than the average jobs growth for the last seven years.
Construction added 1,400,000 jobs in the last 5 years, an average of 280,000/year. The only time in history that exceeded jobs growth like that was the period 1993-99 with the highest 5-year growth ever of 1,483,000 jobs. That same 1993-99 period had the previous highest 5-year spending and volume growth going back to 1984-88.
Total spending increased 60%+ since 2010, but with 30% inflation. Real total volume since 2010 has increased by only about 30%. Jobs also increased by 30%, in balance with need. But the results are much different for Residential than Nonresidential.
Nonresidential spending increased 50% since 2010 with 35% inflation. Nonresidential volume since 2010 has increased by only 15%. Jobs increased by 27%, 12% in excess of volume growth.
Residential spending increased by 125% since 2010, but after 40% inflation, real residential volume increased by 85%. Jobs increased by only 40%, 45% short of volume growth.
Residential construction labor cannot be directly compared to residential volume because
- Some residential high-rise jobs, for example structure, are performed by firms whose primary activity is commercial construction. Those jobs are classified as nonresidential.
- Buildings that are multi-use commercial retail and residential, even lo-rise, may be built by contractors whose firms are classified nonresidential labor. The construction spending would be broken out to residential and nonresidential, but the labor would not.
- Some residential immigrant labor is not counted
For these reasons, it is best to simplify comparisons of spending activity to total labor.
For more on Jobs see Construction Jobs and Residential Construction Jobs Shortages
New Construction Starts
New construction starts for the six months in the 1st half 2018 reached an all-time high.
New Construction Starts three-month average for May-Jun-Jul is $840 billion, all-time high.
Year-to-date (YTD) 2018 starts are currently reported as up only 2% from 2017, but 2017 starts through September have already been revised up by 9%, 10% in nonresidential buildings, 16% in non-buildings and 3% in residential. 2018 starts will not be revised until next year. Revisions have always been up.
Revisions for the last 10 years averaged more than +7%/yr., with most of the upward revision in nonresidential buildings. Revisions to nonresidential buildings have been greater than 10%/year for the last 7 years. Therefore, 2018 starts growth is very likely under-reported.
All construction starts data in this report references Dodge Data & Analytics Starts Data.
Dodge releases its first forecast of next year’s starts every year in the 4th quarter. Last year the first forecast for 2018 was for starts to increase 3% to $765 billion. 2018 starts, based on data as of September, could reach $806 billion, but at first appearing to show no gain from 2017. That’s because 2017 has already been revised up by $50 billion. After 2018 revisions are posted next year, 2018 starts could reach $830-$840 billion. Dodge forecast 2019 starts at $808 billion, no change from 2018. This will be subject to two upward revisions.
- Previous year starts always later get revised upwards. Therefore, current year starts YTD growth is always understated. This analysis compensates for that.
- New starts will generate record high starting backlog for every sector in 2019.
- Even a low forecast for starts in 2019 produces record backlog for 2020.
For nonresidential buildings spending, long duration jobs can sometimes have a 5 to 6-year schedule. On average most years have at least some projects start that will be under construction for 4 years. For an entire year’s worth of starts, approximately 20% of the spending occurs in the year started, 50% in the next year, 25% in the third year and only 5% in the fourth year or later year. Residential starts contribute spending into the third year. This means that nonresidential spending growth in 2019 is still being affected by starts from 2016 and residential growth from starts in 2017. This also means that nonresidential spending growth in 2019 is still being affected by starts from 2016.
The next two plots show the 3-month moving average and trend line of starts for Residential and Nonresidential Buildings. Starts can be erratic from month to month. The trend line gives a better impression of how starts impact spending. It is the rate of change in starts cash flows that provides a predicting tool for spending.

The plot below is an index. The plot shows greater accuracy in the forecast when the slope of the predicted cash flow and actual spending plot lines move in the same direction. It’s not the spread between the lines that gives any indication. If the slope of the lines is the same, then the cash flow accurately predicted the spending.
The light green line for nonresidential buildings spending estimated from starts cash flow shows smooth spending, even though actual monthly starts are erratic (see nonres bldgs plot shown above). The actual spending often follows close to the pattern estimated from cash flows.

Starts are sometimes misinterpreted in common industry forecasting articles. Starts dollar values represent a survey of about 50% to 60% of industry activity, therefore Starts dollar values cannot ever be used directly to indicate the volume of spending. Also, Starts do not directly indicate changes in spending per month or per year. Only by including an expected duration for all Starts and producing a forecast Cash Flow from Starts data can the expected pattern of spending be developed. Finally, it is the rate of change in Starts Cash Flows that gives an indication of the rate of change in spending.
Starting Backlog
Nonresidential Buildings starting backlog at the beginning of 2018 reached an all-time high. For nonresidential buildings this backlog will contribute spending until the end of 2021. 2019 Backlog is forecast to increase 8%. For purposes of this analysis, I’ve set only moderate or low increases in starts for 2020 and 2021, so this forecast may hold down the future backlog and spending forecast. However, backlog leading into 2019 is up 70% in 5 years.

Starting Backlog is the Estimate-to-Complete (ETC) value of all projects under contract at the beginning of a period. Projects in starting backlog could have started last month or last year or several years ago.
- 75%-80% of all Nonresidential Buildings spending within the year will be generated from projects in starting backlog.
- 80%-85% of all Non-Building Infrastructure spending within the year will be generated from projects in starting backlog.
- 70% of All Residential spending within the year is generated from new starts, but this is weighted because 85% of all residential work is short duration single family and renovation work.
- 65% on long duration Multifamily Residential spending within the year will be generated from projects in starting backlog.
Non-building Infrastructure starting backlog at the beginning of 2018 reached an all-time high. Some of this is very long-term work that will contribute spending until the end of 2025. In fact, more than half of all spending in 2019 comes from projects that started prior to Jan 2018. 2019 Backlog is forecast to increase 10%. Backlog is up 45% in 5 years but is up 50% in just the last 3 years.

Multifamily residential has a longer duration and a greater percentage of spending comes from backlog. But, due to the shorter duration of projects, about 75% of single family and residential renovation spending within the year is generated from new starts. Unlike nonresidential, backlog does not contribute nearly as much short-term residential spending within the year.
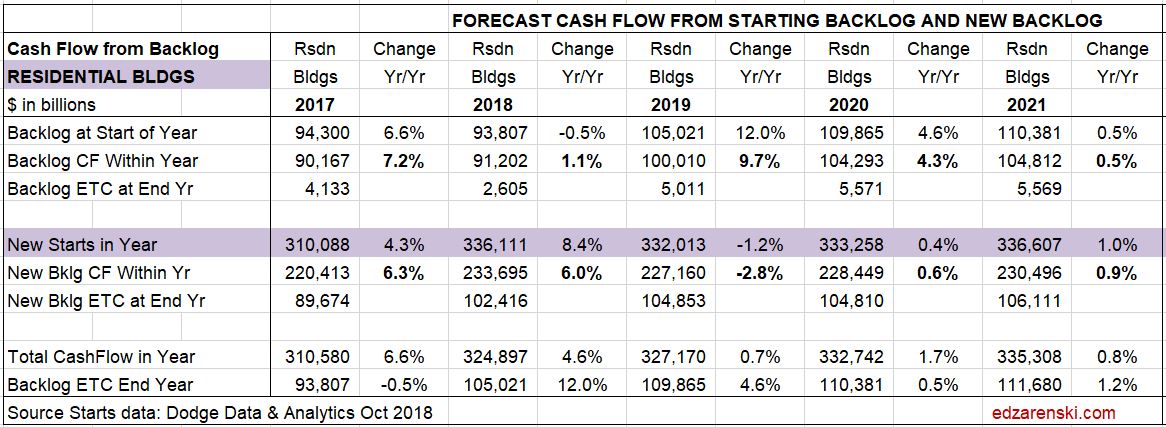
Cash Flow
Simply referencing total new starts or backlog does not give an indication of spending within the next calendar year. Projects, from start to completion, can have significantly different duration. Whereas a residential project may have a duration of 6 to 12 months, an office building could have a duration of 18 to 24 months and a billion-dollar infrastructure project could have a duration of 3 to 4 years. New starts within any given year could contribute spending spread out over several years. Cash flow totals of all jobs can vary considerably from month to month, are not only driven by new jobs starting but also by old jobs ending, and are heavily dependent on the type, size and duration of jobs.
Cash flow from all starts still in backlog supports a 2018 spending forecast of $1,321 billion, a spending increase of 6.0% over 2017. The forecast for 2019, based on a minimal increase in starts, is $1,341 billion, an increase of only 1.5% over 2018. Dodge initial November 2018 forecast for 2019 construction starts is for $808 billion, no gain over 2018. However, subsequent revisions may increase that a few percent.
The following table illustrates the difference between Starts and Cash flow. It shows Manufacturing Bldgs. projects in backlog as of October 2018 and predicted starts in 2018 through 2021. Note there are sometimes vast differences between amounts of Starts, whether already in Backlog at beginning of year or New Starts within the year, and Cash Flow from Backlog and New Starts.
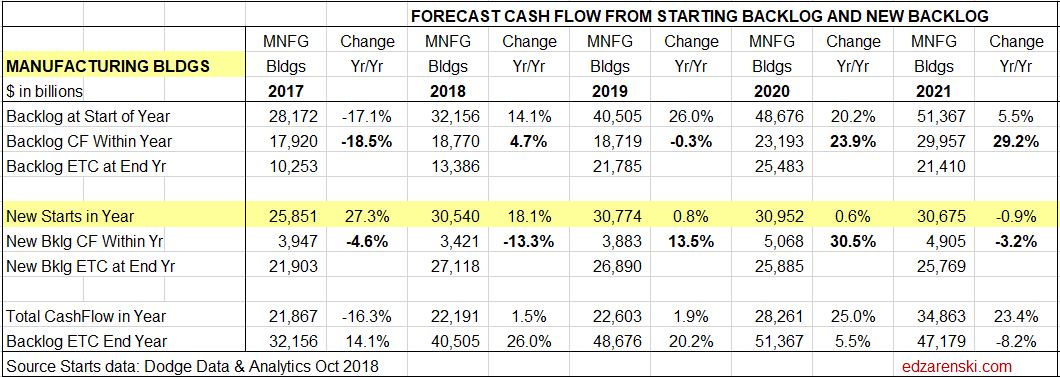
Cash Flow modeling predicted a huge decline of -16% in manufacturing spending in 2017. This was in stark contrast to seven other economic analysts who predicted spending would be between -7% and +7%, for an average of +0.4% as reported in the January 2017 AIA Consensus. Manufacturing spending actually ended the year at -13.0%. Obviously, there is no correlation between a 25% increase in new starts within the year and a predicted -16% drop in spending. The actual -13% drop in 2017 spending reflects a return to normal after an unusually large volume of spending in 2015 and 2016 that was generated by a record volume of starts in 2014.
Note that new manufacturing starts were up 27% in 2017 and could be up 18% in 2018, yet 2018 spending is forecast to increase only 1.5%. This is due to projects that started several years ago but are now coming to an end. They are dropping out of the monthly cash flows and holding down 2018 spending even though starts have been up substantially for two years. This substantial volume of new starts in 2017 and 2018 will be providing a boost to spending in 2020 and 2021.
Spending
Total of All construction spending is forecast to increase 6.0% to $1.321 trillion in 2018 and 1.5% to $1.341 trillion in 2019 and 6.3% to $1.426 trillion in 2020.

Construction spending is strongly influenced by the pattern of continuing or ending cash flows from the previous two to three years of construction starts. Current month/month, year/year or year-to-date trends in starts often do not indicate the immediate trend in spending.
The following table clearly shows there is not a correlation between starts in any year with spending in either the current or the following year. The practice of using construction starts directly to predict spending can be very misleading in an industry that relies on data for predictive analysis to plan the future. Not only does it not predict the volume of spending in the following year, it does not even consistently predict the direction spending will take, up or down, in the following year. It’s a false indicator and it’s not a good use of data.
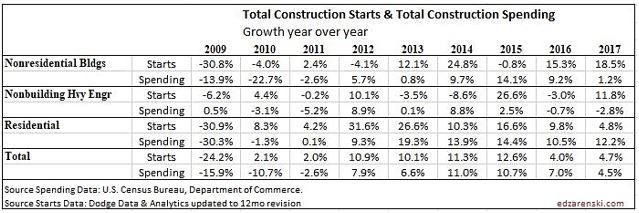
Residential Buildings Spending
Residential construction spending for 2018 was recently revised down and starts for 2019 are expected flat to down slightly. The forecast is now for an increase of 5.6% to $562 billion in 2018, 0.5% to $564 billion in 2019 and 2.3% to $577 billion in 2020.
Residential spending in 2018 slows after six years of growth all over 10%/year. Average spending growth the last seven years is 12%/year. Although Residential 2019 construction spending is still increasing slightly 0.5%, growth has slowed to less than inflation of 5%. Therefore real 2019 residential volume after inflation is forecast to decline by 4%+, the largest real volume decline since 2009. In 2018 residential spending increased 5.6%, but after inflation real volume increased only a fraction of a percent.
Residential spending in 2018 is 50% single family, 13% multi-family and 37% improvements. In 2011, improvements were 48% of residential spending.
Single Family Residential spending is more dependent on new starts within the most recent 12 months than on backlog from previous starts.

Total starts for the last 6 months are the highest since 2006, but % growth has slowed considerably. New starts in 2017 which initially posted only 2% growth have already been revised up to 4%. I expect that to be revised up to 5%. Growth of 7% is expected for 2018. Slower growth is now expected after 5 years (2012-2016) of starts increasing at an average 20%/year. Multi-Family Residential spending is more dependent on backlog.

Residential spending hits a 12-year high in 2018. Residential spending reached a current $ peak of $630 billion in 2005. 2018 pending is still 10% below that peak. In constant $, adjusted for inflation, all years from 1998 through 2007 were higher than 2018. In constant $, 2018 spending is still 27% below the 2005 peak.

Nonresidential Buildings Spending
Nonresidential Buildings construction spending is forecast to increase 5.8% to $444 billion in 2018, dip -0.2% to $443 billion in 2019 and climb 8.9% to $482 billion in 2020. Office (which includes data centers) and Amusement/Recreation support the 2019 but there is downward pressure from slowdowns or timing of cash flow in Manufacturing, Lodging, Healthcare and Educational. Educational, Healthcare, Recreation, Office and Manufacturing all support growth in 2020.

Nonresidential buildings construction spending in constant $ (inflation adjusted $) reached as high as $440 billion in 2017 but averaged only $419 billion in 2017. In 2018 it will reach a high of $430 billion but average only $424 billion. The yearly average recently peaked at $431 billion in 2016. Constant $ spending or real volume growth shows all years from 1996 through 2010 had higher volume than the 2018 forecast. Volume reached a peak $536 billion in 2000 and went over $500 billion again in 2008. In constant $ 2018 is still 20% below that 2000 peak.
Non-building Infrastructure Spending
Non-building Infrastructure construction spending is forecast to increase 7.2% to $316 billion in 2018, 5.5% to $334 billion in 2019 and 9.9% to $367 billion in 2020. The forecast growth for 2019 will be supported by Transportation and Public Works but will be held down somewhat by Highway. Transportation terminals and rail project starts both increased more than 100% in 2017 and both are long duration projects types that will contribute spending for several years. Environmental Public Works had strong 20% growth in 2018 starts and Highway starts hit a new high in 2018.
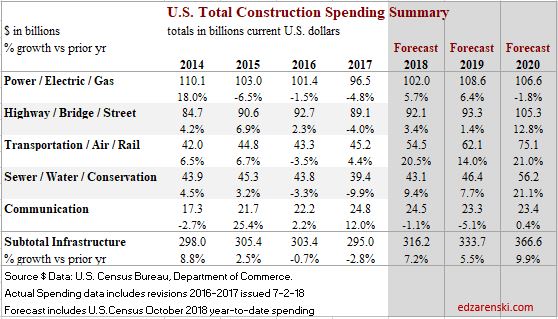
Non-building Infrastructure construction spending in constant $ (inflation adjusted $) reached $311 billion in 2016, an all-time high, but then dropped to $296 billion in 2017. In 2018 it will reach $302 billion. Constant $ spending or real volume growth has been within +/- 3% for the last 5 years.
Non-building Infrastructure spending, always the most volatile sector, in mid-2017 dropped to 2013 lows. However, this short dip was predicted. Cash flow models of Infrastructure starts from the last several years predicted that dips in monthly spending would be caused by uneven project closeouts from projects that started several years ago, particularly in Power and Highway markets.
Current backlog is at an all-time high, up 10%+ each of the last 3 years, and spending is expected to follow the increased cash flows from the elevated backlog. Transportation terminals new starts in 2017 jumped 120%. Rail project starts increased more than 100%. Starting backlog for all transportation work is the highest ever, up 100% in the last two years. Transportation spending is projected to increase 20-25%/year for the next two years.
No future growth is included from infrastructure stimulus and yet 2018 spending is projected to increase by 8%. 2019 and 2020 are forecast to increase 5% to 6%.
Public Infrastructure and Public Institutional
Less than 60% of all Non-building Infrastructure spending, about $170 billion, is publicly funded. That public subset of work averages growth of less than $10 billion/year.
About 25% of all Nonresidential Buildings spending, about $110 billion, is publicly funded, mostly Educational. Nonresidential buildings spending makes up almost 40% of Public spending.
- Infrastructure = $300 billion, ~25% of all construction spending.
- Infrastructure is about 60% public, 40% private. In 2005 it was 70% public.
- Public Infrastructure = $170 billion. Private Infrastructure = $130 billion.
- Power and Communications are privately funded infrastructure.
- Nonresidential Buildings is 25% public (mostly institutional), 75% private.
- Educational, Healthcare and Public Safety are Public Nonres Institutional Bldgs
- Public Commercial construction is not included.
- Public Institutional = $100 billion, mostly Education ($70b).

Public Infrastructure + Public Institutional = $280 billion, 23% of total construction spending.
Public Infrastructure + Institutional average growth is $12 billion/year. It has never exceeded $30 billion in growth in a single year.
See also Publicly Funded Construction
See also Down the Infrastructure Rabbit Hole
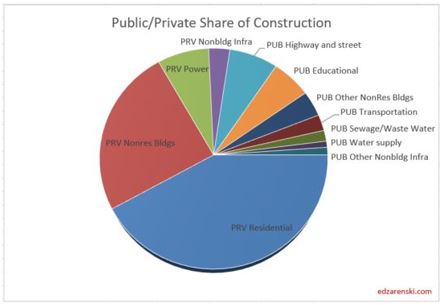
Public Spending
Total public spending for 2018 is projected to finished up 9.5% at $320 billion. Every major public market is projected to finish up for 2018. By far, the largest Public spending increases for 2018 are Highway, Transportation, Sewer and Waste Disposal and Water Supply.

The two largest markets contributing to public spending are Highway/Bridge (32% of total public spending) and Educational (25%), together accounting for nearly 60% of all public construction spending. At #3, Transportation is only about 10% of public spending. Environmental Public Works combined makes up almost 15% of public spending, but that consists of three markets, Sewage/Waste Water, Water Supply and Conservation. Office, Healthcare, Public Safety and Amusement/Recreation each account for about 3%.
Educational is 80% public, Transportation 70%, Amusement/Rec 50% and Healthcare 20% public. Power is about 6% public, along with few other smaller shares.
Public spending hit a 4-year low in mid-2017. It has been increasing since then and is now near an all-time high. I’m expecting to see strong growth through 2020.
Due to long duration job types, 2018 starting backlog is up 30% in the last 3 years. In 2018, 40% of all spending comes from jobs that started before 2017. Leading 2018 growth are Educational (+15%) and Transportation (+35%), with a combined total forecast 20% growth in public spending.
Current levels of backlog and predicted new starts gives a projection that Public Non-building Infrastructure spending will reach an all-time high in 2018 and again in 2019.

For a Full Formatted PDF of this Report click
2019 Construction Economic Forecast – Summary – Dec 2018
Link to the 2019 Nonresidential Forecast Report
2019 Construction Economic Forecast – Nonresidential – Nov 2018

Construction Spending June 2018
8-1-18
U. S. Census posted Construction Spending for June at a seasonally adjusted annual rate (SAAR) of $1,317 billion, down 1.1% from an upwardly revised May. Year-to-date, June spending is up 5.1% from 2017.
May was revised UP 1.7% from the 1st release posted 7-2-18. April was revised UP 0.8%.
Construction Spending for the 1st half 2018, in Current $, averages $1,307 billion. This is an all-time high, well above the pre-recession high spending of $1,205 billion posted in the 1st quarter of 2006. Spending has been above the 2006 high since the 4th quarter 2016. Spending total is expected to average $1,330 billion for 2018.
Constant $ shows volume reached peak during the 2nd half 2005 and 1st half 2006, with 2005 posting the peak year. 2018 constant $ inflation adjusted spending is still 14% below the 2005-2006 peak.

Total spending year to date through June is $620 billion. Historically, only 47% of annual spending occurs in the 1st 6 months. Jan, Feb and Mar are the weakest months of the year, while Jul, Aug and Sep are the strongest spending months. Therefore, this indicates a 2018 total annual spending of $1,328 billion. This agrees very close to my total 2018 spending forecast.
The headline from the St Louis Fed > Total construction spending fell 1.1% in June, the largest monthly drop in more than a year. Just remember, spending subsequently gets revised 3x and final vs 1st release has been revised UP 79 times in the last 84 months.
Top performing construction spending markets 2018 year-to-date through June are Transportation +14.3%, Public Safety +12.1%, Lodging +10.7%, Water Supply +9.7%, Sewage and Waste Disposal +9.2%, Residential +8.1% and Office 6.8%.
The only markets down year-to-date are Religious -9.1%, Manufacturing -8.7% and Power -0.4%. Religious building as a percent of total is so small (1/4 of 1%) it has negligible effect on total annual performance. However, Manufacturing and Power make up about 15% of total construction.
Residential, Office, Commercial/Retail, Lodging, Highway and Environmental Public Works (Sewage, Water, Conservation) are all ahead of expectations for the 1st half of 2018.
June construction spending data shows an unusual $9 billion (SAAR) monthly decline (-9.3%) in Educational spending. This is several billion greater than the largest decline reported during the recession, so this looks like an anomaly in the data. There has never been a monthly decline like this in the Educational market since I’ve been tracking data, back to 2001. It is double the largest non-recession decline. I expect it will be revised up substantially at some point in the future.
Transportation is another market that appears to be unusually low for June. Because the monthly variance is not wildly out of balance it passes in obscurity. But here’s what we should see. Transportation (terminals and rail) new starts in 2016 increased 34% and then in 2017 increased 120%. Most of those projects will be completed in 3 years or less, but a number of the huge projects (no less than 15 projects ranging from $1 billion to $4 billion each) have a duration of 4 to 8 years. Even with long duration cash flow spreading out the spending for all those big projects, my analysis still predicts Transportation spending up 30% in 2018. Year-to-date through June, Transportation spending is up only 14%. I’ve forecast it should be up 18%. That’s a total shortfall of about $1 billion (SAAR ~$12 billion), or about 7%/month, for 3 months. April, May and June spending are all below expectations. I expect future revisions will increase current values. Also, we will see a big jump in year-to-date over the next three months since we are currently at an SAAR above $50 billion (and increasing) and Jul-Aug-Sep were the three lowest months in 2017, below $43 billion. Also, 2017 values were revised up 4%/month after the close of the year.
Manufacturing spending as of June is reported down 8.7% year-to-date from 2017. That decline will slowly turn positive in the second half of the year to finish up 2%. Spending is currently at an SAAR above $65 billion and expected to increase through December. In 2017, spending started the year above $70 billion but decreased to $60 billion by year end. Increasing values in the 2nd half 2018 compared to decreasing values in 2017 will continually increase the year-to-date performance in the 2nd half of 2018.
Power, similar to manufacturing, posted the highest spending for 2017 early in the year, then declined. In 2018, the 1st half posted the lowest spending, so the year-to-date is currently low. Increased spending in the 2nd half 2018, compared to the lowest values of the year in 2017, will boost year-to-date spending every month through year end. Although year-to-date spending through June is down 0.4%, the total for the year could finish up 9%.
Manufacturing and Power highlight one of the biggest shortfalls of judging expected performance based on year-to-date change. It is important to look at the trend line expected in the current year versus the trend line in the previous year. If they diverge, then year-to-date change will not give a clear indication of expected performance in the current year.
Total spending has increased from an average of $1,254 billion in Q4’17 to $1,292 billion in Q1’18 to $1,321 billion in Q2’18, growth of 3.0% and 2.25% the last two quarters. I’m expecting the rate of monthly spending will be above $1,360 billion by year end. The total spending forecast for 2018 is $1,330 billion.
Residential single family spending is up 9% YTD. Multifamily is down ~1%. Total residential spending is forecast to reach $566 billion in 2018, growth of 6.4% over 2017.
Nonresidential Buildings spending YTD totals $207 billion, up only 1.9% from 2017. It is being held down by Manufacturing which is currently down 8.7% from 2017. Also, the anomaly in Educational spending, explained above, contributes to the current low performance. 2018 forecast is $445 billion, 6.2% growth over 2017, with best growth in Lodging 13%, Office 11% and Amusement/Recreation 9%.
Non-building Infrastructure will post the best year of growth since 2014 to reach a new all-time high at $319 billion. Transportation, by far, will show the best growth, nearly 30% above 2017.

June Construction Starts Reach New Highs 7-25-18
