7-25-18
New construction starts, posted today by Dodge Data & Analytics, measured in current dollars, came in at a seasonally adjusted annual rate of $896,000 million, up 11% from May. May, originally posted at +15% over April, was revised up 3.5%.
2nd qtr increased 7.5% from 1st qtr., and 1st half increased 4.5% from the previous 6 months.
The June SAAR (seasonally adjusted) amount of $896,000 million is the highest on record. However, in constant $, adjusted for inflation, there were a few months from 2004 through 2006 that would still be slightly higher. After revisions, it will likely be higher.
Year-to-date starts through June total $396,000 million, 1% higher than the same six months of 2017, but that amount is not as low as first comparison would indicate. 2017 starts through June have already been revised up by 14%, up about 20% in nonresidential and 5% in residential. 2018 starts will be revised again next year and revisions have always been up. Revisions in previous years have averaged more than +7%/yr. for the last 5 years, with most of the upward revision in nonresidential. Therefore, the potential that 2018 YTD gains at a later date will increase vs 2017 is expected.
2017 starts final, once all revisions are posted, could reach close to $800 billion.
New starts data is a sampling of project starts, representing about 60% of total work volume. Actual starts dollars cannot be used directly to represent spending. However, tracking the rate of change in predicted cash flow from starts allows to predict the rate of change in spending.
From Sept’17 through Jun’18 new construction starts reached the highest monthly average since 2004 and are now just below the all-time high.
Residential starts average for the 6 months Jan-Jun 2018 is the highest since 2006. The 1st 6 months of 2018 is up 10% from the prior 6 months.
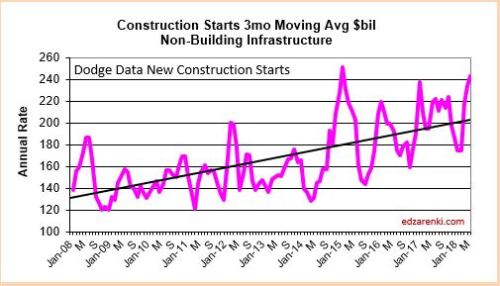
Non-building infrastructure starts for June are down 28% from May, but that is not particularly newsworthy, because May had an unusually high amount of starts. May included almost $8 billion of pipeline, rail and sewerage projects starts, 3x normal, while June settled back to normal. June Infrastructure starts are still higher than the average of the previous 6 months. The average Infrastructure starts for Apr-May-Jun is the highest since Q1 2015 when massive new starts for energy plants drove Infrastructure starts to all-time highs. Starts may finish the year close to the same as 2017, but, if slightly higher, could still be the best year of starts on record. The growth in Infrastructure starts will drive Non-building spending to record highs in 2018 through 2020.
Nonresidential buildings starts in June reached $402 billion, nudging up against the all-time constant $ high from 2008. In fact, in un-adjusted dollars current $, June 2018 starts reached a new high. Manufacturing starts are double the amount from same period in 2017 and Amusement/Recreation starts are triple last year. The only nonresidential market that is lower year-to-date is retail stores. Adjusted for inflation, Jan 2008, by a few percent, is still the best ever for nonresidential buildings starts and spending.

The plot above shows 3mo moving average and trend line for Nonresidential Buildings Starts. Starts can be erratic from month to month. The trend line gives a better impression of how starts will impact spending.
The plot below is an index. The plot shows accuracy when the predicted cash flow and actual spending plot lines move in the same direction.
The light green line, spending estimated from starts cash flow, shows smooth spending, even though actual monthly starts are erratic (see nonres bldgs plot shown above). The actual spending often follows pretty close to the pattern as that estimated from cash flows.

It’s notable that new construction starts through June are up 1% from 2017. When the 2018 forecast was first issued last November, 2017 starts were predicted to finish the year at $742 billion. The original forecast for 2018 starts growth predicted starts would increase 3% over 2017 to a 2018 total of $765 billion. Well, the current total for 2017 is now $780 billion. Since November, the 2017 base has been revised up by almost $40 billion. 2017 starts could finish close to $800 billion, more than double the original forecast % growth. And yet, the YTD total for 2018 is still 1% above that revised value.
Starts in both 2017 and 2018 are stronger than expected just 6 months ago. The current SAAR monthly $ of starts is 10% higher than anticipated just 6 months ago.
Construction spending is up year-to-date through May in every sector. Only Manufacturing and Power markets are down YTD, but not enough to drag the sectors negative. Both markets are expected to finish the year up. (Religious market is down, but represents only 0.2% of spending).
Cash flow from all starts still in backlog supports a 2018 spending forecast of $1,330 billion, a spending increase of 6.6% over 2017.
