8-1-18
U. S. Census posted Construction Spending for June at a seasonally adjusted annual rate (SAAR) of $1,317 billion, down 1.1% from an upwardly revised May. Year-to-date, June spending is up 5.1% from 2017.
May was revised UP 1.7% from the 1st release posted 7-2-18. April was revised UP 0.8%.
Construction Spending for the 1st half 2018, in Current $, averages $1,307 billion. This is an all-time high, well above the pre-recession high spending of $1,205 billion posted in the 1st quarter of 2006. Spending has been above the 2006 high since the 4th quarter 2016. Spending total is expected to average $1,330 billion for 2018.
Constant $ shows volume reached peak during the 2nd half 2005 and 1st half 2006, with 2005 posting the peak year. 2018 constant $ inflation adjusted spending is still 14% below the 2005-2006 peak.

Total spending year to date through June is $620 billion. Historically, only 47% of annual spending occurs in the 1st 6 months. Jan, Feb and Mar are the weakest months of the year, while Jul, Aug and Sep are the strongest spending months. Therefore, this indicates a 2018 total annual spending of $1,328 billion. This agrees very close to my total 2018 spending forecast.
The headline from the St Louis Fed > Total construction spending fell 1.1% in June, the largest monthly drop in more than a year. Just remember, spending subsequently gets revised 3x and final vs 1st release has been revised UP 79 times in the last 84 months.
Top performing construction spending markets 2018 year-to-date through June are Transportation +14.3%, Public Safety +12.1%, Lodging +10.7%, Water Supply +9.7%, Sewage and Waste Disposal +9.2%, Residential +8.1% and Office 6.8%.
The only markets down year-to-date are Religious -9.1%, Manufacturing -8.7% and Power -0.4%. Religious building as a percent of total is so small (1/4 of 1%) it has negligible effect on total annual performance. However, Manufacturing and Power make up about 15% of total construction.
Residential, Office, Commercial/Retail, Lodging, Highway and Environmental Public Works (Sewage, Water, Conservation) are all ahead of expectations for the 1st half of 2018.
June construction spending data shows an unusual $9 billion (SAAR) monthly decline (-9.3%) in Educational spending. This is several billion greater than the largest decline reported during the recession, so this looks like an anomaly in the data. There has never been a monthly decline like this in the Educational market since I’ve been tracking data, back to 2001. It is double the largest non-recession decline. I expect it will be revised up substantially at some point in the future.
Transportation is another market that appears to be unusually low for June. Because the monthly variance is not wildly out of balance it passes in obscurity. But here’s what we should see. Transportation (terminals and rail) new starts in 2016 increased 34% and then in 2017 increased 120%. Most of those projects will be completed in 3 years or less, but a number of the huge projects (no less than 15 projects ranging from $1 billion to $4 billion each) have a duration of 4 to 8 years. Even with long duration cash flow spreading out the spending for all those big projects, my analysis still predicts Transportation spending up 30% in 2018. Year-to-date through June, Transportation spending is up only 14%. I’ve forecast it should be up 18%. That’s a total shortfall of about $1 billion (SAAR ~$12 billion), or about 7%/month, for 3 months. April, May and June spending are all below expectations. I expect future revisions will increase current values. Also, we will see a big jump in year-to-date over the next three months since we are currently at an SAAR above $50 billion (and increasing) and Jul-Aug-Sep were the three lowest months in 2017, below $43 billion. Also, 2017 values were revised up 4%/month after the close of the year.
Manufacturing spending as of June is reported down 8.7% year-to-date from 2017. That decline will slowly turn positive in the second half of the year to finish up 2%. Spending is currently at an SAAR above $65 billion and expected to increase through December. In 2017, spending started the year above $70 billion but decreased to $60 billion by year end. Increasing values in the 2nd half 2018 compared to decreasing values in 2017 will continually increase the year-to-date performance in the 2nd half of 2018.
Power, similar to manufacturing, posted the highest spending for 2017 early in the year, then declined. In 2018, the 1st half posted the lowest spending, so the year-to-date is currently low. Increased spending in the 2nd half 2018, compared to the lowest values of the year in 2017, will boost year-to-date spending every month through year end. Although year-to-date spending through June is down 0.4%, the total for the year could finish up 9%.
Manufacturing and Power highlight one of the biggest shortfalls of judging expected performance based on year-to-date change. It is important to look at the trend line expected in the current year versus the trend line in the previous year. If they diverge, then year-to-date change will not give a clear indication of expected performance in the current year.
Total spending has increased from an average of $1,254 billion in Q4’17 to $1,292 billion in Q1’18 to $1,321 billion in Q2’18, growth of 3.0% and 2.25% the last two quarters. I’m expecting the rate of monthly spending will be above $1,360 billion by year end. The total spending forecast for 2018 is $1,330 billion.
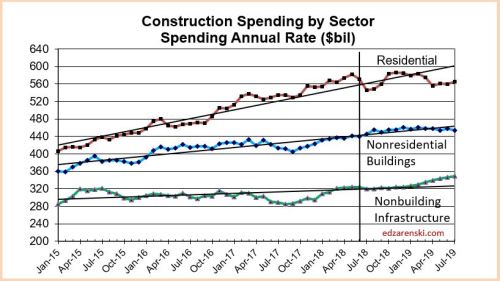
Residential single family spending is up 9% YTD. Multifamily is down ~1%. Total residential spending is forecast to reach $566 billion in 2018, growth of 6.4% over 2017.
Nonresidential Buildings spending YTD totals $207 billion, up only 1.9% from 2017. It is being held down by Manufacturing which is currently down 8.7% from 2017. Also, the anomaly in Educational spending, explained above, contributes to the current low performance. 2018 forecast is $445 billion, 6.2% growth over 2017, with best growth in Lodging 13%, Office 11% and Amusement/Recreation 9%.
Non-building Infrastructure will post the best year of growth since 2014 to reach a new all-time high at $319 billion. Transportation, by far, will show the best growth, nearly 30% above 2017.
June Construction Starts Reach New Highs 7-25-18
