Home » Materials
Category Archives: Materials
PPI Data Sept’24
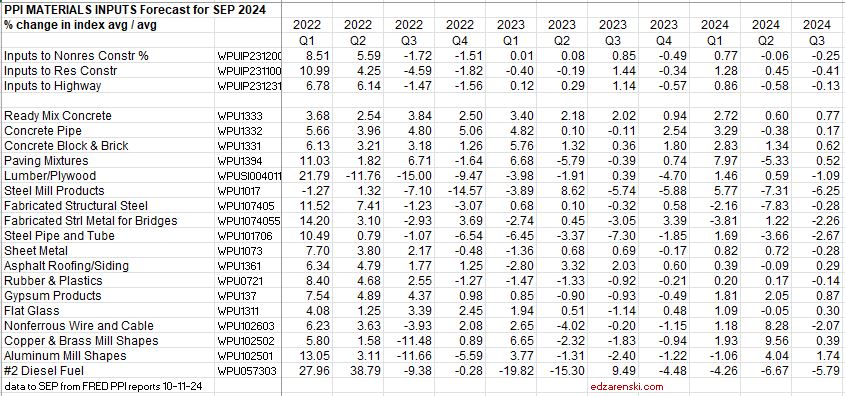
Once again, the Producer Price Index for construction materials is pretty tame with the release of the September data. For Q3, inputs to all types of construction post less than 1% growth for the quarter. This is now 6 or 7 quarters in which Inputs and Final Demand has been near 1% or lower.
Inputs year-to-date vs the 2023 average are up 1.9% for residential and up less than 1% for Nonresidential and Highway.
Individually, a few material inputs had notable moves in September: Lumber/Plywood up 1.1%, Steel Mill Products down 1.2%, Steel Pipe and Tube down 1.3%, Copper and Brass Shapes down 1.1% and Diesel down 14%.
Year-to-date, various concrete items are up 5% to 6%, Steel items are down 6% to 7%, Copper and Brass Shapes are up 6% and Diesel is down 13%.
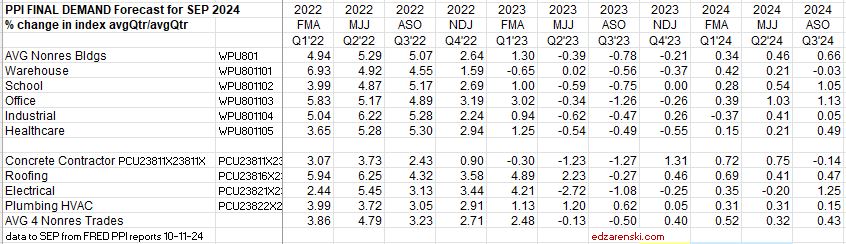
Final Demand indices for 2024 are barely moving. Although Office and School are both up over 1% for Q3, no building type is up even a half percent when compared to the average of 2023. Roofing Trades are up 1.7% YTD. The average YTD for the four trades is up less than 1%. Over the last six months The only Final Demand indices to move more than 2% (for the full 6mo) were Office Bldgs and Electrical Trades.
SEE ALSO Construction Inflation 2024 – updated 7-12


Speaking Engagement – Advancing Preconstruction 2021
Join us August 30 – September 1 in Dallas TX
I will be presenting to the plenary session on Main Conference Day 1, Tuesday August 31 on the following:
The State of Construction Post-Pandemic: Revealing Trends in Demand, Supply & Cost Escalation
• Revealing the economic reality and outlook in terms of construction volume and its impact on jobs and prices
• Identifying key metrics and data sources that will give you a reliable indication of inflation for your market
• Determining the likely impact of an Infrastructure Bill and other major construction investments on market forces
The 6th annual Advancing Preconstruction 2021 conference is North America’s largest gathering of contractors, design firms and clients looking to improve coordination of the design phase. You’ll hear how to align cost, schedule and project specifications to set projects up for success.
From conceptual estimating and winning work to constructability reviews and model-based quantity take-off, you’ll discover the latest technologies and workflows across five educational tracks.
New additions for 2021 include:
- Post-pandemic outlooks with a focus on cost escalation for major markets and bidding strategies
- Deep dives into estimating for specific CSI divisions including earthwork, steel, mechanical and electrical
- Benchmarking ways to conduct design reviews and maintain quality of coordination, including with remote working
- How direct material procurement, prefabrication, IPD and other trends could radically alter preconstruction and reduce costs
- https://advancing-preconstruction.com/
Producer Price Index Year-to-date June & July 2020
7-14-20 updated 8-28-20
Producer Price Index selected items year-to-date through June 2020. All values compare most recent June pricing to December 2019. Pricing represents 6-month change, not annualized change.
- -2.5% Inputs to new nonresidential construction
- -0.9% Inputs to new residential construction
- +1.0% Final demand construction
- -0.4% New Warehouse Bldg
- +1.2% New School Bldg
- +0.7% New Office Bldg
- +1.4% New Industrial Bldg
- +1.4% New Healthcare Bldg
- New work on nonresidential buildings
- +0.7% Concrete contractors
- +1.8% Roofing contractors
- +1.4% Electrical contractors
- +1.2% Plumbing contractors
- Selected Material Inputs
- -42.0% #2 Diesel fuel
- +2.7% Ready Mix Concrete
- +1.3% Precast concrete products
- +1.3% Flat Glass
- +0.1% Gypsum products
- +6.1% Lumber and Plywood
- -5.7% Steel pipe and tube
- -11.5% Aluminum mill shapes
- +2.2% Fabricated structural metal
- +10.3% Fabricated structural metal bar joists and reinforcing bars
- +11.9% Fabricated structural metal for non-industrial buildings
- -3.7% Fabricated structural metal for bridges
- -2.2% Fabricated steel plate
- +1.6% Iron and steel scrap
AGC does not publish year-to-date values. The data in this post is the combined effect of comparing June to March and March to December.
Here’s the link to AGC PPI reports for all months
8-28-20 There were some pretty dramatic changes in July in the Producer Price Index selected items year-to-date. Edited here, all values compare most recent JULY pricing to December 2019. Pricing represents 7-month change, not annualized change.
- -1.0% Inputs to new nonresidential construction ytd through JULY
- +1.0% Inputs to new residential construction ytd through JULY
- +1.6% Final demand construction ytd through JULY
- +1.0% New Warehouse Bldg
- +1.8% New School Bldg
- +1.7% New Office Bldg
- +2.2% New Industrial Bldg
- +2.2% New Healthcare Bldg
- New work on nonresidential buildings ytd through JULY
- +0.5% Concrete contractors
- +2.2% Roofing contractors
- +1.7% Electrical contractors
- +0.7% Plumbing contractors
- Selected Material Inputs ytd through JULY
- -24.0% #2 Diesel fuel
- +2.8% Ready Mix Concrete
- +1.3% Precast concrete products
- +1.2% Flat Glass
- +0.3% Gypsum products
- +13.8% Lumber and Plywood
- -5.5% Steel pipe and tube
- -10.0% Aluminum mill shapes
- -1.0% Fabricated structural metal
- +0.8% Fabricated structural metal bar joists and reinforcing bars
- +0.4% Fabricated structural metal for non-industrial buildings
- +1.4% Fabricated structural metal for bridges
- +2.7% Fabricated steel plate
- -2.8% Iron and steel scrap

PPI Construction Materials Inputs Index
2-20-18 original post
Feb 2019 Tables and Plots updated to end of 2018
Here’s the link to the June 2019 data
Here’s a link to the AGC APRIL 2020 summary report.
Producer Price Index of Materials Inputs to Construction. The 1st two plots are PPI Final Costs which includes all overhead and profit as sold. All other plots are PPI Input costs. Changes in PPI Input costs at the producer level may not reflect changes in actual pricing to contractors or changes in final cost as installed to building owner. Input Costs do not reflect retail markup or mark down and do not reflect overhead and profit markups that may change according to market activity.
PPI for Construction Inputs IS NOT a direct indicator of construction inflation. It does not represent selling price, the final cost of materials put-in-place which includes cost of labor, overhead and profit. See below link to description of Ovhd&Profit.
Cautions When Using PPI Inputs to Construction!
PPI Inputs and Inflation not only can vary widely but also may not even move in the same direction. See the above link for a table comparing PPI% vs Inflation%.


PPI Nonresidential Building Types
PPI Nonresidential Building Construction Sector — Contractors
Specific Building and Contractor PPI Indices are Final Demand or Selling Price indices. They are plotted above.
Bureau of Labor Statistics Producer Price Index measures PPI cost of materials price at producer level. The PPIs that constitute Table 9 of the BLS PPI Report measure changes in net prices for materials and supplies typically sold to the construction sector, but do not represent the final cost installed. They are known as PPI Inputs. They are plotted below.
PPI Materials and Supply INPUTS to Construction Industries
Here’s a brief summary of some of the PPI statistics tracked here:
- One year (2018) change
- biggest increases > Steel Pipe and Tube 21%, Fabricated Steel for Bridges 15%, Ornamental Metals 12%, Fab Structural Steel for Buildings 12%
- biggest declines > Copper and Brass shapes -6%, Lumber and Plywood -4%
- PPI Final cost of buildings and Trades up 4% to 6%
- Final cost of buildings posted largest increases since 2008.
- Final cost of trades (except for Roofing) posted largest increases since 2009.
- Steel Products posted largest increases since 2008
- Lumber and Plywood, which had risen dramatically (+30%) earlier in the year, now down 4% from Dec ’17
- Two year (2017+2018) changes
- biggest increases > Diesel fuel 45%, Steel Pipe &Tube 31%, Aluminum Shapes 16%, Fabricated Structural Metal for Buildings 16%, Ornamental metals 16%
- no declines over a two year period
Most stable pricing over last 5 years, these items did not change by more than 5%/yr in any given year during the last 5 years and net the smallest total change for 5 years: Concrete Brick and Block, Concrete Pipe, Ready-Mix Concrete, Plastic Products, Insulation, Fabricated Steel Plate, Sand/Gravel/Crushed Stone.


The Materials Inputs indices plots above are generated by indexing the December to December percent changes in the table below. Data updated to include Dec 2018 published January 2019.


Each month, @AGCofA @KenSimonson puts out tables and explanation of recent changes in producer price indexes and employment cost indexes for construction materials inputs, and building types and subcontractor final demand cost. Best source available. Watch this AGC page for monthly updates to the PPI
Here’s the link to the June 2019 data
Steel Statistics and Steel Cost Increase Affect on Construction?
9-18-16 update Mar 2018
Recent articles suggest that steel cost is expected to increase and this will almost certainly affect the cost of construction. But just how much of an affect would a cost increase have on total building cost? The cost increase that is being talked about is the mill price cost of steel, or something like pipe and tube producer price (PPI), since pipe and tube is a world trade item, but not a Fab Steel PPI. None of these include total cost of steel installed. The PPI is the price after fabrication. Total cost is the contractor’s bid or selling price installed which includes all markups (or markdowns).
PPI Steel Materials Inputs plot updated 2-10-19 to include 2018 data
The questions we need to answer are:
- How much of a cost increase will we see in the raw product, manufactured raw steel?
- How much steel is used in a building?
- What affect will a raw material cost increase have on the cost of steel installed?
- How much does that change the cost of the building?
It might help to start with a basic understanding of steel manufacturing and use.
Basic Oxygen Steel (BOS) steel making uses between 25 and 35% recycled steel to make new steel. BOS steel usually has less residual elements in it, such as copper, nickel and molybdenum and is therefore more malleable than EAF steel so it is often used to make automotive bodies, food cans, industrial drums or any product with a large degree of cold working. Cold rolled steel is in this category which would include gypsum wall system steel studs and HSS Hollow Structural Sections.
Electric Arc Furnace (EAF) steel making contains more residual elements that cannot be removed through the application of oxygen and lime. It is used to make structural beams, plates, reinforcing bar and other products that require little cold working. EAF steel uses almost 100% recycled steel. Most steel that goes into a building or civil structure is in this category. 2/3rds of all steel manufactured in the US is EAF steel.
Typically quoted benchmark steel pricing that I’ve seen is based on either cold-rolled-coil sheet steel or hot-rolled-coil sheet steel. This is a common product used for the automotive industry or appliance, but not so much for the construction industry (steel studs vs structural steel). EAF Structural steel is nearly 100% dependent on recycled steel so is not as much affected by price changes of iron ore, as is BOS steel.
The United States is the world’s largest steel importer. Of the 30MMT imported, 50%+ of that comes from our top few import suppliers, Canada, Brazil, South Korea and Mexico. Russia supplies 7%-9%. No other country supplies more than 5% of our imports. China supplies less than 2% of our steel imports, The U.S. is responsible for almost 10% of global steel imports, more than double the second largest importer. The U.S. annually imports about $20-$25 billion of steel, $2 billion from Mexico.
The United States consumes approximately 110 million tons of steel each year. More than 40 million tons is used in the construction industry. The next largest industries, automotive and equipment and machinery, together do not use as much steel as construction. The U.S. imports about 30% of the steel it uses.
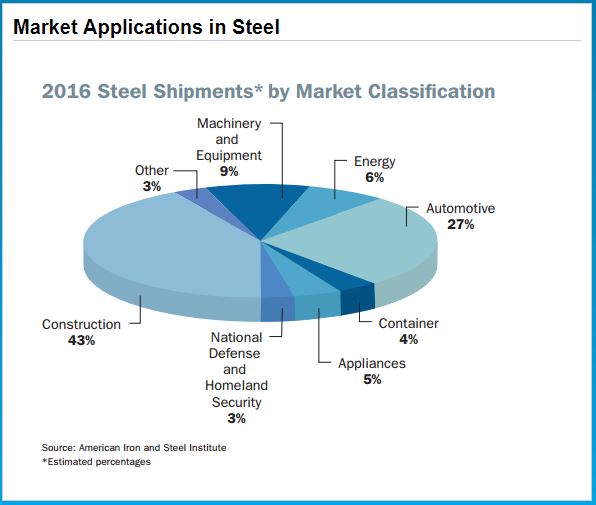
The graphic chart above is by American Iron and Steel Institute.
Structural steel is the most widely used structural framing material for buildings used in the U.S. with nearly 50% market share in nonresidential and multistory residential buildings. Prior to the recession steel had a 60% market share.

Sources are also linked below.
What affect might a steel cost increase have on a building project? It will affect the cost of structural shapes, steel joists, reinforcing steel, metal deck, stairs and rails, metal panels, metal ceilings, wall studs, door frames, canopies, steel duct, steel pipe and conduit. Structural steel and reinforcing steel are hot-rolled long products, EAF steel. All the others are cold-rolled flat sheet BOS steel.
Here are some averages of the percentage of steel material costs as related to total project construction cost. For a building that is predominantly masonry, these percentages would be reduced considerably. For a heavy industrial building the percentages might be higher.
Assuming a typical structural steel building with some metal panel exterior, steel pan stairs, metal deck floors, steel doors and frames and steel studs in walls, then all steel material installed represents about 14% to 16% of total building cost.
Structural Steel only, installed, is about 9% to 10% of total building cost, but applies to only 60% market share of steel buildings. The other 6% of total building cost applies to all buildings.
Other steel is very likely higher to take into account any increased cost in major mechanical equipment such as chillers, pumps, fan powered boxes, cooling towers, tanks, generators, plumbing fixture supports, electrical panel boxes and cable trays.
If the structural steel subcontractor increases bid price by 10%, that raises the cost of the building by 1%, but if it is the mill price of steel that increases by 10% the increase to final building price is far less. It is the mill price of steel, rather than fabricated steel, that you would track in the producer price index (PPI).
The final cost of steel installed in a building is about four times the cost of the raw mill steel material used in making and installing the final product. Why so different? Well, for instance, structural steel cost includes: raw mill steel cost, delivery to shop, drafting, shop fabrication, shop paint, delivery to job site and shop markup. At the job site it includes: unload and sort, field installation crew, welding machine, crane and operator, contractor’s overhead and profit and sales tax.
Assuming a building as described above, a 10% increase in the cost of mill steel, which (material only) affects one fourth the cost of 16% of the total building cost, then a 10% increase in the cost of ALL mill steel may result in a composite price increase on a whole building of about 10% x ¼ x 16% = 0.4%. A 10% increase in the cost of mill steel just for structure may result in a composite price increase on a whole building of about 10% x ¼ x 10% = 0.25%.
So, if the mill cost of steel were to increase 10% from $700/ton to $770/ton prior to shop fabrication, for a $100 million building, that could add roughly 0.25% ($250,000) to the cost of the structural steel contract or roughly 0.4% ($400,000) to the total cost of all steel.
A 25% increase in mill steel could add 0.65% to final cost of building just for structure. It adds 1.0% for all steel in a building.
For a project such as a steel bridge, where not just 16% of cost is steel material, but potentially 40% to 60% of cost is steel, a 25% increase in mill steel might add as much as 3% to 4% to final cost.
links to relevant data
Steel Imports Report Global Steel Trade Monitor
Steel Capacity Utilization and Use American Iron and Steel Institute
Structural Steel Industry Overview AISC
World Steel Production – Consumption – Imports – Exports
Crain’s NY – Impact of steel tariffs already being felt in NYC

Trump’s Wall
5-22-16 updated 1-7-19
Trump’s Wall
Recently I received a call from a major national news source. They asked for help understanding what it would take to build “Trump’s Wall.” I’m an estimator, so I provided some realistic analysis of what it would take.
The border with Mexico is almost 2000 miles long. There is already about 700 miles of fence. This analysis makes an assumption it would be necessary to build only 1000 miles of wall. Also, this estimate is based on the type of wall you see along highways, precast concrete sound and site barrier wall. In reality it would need to be significantly more robust than the typical highway sound-barrier wall, and I’ve taken that into consideration in my estimate. So here goes.
(9-1-16 >>In some other recent articles I’ve read they have suggested a 40 foot high concrete wall. Well, I don’t think you can build a 40 foot high unsupported concrete wall (no bracing at sides) without getting into extremely massive volumes of materials. Such a high concrete wall would need to be much thicker at the base than at the top and the foundation to prevent overturning would need to be massive. Typical rule of thumb for foundation to prevent overturning is the foundation needs to be ~40% as wide as the height of the wall. The volume of concrete would be 4x to 5x what I’ve estimated for the wall I’ve defined here and the excavation, back fill and formwork would add considerable time to complete. Order of Magnitude I guess 40 to 50 million cubic yards of concrete for wall and foundation. I would roughly guess such a massive poured concrete foundation and wall, if it could even be built, would cost THREE TO FOUR TIMES what I’ve estimated here and would require substantially more labor and might take twice as long or more to build.)
This estimate is based on 8″ thick precast heavily reinforced concrete wall panels set between steel columns 12’0 on center. Even if the concrete could be chipped away, the reinforcing bars would prevent passage. Columns are set in 6’0 dia. x 10’0 deep column foundations. Between column foundations under the wall is a continuous footing to help resist overturning of the wall. The wall extends 25 feet above grade and 5 feet below grade. Bottom of concrete footing under the wall is 7’0 feet below grade. Bottom of column foundations is 15’0 below grade. The wall would be much higher than the approximate 12′ shown in the representative photo.

The foundations included here are based on up-sizing components from a known design for a 15′ high prison un-climbable open-mesh fence. Even with an open mesh fence design, to overcome wind load, column footings were 2″0″ dia x 8’0″ deep concrete post foundations set every 8′ apart. This solid wall 25′ high would have enormously greater wind loads and it is the foundation that must be designed to prevent overturning.
Just to get quickly to the end, I calculated the final cost of a 25′ high precast wall, foundations, excavation and access roads in the vicinity of $25 billion (in 2016 $), $10 million per mile or slightly less than $2,000 per lineal foot of wall. I’m fairly certain this estimate is somewhat low and the actual cost due to the many unknowns would be higher. At the end I’ve pointed out some of the issues that could generate unknown costs.
One huge factor is inflation. Historical average construction inflation is greater than 4%/year. If a $25 billion wall takes 10+ years to build, the total cost over time assuming the historical average construction inflation would be $30 billion.
This is a summary of some of the results from the concrete wall estimate.
Materials
200 million square feet of precast concrete panels = 5.2 million cubic yards of concrete
5 million cubic yards of cast-in-place concrete foundations
Total cement to make the 10.2 million cubic yards of concrete = 2% of annual US cement production.
1.5 million tons of steel = 1.5% of annual US steel production.
25 million cubic yards of excavation required.
6 million cubic yards of that excavated earth must be hauled away and disposed since that volume will be replaced underground with concrete. That’s more than enough to completely fill the Superdome. Or, it’s enough to build a 20 foot wide earthen embankment 20 feet high and 100 miles long.
Delivering the Materials
250,000 truckloads of precast wall panels,
500,000 truckloads of ready mix concrete
50,000 truckloads of steel
200,000 truckloads to haul away excess excavated earth.
This is far from a complete list of materials, because in addition to building the wall, in some places you first need to build a road. Assume about 500 miles of road. You can’t get 1,000,000 truckloads of 30-40 tons each, cranes, excavators and auger drills to a construction site without at least building a compacted gravel road to get there.
Adds 2 million cubic yards of stone for construction equipment road.
Adds 100,000 truckloads of stone
Labor
It takes 5000 to 6000 workers to build $1 billion worth of construction in 1 year.
$25 billion x avg 5500 = 135,000 man-years, or 135,000 workers if it is to be built in 1 year. Or it would take 10,000 full-time workers 13.5 years to build this concrete wall.
If 1,000 men worked on the wall 5 days a week 8 hours a day, it would take 135 years to build it. Therefore, I made the assumption the project would be broken into 50 segments each 20 miles long and looked at two scenarios. What labor would be required to build it in 10 years or 4 years?
4 years: That will require 700 men AT EACH of 50 SEGMENTS concurrently to complete the wall in 4 years. That’s 35,000 men working for 4 years. That is 35,000 trades-worker jobs which does not include Architect, Engineering, Testing and General Contractors management personnel.
1,100,000 truckloads at 50 locations over 4 years is = 20 deliveries per day of 30 to 40 tons each at each of the 50 locations. That works out to 40 truck bypasses per day coming and going, so 30 ton trucks go by (some community) every 12 minutes at every one of 50 locations every workday for 4 years. It is very likely that heavy truck traffic will destroy many if not all the town roads used to access the 50 construction sites. The cost to repair/replace those existing roads is NOT included here, but I suspect it would be in the hundreds of millions.
The 4 year scenario is quite unlikely from just about every standpoint. Labor availability, engineering studies and site preparation of 50 (or more) job sites, mobilization of 35,000 men to 50 job sites, product supply, frequency of deliveries, overcrowding of job site. In reality, 700 men at a job site is probably far more than can be managed. In this scenario the number of job sites would need to be increased, probably to more like 150 to 200 individual job sites. While all aspects seem to limit this choice as viable, it is probably labor and material availability that would have the greatest impact.
10 years: To build the wall in 10 years would require 13,500 workers, or about 250 workers AT EACH of 50 SEGMENTS concurrently to complete the wall in 10 years. That’s 13,500 workers working for 10 years. That is 13,500 trades-worker jobs including General Contractors management personnel but not including Architect, Engineering, Testing, Manufacturing and Delivery.
1,100,000 truckloads at 50 locations over 10 years is = 8 deliveries per day of 30 to 40 tons each at each of the 50 locations. That works out to 16 truck bypasses per day coming and going, so 30 ton trucks go by (some community) every 30 minutes at every one of 50 locations every workday for 10 years. The same heavy truck traffic will destroy many if not all the town roads used to access the 50 construction sites, it just takes longer. The cost to repair/replace those existing roads is NOT included here.
The 10 year scenario is certainly not impossible. Labor availability and mobilization issues are reduced as are product supply and frequency of deliveries.
NOTE 1-7-19 New review of proposed steel barrier changes some materials and has a moderate overall affect on total cost, manpower and time to complete. In question is size of steel section that could withstand installation 25′ to 30′ tall unsupported. For a steel barrier estimate I used tube steel hollow structural sections (HSS) 8x8x3/8 set with 6″ spaces between. The summary from the estimate revises precast panels to 3 million tons of steel. The remainder of the summary is still valid. It changes a little. Total cost came in near $24 billion versus the original estimate for precast concrete wall at $25 billion. However if design would require a heavier section 8x8x1/2 then cost jumps to $29 billion. If design requires concrete filled tubes cost would go up by about $750 million. If 8×8 tubes are rotated 45 degrees, spacing can be reduced and open spaces between tubes can be reduced, steel cost would go down by about $1 billion. Foundation cost may or may not be reduced (by as much as $2 billion), but foundation design to prevent wall overturning is more dependent on wind load than on the weight of the steel above. In any case foundations are massive and still calculate out to about 5-6 million cubic yards of concrete and proximity of concrete batch plants to construction zones could be a major issue. Keep in mind none of this cost includes land acquisition, inflation, housing workers, change orders or building new plants to support job sites with materials.
Best case scenario, at the low end of cost at $22 billion, it would take 10,000 men 11 years to build 1000 miles of steel fence barrier. It is likely that the low end estimate is much to optimistic, citing some issues outlined below.

A word about HSS steel tubes. US annual production for Hollow Structural Sections in 2016 was 1.6 million tons per year. That annual demand does not go away if 3 million tons of tube steel is needed for a wall. Over a period of 10 years, at 0.3 million tons/year, steel needed for a wall would be 20%/year of tube steel production. To prevent shortages, production capacity must increase or that extra tube steel must be imported. The US imports about half of all the steel pipe and tube is uses in a year from South Korea, but most of that is oil industry pipe. Manufacturing mills typically cannot increase capacity by 20% in a year. So, this extra demand for tube steel would either cause shortages or increase imports.
Energy cost just to produce 3 mil tons of steel is enough to power 500,000 homes for 1 year. Energy to produce both steel and concrete probably more than doubles that number.
The money spent is enough to build 70,000 new homes or 500 new high schools.
Gasoline just for all truck deliveries is near 5 million gallons.
The concrete and steel materials gross to 2% of annual US cement production and 1.5% of annual US steel production (for a precast wall), but that represents close to 3% of steel used in construction. (The revised steel barrier reduces precast but increases the steel to 4% of US steel production. It represents 200% of annual tube steel production). About half of all US steel goes into your refrigerators, cars, etc., the other half goes into construction. The materials demand has far more affect than you might think on disrupting normal construction flow. Since it is all localized in one area of the country, the far southwest border, it could potentially represent 20% and 30% of the construction materials capacity in that area of the country, straining the capacity in that area and disrupting the normal volume of construction there for years. This would be detrimental to the rest of the construction industry growth in that area for that period.
This does not address the fact that manufacturing facilities to produce and fabricate the steel and deliver concrete needed at each of the 50 work sites ideally should be spread along this 1000-mile corridor, which is very unlikely. In fact, I suspect it more likely that some locations will not be in close proximity to a materials source, the result either driving cost up or extending duration beyond 4 years, or both. It could require building process plants along the path, for instance, ready-mix concrete batch plants and steel fabrication yards.
The time necessary for land acquisition, design, permitting, environmental study, mass material procurement, construction process planning and mobilization would be many months before construction begins. Although labor availability and the number of sites determines construction duration, 4 years would be a reasonable estimate for construction ONLY IF the 35,000 trades-workers needed can be mobilized simultaneously to 50 job sites, but that is not likely. The 4 years of construction starts when planning, design and permitting are complete. That might take 6 to 12 months.
Construction is experiencing what may be the tightest labor market in over 20 years. Since there are few if any available workers to shift to these new job site locations, we would need to assume much of this work is supported by creating nearly 35,000 new jobs. I looked at the Bureau of Labor Statistics Jobs for metropolitan areas within 100 miles of the border. Several serious problems arise.
In this localized area of the country, along a 1000 mile long 100 mile wide strip, 35,000 construction jobs could potentially be 12% to 15% and possibly as much as 20% expansion of the construction workforce. The maximum 30 yr historical rate of annual construction workforce expansion is 6% nationwide. Normal annual jobs growth is 3% to 4%/year. If one project were absorbing all of the jobs growth in an entire region, there would be no workers available in that region for any other construction activity growth for several years. That’s a major disruption to the local economies of several states.
Such an expansion would be extremely difficult to implement that quickly. The mobilization of 35,000 workers could take a very long time from initial ramping up to full employment, therefore extending the duration to complete the job. Many of these workers could be inexperienced adding further to the project duration. So reaching completion of this work with 35,000 workers would probably take much longer than 4 years. Adding time for planning and more time for ramping up labor, it could be 6 years.
Ramping up then down will soften the blow as the jobs begin to disappear at project completion. It could be pretty hard to generate enough new volume of work to keep all those men working. It will take new volume of $5 billion to $6 billion a year to keep all these workers working.
There’s a great deal to consider about the demand on the workforce to build a border wall, or fence. Let’s look just at Texas. In Texas, there are a total of 775,000 construction workers, the 2nd largest construction workforce in the country next to California. But checking all the major metropolitan statistical areas within 200 miles of the border there are only about 100,000 construction workers. Only about 20% of those workers conduct business in earthwork, concrete and steel, the trades required to build this fence. That’s only 20,000 workers available within 200 miles of the border.
Furthermore, the Texas/Mexico border is 1,250 miles long. If 20,000 workers were spread out evenly along the border (which is most certainly not the case), within any 200 mile stretch and within 200 miles inland, there would be only 3,200 available workers. In some well-populated areas there might be double that, approximately 6,000 workers, but in the less populated areas, there are far less than 3,000 workers within 200 miles of a proposed work zone.
Now let’s assume we need enough workers to build 100 miles of steel fence, somewhere within a 200-mile length and near a well populated area. That’s $2.5 billion of fence. We know that it takes about 5,000 workers a year (5,000 worker-years) to put-in-place $1 billion of construction. So, we need to fill 12,500 worker-years or job-years. That could be 12,500 jobs for 1 year or 1,000 jobs for 12.5 years. How many jobs get filled determines how long it will take to build 100 miles of fence. Well, there are nowhere near enough workers to fill 12,500 jobs to build 100 miles of fence in one year along many sections of the border. In the best case, most of 6,000 workers need to be accommodated with living quarters somewhere along a 200-mile stretch and 12,500 work/years divided by 6,000 available workers means it would take a little over 2 years to build 100 miles of fence.
So, 100 miles of fence would take over 2 years to build, ONLY IF this project could absorb every single available worker in these trades within 200 miles for a period of two years. At the same time, for that 2-year period, there would be no available workers in sitework, concrete and steel trades anywhere else within 200 miles to fill all other normal workload. In less populated areas with only half as many workers available, it would take twice as long, or more.
This brief analysis of cost and constructability does not begin to address issues such as, how would a wall be built anywhere along the 1,000 miles of the Rio Grande river, the border between Texas and Mexico, the 4th largest river in the United States. Assuming such a wall must be built on US soil, a wall would then completely cut off river access from the United States? Or, how would a wall be built through the hundreds of miles of national parks and national wildlife refuges along the border without disrupting natural wildlife migration flow? And, how would it be designed along its 1,000 mile corridor to accommodate drainage across a solid impervious barrier? It seems impractical or at the very least massively environmentally disruptive.
You can see, the logistics would be enormous, impediments loom, adjacent communities would be adversely impacted, the cost is probably far more than the $25 billion estimated and it seems highly unlikely this could ever be completed during the course of a single president’s term.
Construction Expectations 2016
4-6-16
What should we expect in 2016 for construction spending, jobs and cost?
Nonresidential buildings starts (as reported by Dodge Data & Analytics) were well above average from March 2014 through May 2015 but since then have been below average. It takes about 24 to 30 months for nonresidential building starts to reach completion. The effect of below average starts will kick in at the end of this year after strong spending growth.
Non-building infrastructure starts jumped 50% above average from November 2014 to peak in February 2015, then settled back to average in July of 2015. Those very strong starts in early 2015 will be spread out over 4 to 6 years so will not cause spending to spike. They will help support a slow steady increase in spending over the next two years.
Residential starts averaged near 20%/yr growth for 3 years but dropped below average for the entire 2nd half of 2015. That late 2015 dip in starts may not slow residential spending too much until the end of 2016. Overall, the data shows another repeat year of growth similar to the last three years.

2015 Construction spending finished the year up 10.6% over 2014. After 3 years of growth averaging 9%/year, 2016 total construction spending could climb 11% above 2015, the largest percent gain in over 10 years. Any construction spending slowdown is temporary, baked in from old uneven starts causing uneven cashflow, soon to be ending. By the 2nd quarter 2017 all sectors return to positive growth for strong spending in 2017.
Nonresidential buildings construction spending went from zero growth in 2013 to 9% in 2014 and took off to hit 17% growth in 2015. Nonres bldgs spending could reach 12% growth in 2016 and 7% in 2017.
Infrastructure spending will increase a little in 2016 but we won’t see a sizable increase of 8% until 2017.
Residential spending averaged over 15%/year for the last 3 years and could go over 15% growth in 2016, combining for the best four years of spending growth since 2002-2005.
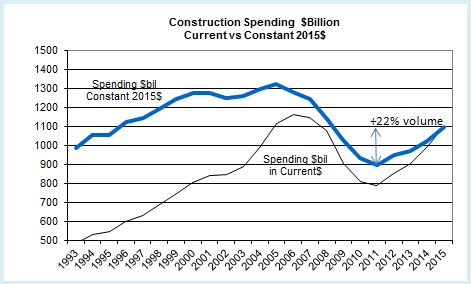
Don’t be mislead by news that construction spending is close to reaching the previous highs. That may be true of spending, but spending is not the measure of expansion in the construction industry. The measure of expansion is volume, spending minus inflation.
Construction spending is up nearly 40% off the 2011 lows and within 5% of the 2006 highs. But after adjusting for inflation, volume is up only 22% from the 2011 lows and is still 17% below 2005 peak volume. We still have a long way to go. While spending is predicted to reach over 11% growth in 2016 and may do the same in 2017, volume will increase only 5% to 6% each year. The rest is due to inflation.
March 2016 construction jobs increase 37,000 from February and although up and down, have averaged 37,000 jobs per month for the last 6 months. That is the highest 6 month average growth rate in 10 years. That certainly doesn’t make it seem like there is a labor shortage. However, it is important to note, the jobs opening rate (JOLTS) is the highest it’s been in many years and that is a signal of difficulty in filling open positions.
To support the expected 2016 volume growth we need an average 25,000 new jobs per month in 2016, 300,000 new jobs, reaching a three-year gain of nearly 1 million jobs for the period 2014-2016, the highest three-year total jobs growth since 1997-1999. The labor force hasn’t expanded this fast in over 16 years. That can have some undesirable consequences. Rapid jobs growth may result in accelerating wages and lost productivity, compounding the cost to labor.
4-6-16
If we get a construction jobs slowdown in the next few months, it’s not all due to labor shortages and not being able to find people. Construction volume has been growing faster than jobs for more than a year. It means productivity in 2015 is up after several down years. But, while we’ve recorded consecutive years of productivity declines many times, we have not had two consecutive years of productivity gains in the last 22 years. So historically we should expect a decline, not gains this year.
Material input costs to construction are down over the last year, but that accounts for only a portion of the final cost of constructed buildings. The cost of new residential construction is up 5% to 6% in the last year. Several nonresidential building cost indexes are indicating construction inflation between 4% and 5%. The Turner non-residential bldg cost index for 2015 is 4.6%. The 1st qtr 2016 is up 1.15% from the 4th quarter 2015. The Rider Levitt Bucknall nonresidential building 2015 cost index is 4.8% and the Beck Cost Report has 5.0% for 2015. I recommend an average 5.5% cost inflation in 2016 for residential and nonresidential buildings. Non-building infrastructure costs are unique to each individual infrastructure market, so average building cost indices should not be used for infrastructure.

