4-6-16
What should we expect in 2016 for construction spending, jobs and cost?
Nonresidential buildings starts (as reported by Dodge Data & Analytics) were well above average from March 2014 through May 2015 but since then have been below average. It takes about 24 to 30 months for nonresidential building starts to reach completion. The effect of below average starts will kick in at the end of this year after strong spending growth.
Non-building infrastructure starts jumped 50% above average from November 2014 to peak in February 2015, then settled back to average in July of 2015. Those very strong starts in early 2015 will be spread out over 4 to 6 years so will not cause spending to spike. They will help support a slow steady increase in spending over the next two years.
Residential starts averaged near 20%/yr growth for 3 years but dropped below average for the entire 2nd half of 2015. That late 2015 dip in starts may not slow residential spending too much until the end of 2016. Overall, the data shows another repeat year of growth similar to the last three years.

2015 Construction spending finished the year up 10.6% over 2014. After 3 years of growth averaging 9%/year, 2016 total construction spending could climb 11% above 2015, the largest percent gain in over 10 years. Any construction spending slowdown is temporary, baked in from old uneven starts causing uneven cashflow, soon to be ending. By the 2nd quarter 2017 all sectors return to positive growth for strong spending in 2017.
Nonresidential buildings construction spending went from zero growth in 2013 to 9% in 2014 and took off to hit 17% growth in 2015. Nonres bldgs spending could reach 12% growth in 2016 and 7% in 2017.
Infrastructure spending will increase a little in 2016 but we won’t see a sizable increase of 8% until 2017.
Residential spending averaged over 15%/year for the last 3 years and could go over 15% growth in 2016, combining for the best four years of spending growth since 2002-2005.
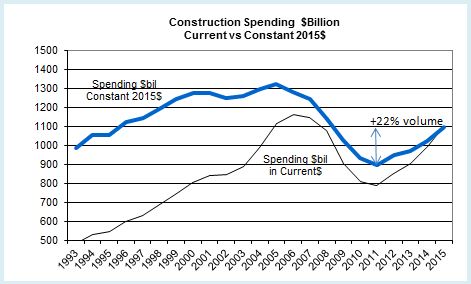
Don’t be mislead by news that construction spending is close to reaching the previous highs. That may be true of spending, but spending is not the measure of expansion in the construction industry. The measure of expansion is volume, spending minus inflation.
Construction spending is up nearly 40% off the 2011 lows and within 5% of the 2006 highs. But after adjusting for inflation, volume is up only 22% from the 2011 lows and is still 17% below 2005 peak volume. We still have a long way to go. While spending is predicted to reach over 11% growth in 2016 and may do the same in 2017, volume will increase only 5% to 6% each year. The rest is due to inflation.
March 2016 construction jobs increase 37,000 from February and although up and down, have averaged 37,000 jobs per month for the last 6 months. That is the highest 6 month average growth rate in 10 years. That certainly doesn’t make it seem like there is a labor shortage. However, it is important to note, the jobs opening rate (JOLTS) is the highest it’s been in many years and that is a signal of difficulty in filling open positions.
To support the expected 2016 volume growth we need an average 25,000 new jobs per month in 2016, 300,000 new jobs, reaching a three-year gain of nearly 1 million jobs for the period 2014-2016, the highest three-year total jobs growth since 1997-1999. The labor force hasn’t expanded this fast in over 16 years. That can have some undesirable consequences. Rapid jobs growth may result in accelerating wages and lost productivity, compounding the cost to labor.
4-6-16
If we get a construction jobs slowdown in the next few months, it’s not all due to labor shortages and not being able to find people. Construction volume has been growing faster than jobs for more than a year. It means productivity in 2015 is up after several down years. But, while we’ve recorded consecutive years of productivity declines many times, we have not had two consecutive years of productivity gains in the last 22 years. So historically we should expect a decline, not gains this year.
Material input costs to construction are down over the last year, but that accounts for only a portion of the final cost of constructed buildings. The cost of new residential construction is up 5% to 6% in the last year. Several nonresidential building cost indexes are indicating construction inflation between 4% and 5%. The Turner non-residential bldg cost index for 2015 is 4.6%. The 1st qtr 2016 is up 1.15% from the 4th quarter 2015. The Rider Levitt Bucknall nonresidential building 2015 cost index is 4.8% and the Beck Cost Report has 5.0% for 2015. I recommend an average 5.5% cost inflation in 2016 for residential and nonresidential buildings. Non-building infrastructure costs are unique to each individual infrastructure market, so average building cost indices should not be used for infrastructure.

