Housing starts can be erratic. It’s not unusual to see monthly housing starts fluctuate up or down by 10%, sometimes 20%. But what affect does this have on the flow of housing work? Not as much as you might think.
Although housing starts is in units, not dollars, we can create a “cash flow” to see how the new starts generate activity over future months. To see the flow of work I’ve created a simple time flow of starts to show the activity generated for new housing starts.
About 2/3rds of housing starts are single family units. These might have a construction duration ranging from 6 to 9 months. The remaining 1/3rd of starts are multifamily units. Those could have construction duration of anywhere from 8 months to 16 months and in some cases longer. For this simple analysis I’ve used a work flow duration of 2/3rds at 7 months and 1/3rd at 17 months. Varying the duration longer or shorter by a few months will not have a big effect on the outcome. It changes the slope of the growth rate but does not change the consistency of the growth pattern.
A time flow of housing starts shows growth rates of; 2013 +13%; 2014 +10%; 2015+12%. Actual construction spending shows growth of 2013 +19%; 2014 +14%; 2015+13%.

The chart above, “Housing Starts Monthly and Trend” shows the actual monthly starts values and a three month moving average. Monthly starts periodically peak and dip erratically. Look at February 2015, the biggest dip in 5 years. The 1st quarter 2015 was down 7% qtr/qtr. But then notice it took less than 4 months for starts to come right back to the trend line and the trend remained intact. 2015 finished up 11%. This is how the monthly housing starts (# of units) data goes.
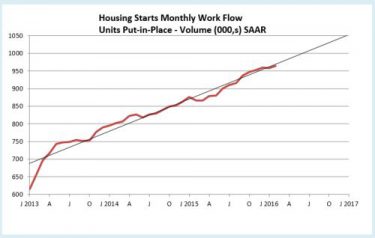
The “Work Flow” chart plots the actual work load out over time from the month the work started to completion. The total work flow in any given month is the sum of the work contributed from starts in previous months that have yet to be completed. Residential work flow has averaged +12% for the last 3 years. In 2015, growth was 14%. The very steep climb in early 2013 activity reflects work generated from the 28% rise in new starts in 2012, the largest % increase in new starts in 30 years.
Starts in any given month have only a small % impact on the slope of change in every succeeding month until completion. This is the same concept as cash flow. Construction spending in any given month is the sum of all the ongoing projects from all previous months.
This next plot shows the same workflow, only Not Seasonally Adjusted, so it shows the winter dips in activity and the steeper rate of growth during the more productive months. Although the average slope of growth is similar to the SAAR plot, this shows the real total work activity in any given month varies from that shown by the SAAR plot. However, it is not erratic like the starts plot, it is smooth and repetitive year after year.

It would take a dramatic change in housing starts to significantly alter the progress of work flow and it would need to be a sustained change in starts. If a 20% decline is offset by an corresponding increase in the following month or months, then the future months of work flow will show little affect from the decline.
