Home » Posts tagged 'productivity'
Tag Archives: productivity
Construction Briefs Jan 2026 Data Update 2-2-26
We are still not where we should be with actual data due to government data delays caused by the shutdown. Recent releases bring BLS jobs data up to Dec, PPI data through Nov and Construction Spending data through October. Here’s a collection of tables and plots reflecting some of that data through the end of January.
Construction Spending Value Put in Place
The November 2025 release, originally scheduled for January 2, 2026, and the December 2025 release, originally scheduled for February 2, 2026, for the Monthly Construction Spending report have been rescheduled for release on February 27, 2026.
There’s is an unusually large decline in residential construction spending in Sept data, almost entirely attributed to renovation work. A closer look at the data shows it may be that Aug and Oct reno data seem out-of-sync and those may be overstated. All 2025 data still open to Jul 1 revision.
25 data center projects were canceled in 2025 amidst surging local opposition — 4X as many as in 2024.
( Personal opinion – Data Center growth will be restricted by difficulty to ramp up power generation and transmission. This in turn will slow construction spending growth in this market).
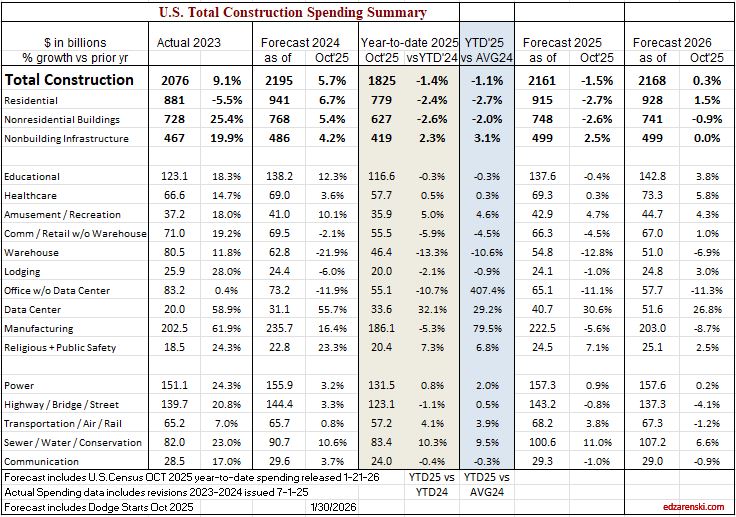
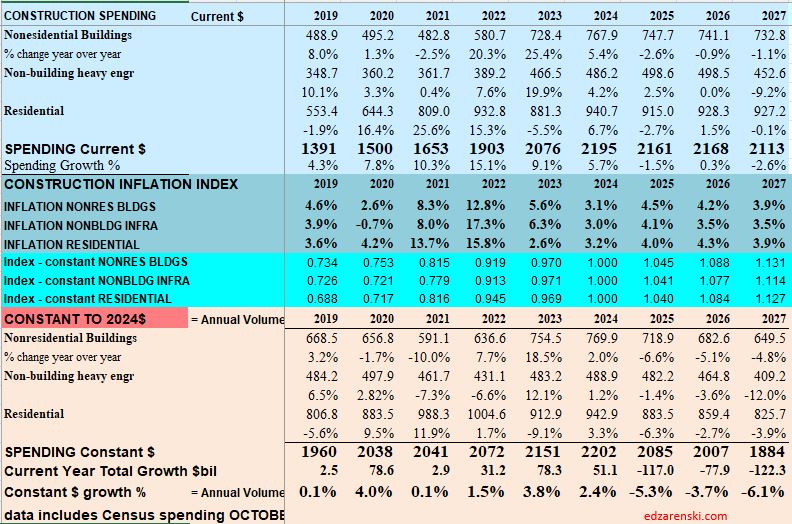
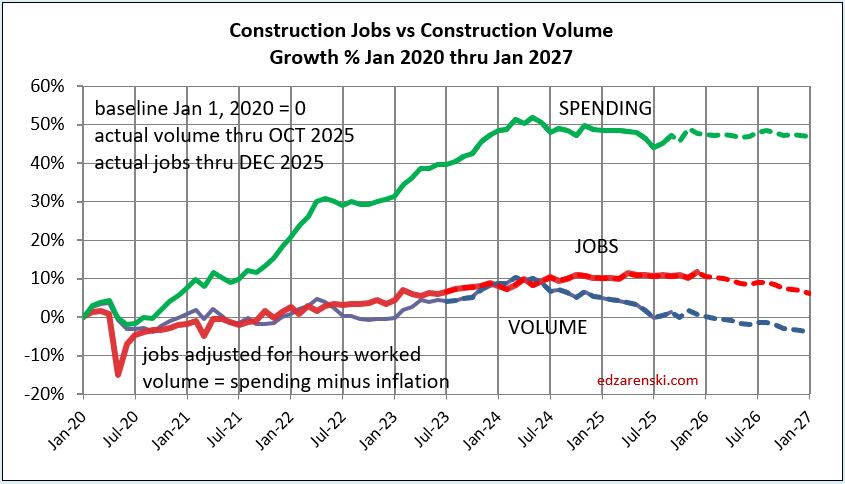
Construction Jobs increased 1.1% in 2025. Spending (actual thru Oct) fell 1.5% in 2025. But inflation ate up 4% of spending. So real volume of construction activity fell 5.3%. Therefore, productivity fell 6.4%.
Also, if your construction business revenue increased less than 5.3% in 2025, your real business growth fell in 2025.
Jobs 2025 Nonres Bldgs +1.6%, Nonbldg +2.4%, Residential -0.6%
Construction Spending – Volume – Jobs
Construction Jobs avg 2025 increased only 88k from avg 2024. Slowest jobs growth since 2011 (ex 2020). Jobs 2025 up 1.1% over 2024. Jobs have been flat (or +/- slight) since Feb.
Residential jobs down 0.6%, but rsdn spending ytd thru Aug down 3.7% from Q4’24. After adjusting for inflation rsdn volume ytd is down 6%. Nonres Bldgs jobs up 1.6%. Nonres Bldgs volume down 3%. Nonbldg jobs up 2.4%. Nonbldg volume up 1.5%.
Environment for construction jobs looking difficult. Volume of work (spending minus inflation) available is declining all through 2026. Biggest declines by far, Manufacturing and SF Rsdn.
In the 10 months period Jan-Oct’25, construction volume declined by 4%. In the same period, construction jobs increased by 0.5%. And yet some economists are saying that job openings and hires indicate a labor shortage. Jobs should follow the amount of business volume.
Don’t expect construction to add jobs in 2026. While spending may be near flat, inflation data for 2026 has volume projected to fall 3.7%.
Construction Productivity
Construction spending constant $$ (volume) for 2025 is down 5.3% compared to start 2025 or same month 2024. I’m forecasting a decline of 3.7% in 2026. A 3.7% drop in volume could be a loss of 300,000 Jobs. Companies usually don’t cut # of jobs indicated by falling business volume. More jobs remain than volume. Productivity ($ pip per job) declines.
In 2026 real construction volume after inflation is expected down -3.7%. If we keep all current jobs, then volume put-in-place per job is lower, a decline in productivity of 3.7%. If we want to maintain the current level of productivity, we would need to lose 3.7% (300k) jobs. Unless the volume of work increases, I’d expect productivity to fall in 2026.
Volume of work is spending minus inflation. When jobs growth exceeds volume growth, productivity is declining. Volume has been declining for last 2 years and is expected to continue declining in 2026.
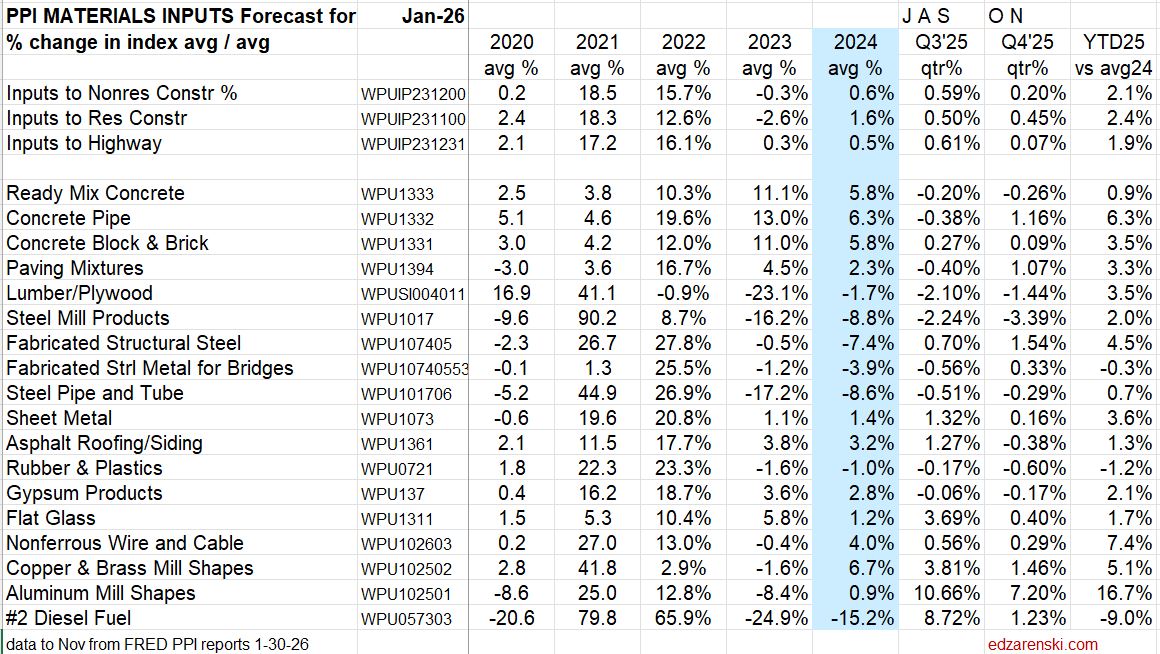
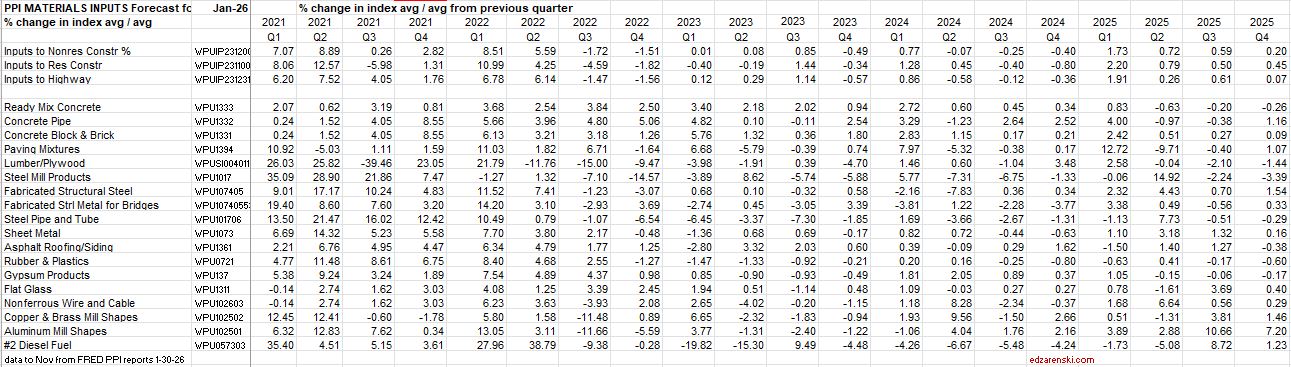
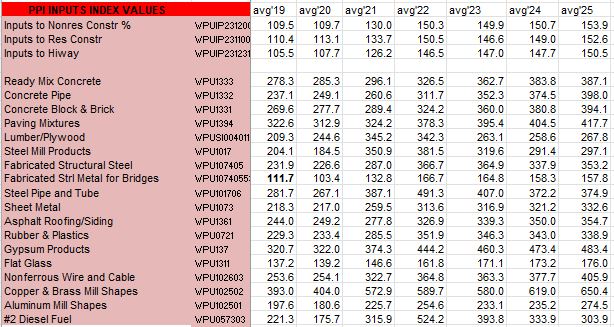
Inflation Index and Producer Price Index
If you track company revenues as business growth, without adjusting your business plan for inflation, you’re tracking register receipts, not business volume. Here’s a simple example to understand the difference in revenues (spending) vs volume. If a basket of apples 2yrs ago cost $25, but today the same basket cost $35, receipts increased 40%, but business volume has not changed.


Construction Briefs Aug 2025
The biggest story in construction data right now is jobs.
Average construction jobs growth through July, last 25 years, excluding recessions, +130,000.
Average construction jobs growth through July, last 10 years, excluding recessions, +140,000.
2025 Construction Jobs growth through July, +21,000.
Not so surprising, as the Constant $ construction spending through July is down -5.7%, (compared to same months previous year), steepest decline since 2011, which was the end of the great recession. Constant $ (inflation adjusted) construction spending is now back to early 2022 level.
Construction Spending is down 5 of the last 6mo, now down a total -3.0% from Dec. Over that period spending is down most significantly in Residential, Manufacturing and Commercial w/o Warehouse. It’s up the most in Data Centers, Highway and Public Utilities. Overall, business is declining.


Construction Spending inflation adjusted is forecast to drop slightly every month for the rest of the year. Expect constant $ spending at year end down -6.3% from 2024. Uncertainty over tariffs and funding subsidies has slowed decision making on planning and moving new projects forward to construction. This is not an environment to expect jobs growth.
If jobs were to move at the same rate as business volume, with 2025 construction spending in constant$ expected to fall -6.3%, then jobs would be expected to fall -6.3%. That’s 500,000 jobs. The only times we’ve ever lost 500,000 jobs in a year was in both 2009 and 2010. In those years, after falling 17% in the previous 3 years, business volume dropped another 12% and 10% respectively.

Residential construction jobs peaked last September and are now down 1% or 35,000 jobs since then. In Constant $, residential spending is down 10% since last September. Jobs never move at the same rate as spending. This has a significant impact on productivity.
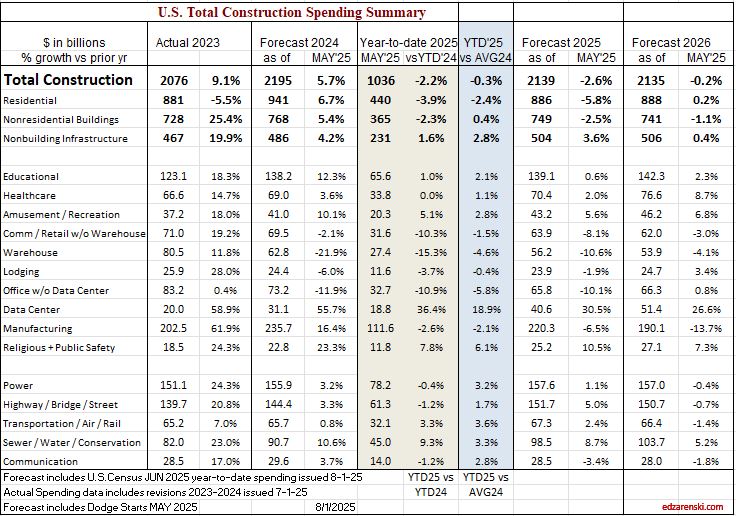
Data Centers are the bright spot in construction spending, up 17% since December and forecast to finish the year up 30%, an increase of +$10bil.

Biggest forecast declines in Current$ construction spending: Residential -5.8% (by far largest $ decline, -$55bil); Manufacturing – 6.5%, -$15bil; Warehouse -10%, -$7bil; Office (ex Data Centers) -10%, -$7bil; Comm Retail (ex Warehouse) -8%, -$6bil.
Manufacturing spending is now receding from an astronomical high. From 2019 through 2021 spending was averaging $80bil/yr. In 2024 it reached an average of $235bil, and peaked in Oct at $244bil. In June it was only $223bil and it’s expected forecast for 2025 is down -6.5% from 2024, but that is still a very high $220bil.

Construction Briefs June 2025
Construction Spending Explained
- New Starts + Existing Backlog generate Spending
- Spending = Revenue
- Revenue includes inflation which adds nothing to volume
- Revenue – Inflation = Business Volume
Construction spending fell slightly in April, down 0.4% from March. Spending has fallen slightly each of the last 3 months, but total spending is still at/near an all-time high with the seasonal rate at $2,200 billion. The forecast predicts spending will increase to 3% growth by year end.
Construction Forecast Update – Data Centers shows the largest % growth for 2025, forecast +33%. Manufacturing is still the largest $ contributor ($223bil/yr) to nonresidential bldgs total spending ($772bil/yr), but has fallen 6% in the last 5 months.
Peak manufacturing construction spending was posted from Sep thru Dec 2024. The avg of 1st 4mo of 2025 is down 4% from that peak. By Q4’25, avg spending will be down 10% from peak.
BTW, this is totally normal. We are beginning the tail end of an above normal huge influx of new manufacturing projects that started over the last 3 years, and the spending curve is beginning the downhill slope. Spending will continue to fall for the next 3yrs.
Data Center construction spending has not yet hit peak. Data Centers are continuing on a phenomenal streak of +45% growth in 2023 and +56% in 2024 and now 33% in 2025. The avg of 1st 4mo of 2025 is up 39% from same 4mo 2024. Spending will finish the year almost 20% higher than today. 2025 forecast +33% over 2024. Currently projecting peak spending end of 2027, or later.
Headwinds could slow new starts growth. Many economists predict current trade impacts will slow overall economic growth. That in turn could slow capital expenditures, which, in this case, is new construction starts.
Any capex pause could reduce all Data Center numbers. However, starts are up 400% since 2020 and could finish 2025 up 500%. Would take a lot of canceling or delaying to collapse these numbers. (This is going to first appear in construction starts, “firms pausing or delaying capex.” It’s already started with Data Center).
What’s propping up construction spending growth? Here’s the top growth markets.
- Market——1yr/%/$ growth ——3yr growth
- Educational 1yr/+8%/+$10bil +3yr/+30%/+$30bil
- Data Centers +56%/+$10bil +286%/+$18bil
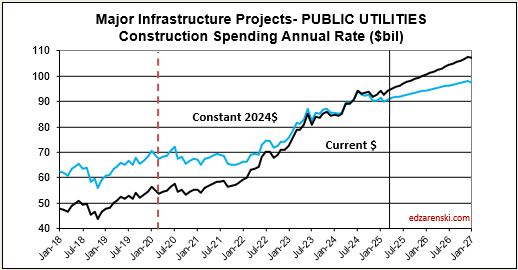
- Public Utilities +11%/+$9bil +58%/+$38bil
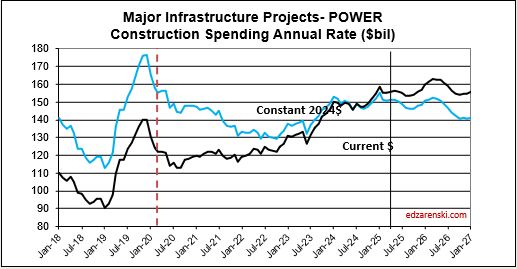
- Power +10%/+$14bil +24%/+$29bil
- Highway +4%/+$6bil +40%/+$40bil
Data Centers far and away takes the prize for highest % growth, but Data Centers is only 1.7% of all construction spending. Power is 7%, Highway is 6.6%, Educ is 6.3%, Pub Util is 4.4%
Manufacturing is notably absent from the above list, because after 3 outstanding years, Mnfg is no longer contributing growth. Mnfg spending is beginning to taper off. Mnfg is 9.3% of construction spending. The only market over the last year, or 2 or 3 years, with more $ spending than Manufacturing is Residential.
Mnfg 1yr/+20%/+$39bil 3yr/+284%/+$150bil
Mnfg 2025 forecast -10%/-$24bil


What’s holding spending growth back?


6-17-25 When May construction starts are reported later this month, I’m expecting an overall decline and a lower forecast. There are already reports of pauses in manufacturing facilities and data centers. Hiway and Public Utilities are probably immune from cuts but Power may see some reductions. Education and Healthcare are questions. Residential construction expected down slightly. Housing permits continued a downhill trend in April for the fourth month in a row. KB and Lennar report market pricing is down slightly. # of homes on the market is increasing.
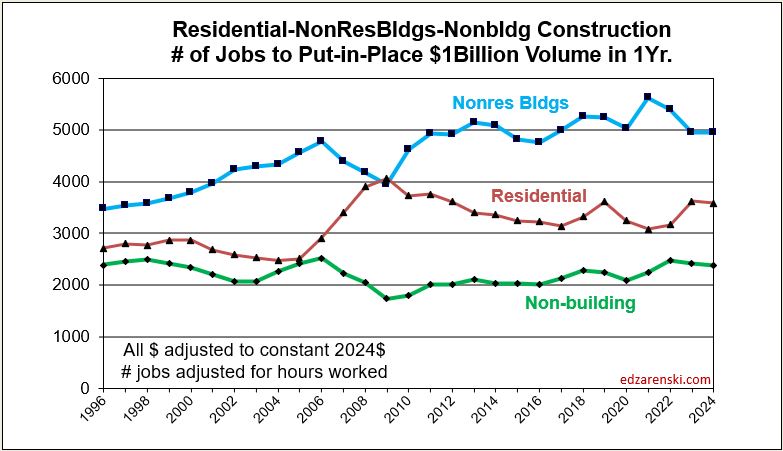
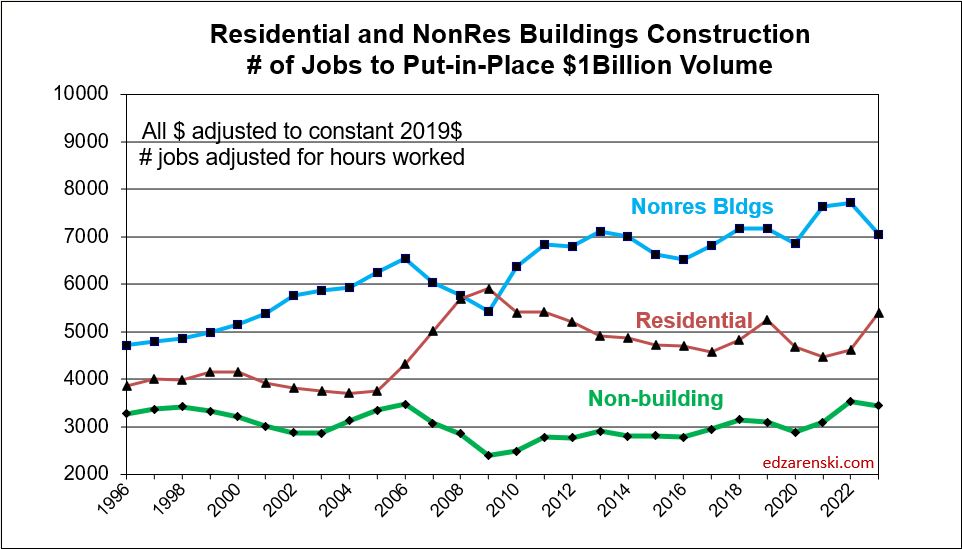
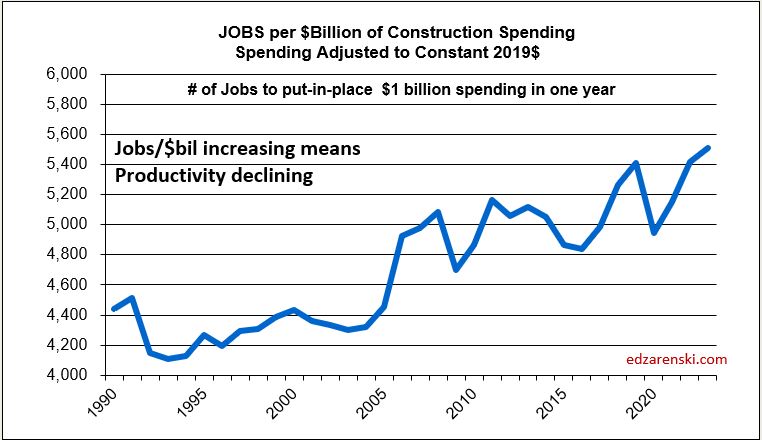
This next plot shows the number of workers required to put-in-place $1 billion of construction in 1 year. Except for Nonbldg Infra, which has remained relatively flat over time, it requires more jobs to put-in-place $1bil today than it did 10 years or 20 years ago. Total construction workforce (8,300,000) divided by # of billions$ put-in-place (2,200 billions$/yr) is the simplest way to show the decline in construction productivity. Results here broken out for major sectors.
Construction Jobs Total hours worked peaked in March, now down 0.4%. For May, jobs increased by 4,000 (<0.1%), but unemployment dropped from 5.6% to 3.5% (175,000). That would mean that 171,000 workers dropped out of the workforce.

Steel Tariffs 50%
50% of nonres bldgs are structural steel. Str Stl is 10% of total bldg final cost. Nonres bldgs construction spending = $770bil/yr., $385bil on SS nonres bldgs., $38.5bil on str stl
Struct Steel material is only 25% of steel total contract cost, so 38.5 x 25% = only $9.6 bil is mtrl used in SS nonres bldgs. So at 50% tariff = $4.8bil added cost to nonres bldgs total spending. (This assumes ALL steel increases in cost).
Above is structural steel only. When including all other steel used in a building, (rebar, studs, frames, etc), steel is 15% of total bldg cost. So added cost would be $7.7bil.
And that is just nonres bldgs. MF Rsdn uses a little steel, but Nonbldg markets, Power, Highway, Transport, Pub Util adds about another $5bil.
So, steel tariffs, IF ALL STEEL WERE TO INCREASE, adds inflation to total Nonres Bldgs and Nonbldg. Half of all Nonres Bldgs use structural steel, so inflation to SS bldgs is 4.8/385, or 1.25% on structural steel bldgs. If looking at the macro view, inflation over the nonres bldg sector, then the $4.8bil increase would be divided by the total nonres spending, or 4.8/770 = 0.625%. All other bldg steel, applied to all nonres bldgs, added another 2.9/770 = 0.4%
Nonbldg Infrastructure markets, if it is a SS building, add the same 1.25% + 0.4%. But Public Works and especially Bridge construction can add significantly more. If domestic producers also raise pricing to follow suit with tariffs, as expected, this is what happens to total Nonres inflation.
US imports 30% of steel it uses. 40% of all steel is used in construction. If 30% is balanced across all types of steel, then 30% of constr steel is imported. (It would take some concentrated effort to determine % imports for each of the individual steel uses.) IF ONLY IMPORTED STEEL WERE TO INCREASE and no domestic manufacturers raise prices, 30% of building steel increases in cost. That is not likely at all. But if so, tariffs would add only 0.4% to nonres bldgs and about 0.1% for all other steel.
Hurricanes & Residential Construction
Over the next few years there could be many billion$ of construction spending to “repair” hurricane damaged homes. That spending will NOT be reported in Census construction spending reports. According to Census definition, renovations to “repair” natural disaster damage are not recorded in construction spending.
Construction spending to “replace” homes entirely lost to hurricane damage (wiped completely off the foundation) IS reported in Census spending, but it is reported as renovations/repair, not new SF or MF construction. These are not “new” homes and do not add to the new home count. The work is to replace an existing home.
There will be billions$ of residential construction and the associated labor that will fall outside posted Census data. Some of that spending and labor will be diverted from the growth in residential construction tracked by the Census Rsdn$. So, it is conceivable that Census tracked residential spending could slip slightly from current projections, and yet the work is being done, only unaccounted for.
(All of this is true also for nonresidential).
Expect increased demand and potentially longer waits for all residential building products; lumber, doors, windows, roofing, siding, drywall, flooring, HVAC, plumbing, electrical and appliances, primarily or exclusively in the affected regions.
If your business is in a region that is currently outside the affected region and slow for residential construction, consider that anybody with a hammer and a pick-up truck may be traveling to the affected regions to work. That could mean that many slow regions may lose some available labor, as the labor will move to the affected area.
For every $1billion of work needed to replace damaged buildings it requires 4000-5000 construction workers for one year. That could also be stated as 1000 jobs for 4 to 5 years. Very early damage projections due to Helene and Milton range from $50-$175 billion, but not all of that is construction. If even $10 billion of work is construction to repair/replace damaged buildings, that would require 10,000 jobs for a period of 4 to 5 years (or 20,000 jobs for 2 to 2 1/2 years).
Can We Increase Residential Construction by 3 Million Units in 4 Years?
Here’s a look at the residential construction industry. Except for the first mention of Current $, All $ in this analysis are inflation adjusted Constant 2019$, so all years can be compared on equal terms. All numbers are rounded slightly.
Currently in 2024 $, residential construction spending is $940 billion/year, 43% of all construction. Only 60% of that ($560 billion) is spending on new housing units. The other 40% is Reno.
Currently for 2024, residential construction supports 3,350,000 jobs. Only 60% of the jobs (2,000,000) are for new units.
30 years ago residential construction spending was $550 billion/year and there were 2,200,000 jobs. On average over 30 years (including all up or down years) we’ve added $14 billion/year in spending and 38,000 jobs per year.
The 30 year (1995-2024) average growth in residential spending, counting only 21 up years, (eliminating all 9 down years) is +$36 billion/year. There were 2 years that we added +$70 billion/year in spending (one of those in 2021) and including those, there were only 7 years over +$50 billion/year.
The 30 year (1995-2024) average growth in residential jobs, counting only 21 up years, (eliminating down years) is +125,000 jobs/year. In 1999, we added 270,000 residential jobs. Since 2011, the most we’ve added in a year is 170,000 jobs in 2021. That’s for ALL residential construction.
In 30 years, we’ve never added more than $70 billion/year in residential construction spending nor more than 270,000 residential jobs in a year. Since 2011, the most residential spending increased was $70 billion in a year and the most residential jobs increased was 170,000 jobs in a year, both in 2021.
Only 60% of all residential spending and jobs is associated with building new housing units. The other 40% is renovations, not associated with new construction. That must be considered when reviewing all the historical data noted above. So the following is just to look at the data without renovation.
Reduce the data by 40% to eliminate spending and jobs associated with renovation and look at just the data associated with building new housing units: In 30 years, we’ve never added more than $40 billion/year (2004,2021) in residential construction spending on new units nor more than 160,000 residential jobs in a year (1999,2005). This is for New Units construction only.
Since 2011, the most spending increased for new units was $40 billion in a year (in Constant 2019$) and the most jobs increased was 100,000 residential jobs, both in 2021.
The last time residential jobs for new units increased by 100,000 or more in a year was 2005. Best growth ever was 2004-2005-2006, when we averaged +120,000 jobs/yr for 3 years, just for new units. In fact, the only times residential jobs for new units increased by more than 100,000 were 1999, 2004, 2005 and then finally again in 2021. But 2004-2006 was a time when the construction unemployment rate averaged 7.5%-8.5%. In 2021, construction unemployment averaged 6%. Now the unemployment rate is averaging 4.5%.
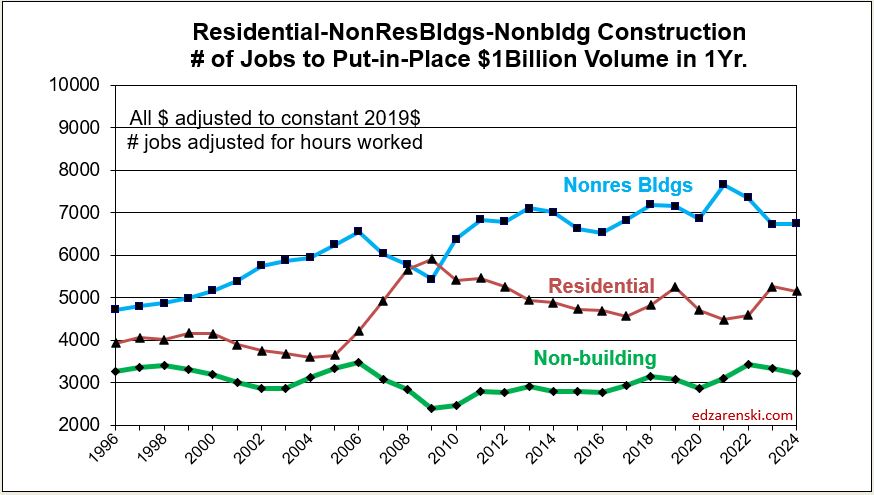
(It would be wise to use post-2011 data for the jobs analysis. The construction industry, especially residential and nonres bldgs, experienced a labor base reset in the period 2006-2010, a period from which we have never fully recovered. Notice in this plot that residential was nearly level at 4000 for 10 years, then from 2005-2009, it shot up to over 5000. It’s remained near 5000 since 2010.).
If we were to match the maximum growth rates since 2011 (and in the case of spending, since 1994) we would increase new residential units construction spending by $40bil/$390bil = 10% and we would increase new residential jobs by 100,000/2,000,000 = 5%. Spending maxed at 10%, but jobs max growth at 5%.
The number of new housing units built in a year varies, but for this post I’ll use 1,500,000. Currently it’s a bit less than that. Increasing new units by 5% to 10% per year on a base of 1.5 million units/year would net a growth between 75,000 to 150,000 added units per year. Let’s use 100,000 new units in the first year. That would be 6.7% growth, already more than the 5% jobs. We would continue the growth, so we increase that by another 100,000 in the 2nd year, and again in the 3rd and 4th years. Leave no doubt, growth of 100,000 units/yr would mean adding jobs to match or exceed the best single-year growth rate in the residential new units construction industry since 2005, and keep matching that growth rate for four consecutive years.
CORRECTION: 8-21-24 The Corrections (now fixed) above raise the upper limit of potential growth based on spending from 7% to 10%, or 150,000 units/yr, but only if we take the result to be dependant on the upper limit % spending growth. I had divided by current $ when I should divide by constant $. Spending can vary a lot more than jobs. While some years of jobs growth reach 6%-7%, average residential jobs growth is just over 4%. Jobs never grow at 10%/year.
This plot shows the steady growth in residential jobs, 75% over 15 years. Compounded that’s about 4%/yr. So, it seems much more likely the limiting factor here is jobs, not spending.

In this analysis, the number of units was chosen at 100,000/yr., an increase of 6.7%/yr., well below potential spending growth but already more than jobs growth. The jobs increase in 2021 was 5%/yr. In 2004-2005, jobs growth was 8%/yr. So, this 6.7% is near the high end of potential jobs growth. This implies an add of 130,000 jobs.
So we would increase new units by 100,000 + 200,000 + 300,000 + 400,000 or 1,000,000 total new affordable residential units over the next 4 years.
By this rough analysis, to increase new residential units by 3 million over current production over the next 4 years would require that we increase residential construction and jobs by 3x greater than the best performance achieved in the construction industry in the last 30 years, and keep it up for the next 4 consecutive years. That’s more jobs than the entire construction industry gains in one year and the new units subset of construction is only 25% of all construction.
Although there has been times past when jobs increased by 120,000/year, that was a time when unemployment was much higher and there were more workers available to readily go back into the workforce. It’s not impossible that jobs can grow faster, and therefore also the number of new units, but it is unlikely.
If a substantial portion of the current 1,500,000 unit production (500,000 units a year for the next 4 years) were shifted over to affordable units, the picture changes considerably. But I wouldn’t expect that current demand to just go away and shift to lower cost units. So, this leaves current demand as is and adds jobs.
A Proposal: If some amount of the funds to be invested in this program is directed towards trades training programs, within two years, and every year after, we could potentially be turning out some of the extra 260,000 additional workers we would need every year to achieve 3 million new housing units. This approach would create both good jobs and new affordable homes. Incentivize the training program somehow. Paid internship. Perhaps with a guarantee in return to work for 2-3yrs. If we don’t invest in training workers for this effort, we cannot build more than the labor we have. Here’s a thread on my training proposal. https://x.com/EdZarenski/status/1828778915055468816

Construction Data Briefs Sept data 11-7-23
Total Construction Spending in 2023 is forecast at $1,960 billion, an increase of 6.0% over 2022.
Nonresidential Buildings spending is leading Construction spending growth.
With nine months in the year-to-date (ytd) for 2023, total all construction spending ytd is up 4.6%. Nonresidential buildings spending is up 22% ytd compared to Jan-Sep 2022. Manufacturing last month was up 72% ytd. I forecast then it would drop to 66% and this month revised that to 67%. Current ytd dropped this month to 70%.
Construction Spending thru Sept. Residential is down 8% ytd. Could add 7% in 2024. Nonresidential Bldgs is up 22% ytd. Expect +6% in 2024 Non-building Infrastr is up 12% ytd and could add another 11% in 2024

Residential construction spending fell only 8% from Mar’20, the pre-recession high, to May’20, the Covid low. From May’20 to May’22, spending increased 67% to the post-recession high. Since May’22 spending is down 12%.
Manufacturing construction spending, from 2015-2021, averaged $80bil/yr. For 2023-2025, manufacturing constr spending will average $200bil/yr.
Highway spending in 2023 is averaging $130bil and is expected to finish the year at $131bil. That’s up 15% from 2022 and up almost 27% in the last two years. Highway spending is expected to increase 25% over the next two years and may continue upward to a peak spending in 2026.
After nearly 8-10 years of fairly well balanced construction volume of work vs jobs, the last 2-4 yrs of volume growth (spending minus inflation) well below jobs, is now coming back into balance. Nonres Bldgs and Non-bldg volume (+11% & +6%) increased to support jobs. Jobs grow steady at 2.8%.
Non-bldg has a ways to go to get to balance. That work volume is on it’s way in the forecast, particularly from Highway and Public Utilities.
Actual residential jobs is probably higher than shown here as there are several issues with capturing all residential jobs.
Sum of all jobs vs Construction volume from 2011-2018 was balanced. In recent years, 2021-2023, jobs grew faster than volume. Nonres is now playing catch-up, volume is increasing faster than jobs..

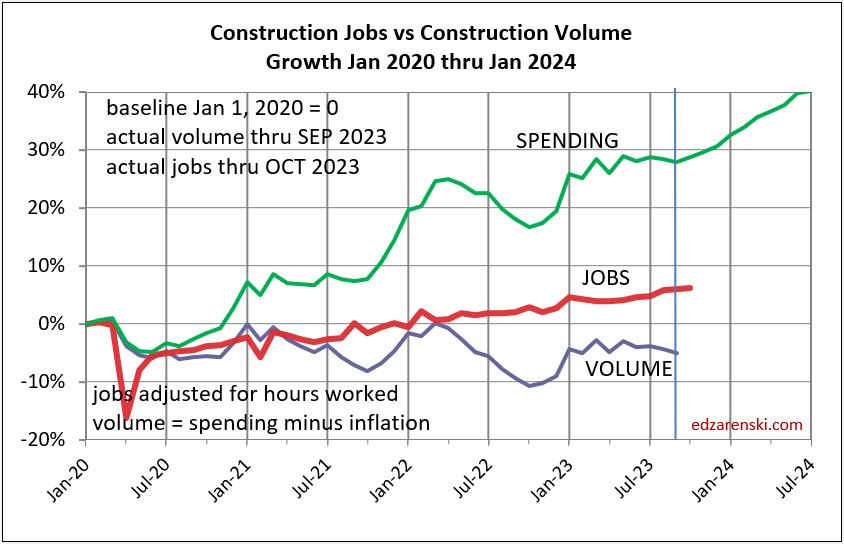
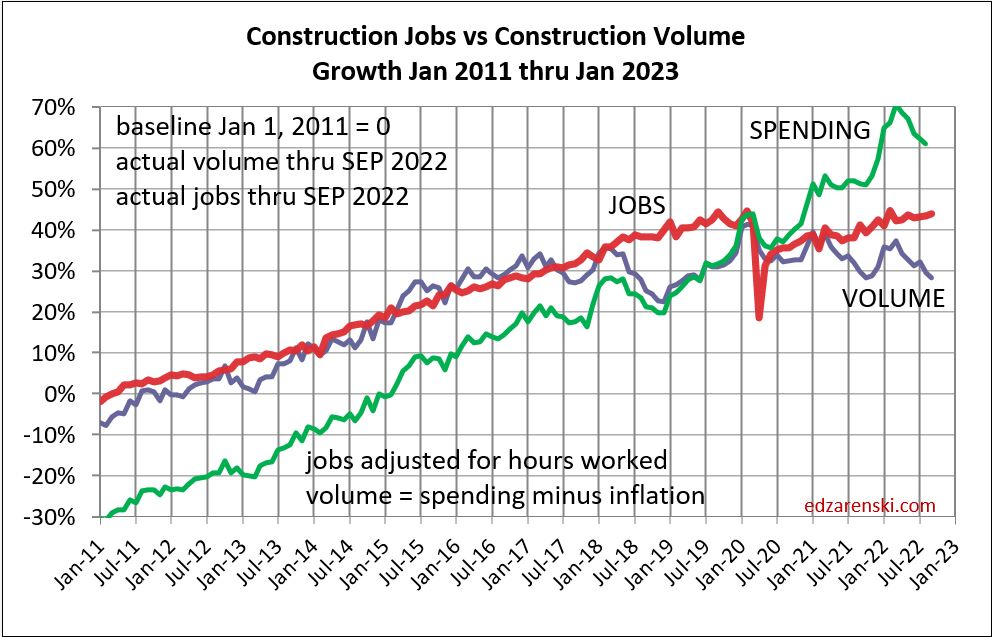
Construction Jobs x hours worked is up 6% since the pre-pandemic high in Q1 2020. Construction volume (spending minus inflation) is down 5.5% since Q1 2020. These two indicators should move in tandem. (See plot above from Jan2011 to Jan2018) When jobs increase faster than the volume of work, productivity is declining.
For 2024 and 2025, volume of work is forecast to increase 3.5% and 4.0%. Most of that gain in 2024 and 2025 is from Non-building Infrastructure forecast growth of 7% and 8%. Jobs increase at a normal rate of 2.5% to 3.0% per year, so this growth in volume will go a long way towards setting jobs vs volume closer to balance.
An indicator I track looks at the predicted final spending (for Nonresidential buildings) for the year based on a projection based on the ytd for the statistically strongest months of the year, AMJJAS. These six months each average annual spending variation from average with standard deviation of less than 0.2%. This subset of annual data has produced an annual forecast within less than 2% variance from actual for 22 years. In fact, in 22 years this forecasting check has varied from actual by greater than 1.5% only twice. The average variation for 22 years is 0.7%. Only once in 22 years has the actual annual spending fell outside the range predicted by the statistically strongest months.
Another indicator I track is the forecast vs the actual spending. This plot shows Nonres Bldgs and Non-bldg Infra forecast vs actual. The track of actual spending is bumpier, but tracks right along with the forecast. My plot for residential was on track until the surge in 2020-2021.


Midyear ’23 Jobs Outlook
Construction JOBS continue to creep higher, even when volume is falling. From Apr’22 to Oct’22 jobs increased 1.5% but volume of work dropped 10%. Jobs and volume should track together as seen from 2011 to 2018. Since Oct’22, jobs are up only 2% while volume up 7%. Volume is catching up.
Jobs have been increasing at 3%/year, or approx 200k to 300k jobs per year. In Feb 2020 there were 7.6 million construction jobs. Now there is almost 8.0 million. The average for 2020 dropped 3% or 170k jobs. But we regained jobs at 2.5% growth in 2021, 4.2% in 2022 and so far over 2% in 2023. Now this is interesting, because we did not see an increase in average volume in 2021, 2022 or 2023. In total, jobs are up 4.8% since Feb 2020, while volume of work is down 4.7%.

Construction Jobs have been on an even rate of growth approx. 2.5% to 3% per year, even when volume is falling. Spending has been on a bumpy climb, but keeps climbing. Without inflation real volume of work overall since 2020 has not increased at the same rate as jobs.
Current July Jobs are up 1.5% since Dec.’22, up 3% vs the average for 2022. July will be pretty close to the average for 2023. As construction inflation slowed down (has been slowing since mid-2022), volume gained ground on jobs over the last 9 mo., but jobs since Jan 2020 are still 10% higher than volume.
Here’s a look at total jobs just since 2020

Why do jobs sometimes/often grow faster than volume to support those jobs? Some possibilities:
When inflation is unusually strong, business planners may misjudge growth. Planning jobs growth on inflated revenues that net much lower than expected volume may lead to misjudging jobs growth. Result is jobs growth faster then volume.
When volume is decreasing, firms may be reluctant to (or smart not to) let go jobs. See the period on the above plot from Mar 2022 thru Oct 2022. Vol dropped 10%, Jobs increased 2%. So, the calculation shows a big excess in jobs for that period, because volume growth doesn’t support it. Within the next six months, volume increased 7%, making up half the difference.
Here’s jobs vs vol in each sector.
Notice how Rsdn jobs barely declined in 2020, but Rsdn volume increased 10%. Did that set off cries of jobs shortage in Rsdn? Not so in Nonres.

In Nonres Bldgs, volume by 2021 had fallen below growth in construction jobs. The deficit reached its worst in 2022 but in the last 9 months volume growth far faster than jobs growth has evened the balance.

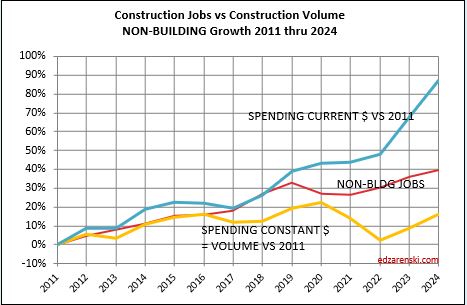
Nonbuilding construction volume fell to a deeper deficit than Nonres Bldgs. But we can see the gap closing as volume increases faster than jobs.
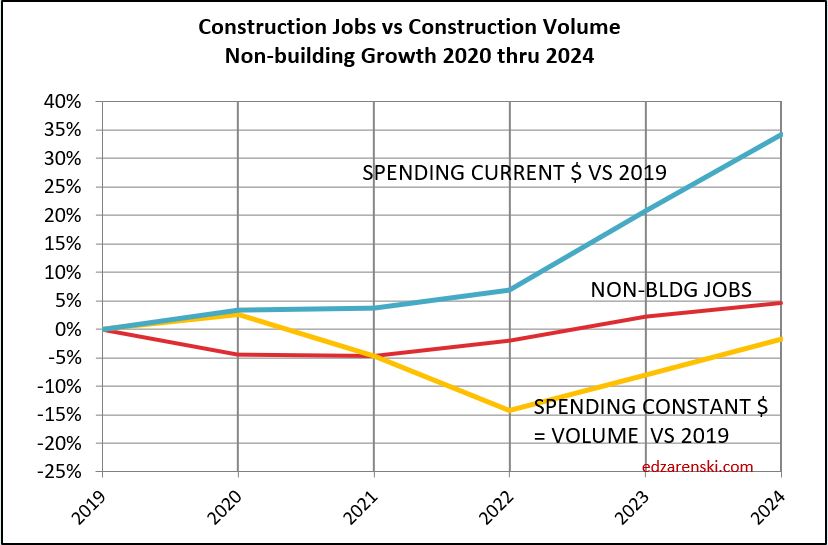
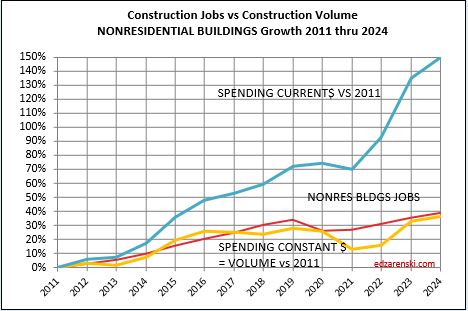
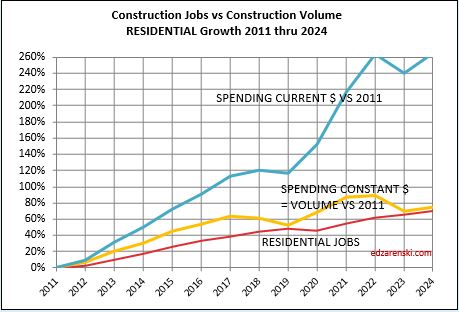
These above three sector plots go back to base 2019, showing how much percent change there has been since 2019. For a longer term look, here below is a plot of Nonresidential Buildings back to 2011. On this plot we can see jobs growth, when compared to 2011, for Nonres Bldgs, is above volume growth since 2017. The low point of volume was in 2021. 2022-2023 has posted the most rapid growth in many years. This closes the gap between Nonres jobs and volume, very helpful to the productivity outlook.

When splitting out jobs by sector we must always remember that some Nonres bldgs jobs actually work on constructing residential buildings (for ex., steel and concrete on a multifamily hirise) but remain counted as nonres jobs. Also, some undocumented workers may not be counted at all in residential jobs. That skews the data plots. But you can see that it would reduce the jobs in Nonres and increase the jobs in residential, improving both plots.
Construction spending data is indicating a slight dip in volume growth over the 2nd half 2023, but then leading into much stronger growth in 2024 in all sectors. Volume by Feb’24 is back to today’s level after falling 5%. I don’t expect jobs to decline with the drop in volume. Maybe slow down. I think at worst jobs hold steady for a few months before resuming 2.5%-3% annual growth later this year.

When jobs continue to increase while volume is dropping, that wrecks productivity. But sometimes volume increases rapidly while jobs grow steady at a 3% rate. Look at the period Oct’22 thru Jan’23. Jobs increased 2%, but volume quickly jumped 6%.

The number of jobs required to put-in-place $1 billion of construction in one year, as plotted below, about 5000 for residential, is the inverse of the plot above, the annual amount of $ put-in-place per job, about $200,000 for residential.

Construction Spending – Volume – Jobs
12-3-22
This plot is not showing good performance. Volume and jobs should be moving directly in tandem. When inflation is very high, spending climbs rapidly. But most of the climb is just due to inflation. To find out what’s really going on we need to look at business volume. Take out the inflation $.
Business volume = Spending minus Inflation. Inflation adds nothing to business volume. Inflation adds only to the amount of revenue that changes hands.
In 2022, residential spending is up 16%. Sounds great, homebuilder’s revenues are up 16%. It’s great until you note that residential inflation for 2022 is 15%. Real residential business volume for 2022 increased only 1%.
Since Jan.2020 spending is up 20%. Revenues are up 20%. It’s pretty hard to not think you need additional staff to support 20% growth in revenues. But inflation is 30%. Take out the inflation dollars and we find that volume is DOWN 10%. Well, during that time, jobs increased 1 to 2%. And yet, business volume is down 10%. That’s a massive 11%-12% loss in productivity. With labor being about 35% of the total cost of a job, that’s added about 4% to total inflation.
I recently read an article that stated (attributed to Assoc. Bldrs. & Contractors) that the construction industry needs to add 1,000,000 jobs over the next two years. Here’s why that won’t happen:
1) The construction industry has never added more than 440,000 jobs in one year. It’s only gone over 400,000 four times in 50 years, the last time 2005, and never two years in a row. The most construction jobs added in a year since 2011 is 360,000 in 2014. The average growth rate from 2011 thru 2019, and now also in 2022, is 230,000 jobs per year. The most jobs added in any two consecutive years is just over 700,000 in 1998-99 and 2005-06. So, the construction industry may not have the capacity to grow 1,000,000 jobs even in two years.
2) Since the Pandemic, nonresidential construction volume is down 20%, but nonresidential jobs are down only 1.5%. Compared to 2019, nonresidential construction has an 18% business volume deficit. In other words, Nonres construction in 2022 now has 18% more jobs per volume of work put-in-place than it did in 2019. Total ALL construction business volume in that period is down 10% while jobs are up 1.5%.
3) Inflation is playing a key roll here. In 2022, construction spending is increasing $160 billion or 10%. But inflation is 13%. Real total construction business volume in 2022 is down 3%. Jobs are up. For 2023, spending is forecast to gain $80 billion, 4.6%, but after inflation volume will be down 1%. 2023 numbers are driven down by residential.
4) In 2023, nonresidential volume increases $35 to $40 billion. Residential volume drops $50 billion. It takes 4000 to 5000 jobs to put-in-place $1 billion of volume in one year. Nonbuilding and nonresidential buildings growth of $40 billion would need 160,000 to 200,000 new jobs. Some small amount of that will come from the drop in residential. But, go back and read #2 again.
Since Jan 2020, the construction industry as a whole has nearly +175,000 (+2%) more workers to put-in-place -$175 billion (-10%) LESS volume. That’s a huge loss to productivity that may take years to recover, if ever.


Construction Briefs Nov’22
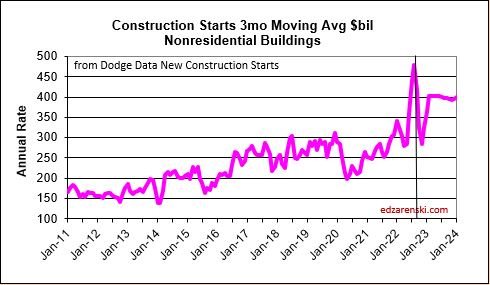
Construction is Booming. Well, OK, construction is setting up to be booming in 2023-2024. New construction starts for Sept are down 19% from August and yet starts are still near the highest levels ever. Sept is 4th highest total starts ever, all four of the highest ever months of new starts are in 2022. July and Aug were the two highest months of new starts ever. Total growth in starts over 2021-2022 > Nonres Bldgs +50%, Nonbldg Infra +40%, Residential (all in ’21) +22%.
STARTS
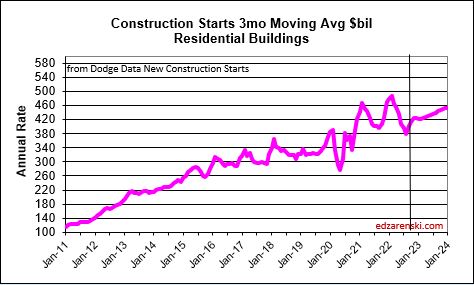

Construction Spending will not be participating in a 2023 recession. Except, residential might. Residential starts in 2021 were up +21% to a really high new high. But starts are forecast flat in 2022 and 2023. Spending grew 44% in the last 2yrs, but inflation was 30% of that 44%. With zero growth in starts forecast for 22-23, spending struggles to keep up with inflation. Residential will post only an increase of 3% in 2023 spending, but midyear there is potential for 6 consecutive down months.
See also Construction Year-End Spending Forecast Dec’22
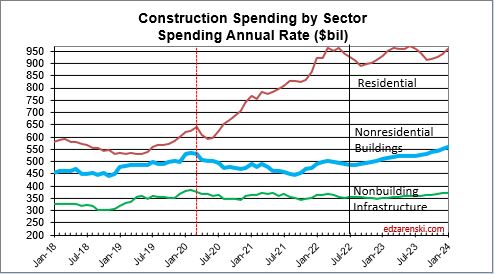
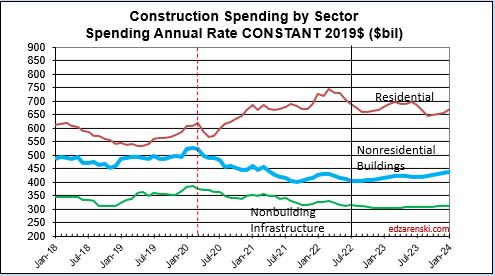
SPENDING BY SECTOR CURRENT $ AND INFLATION ADJUSTED CONSTANT $


Nonresidential Buildings new starts last 2yrs (2021-2022) are up 50%. Spending next 2yrs (23-24) is forecast up 21%.
Nonbldg starts 2022-23 are forecast up 38%. Spending 2023-24 forecast up 20%.
In 2023, it’s Nonresidential Buildings leading growth. In 2024, it will be Nonbuilding Infrastructure leading spending growth. Both are expected to grow more than the inflation index, so there will be real volume growth to report.
Residential construction (Dodge) starts since Jan 2021 have posted 17 out of 21 months of the highest residential starts ever posted. The 5 highest months ever are all in 2022.
Nonresidential Bldgs starts in Sept dropped 23% from August and yet still that was the 3rd highest month ever. July and August were 2nd and 1st.
Construction starts for Nonresidential Bldgs posted each of the last 4 (consecutive) months thru October higher than any months ever before. The avg of last 4 (consecutive) months is 33% higher than the avg of the best previous 4 mo ever (even non-consecutive). Growth in Manufacturing construction starts for 2022 far surpasses growth in any other market, up over 150% year-to-date.
Construction Spending Sept total up 0.2% from Aug. Aug & Jul were revised up 1.1% & 1.3%. Total spending YTD thru Sept’22 is up 11.4% from Sept’21. MAJOR movers; Mnfg up 16% since Jun. Jul & Aug were revised up 7.4% & 8.4%. Highway is up 9% since June. Jul & Aug were revised up by 4.0% & 4.4%.
SPENDING FORECAST

Total construction spending for 2022 is on track to increase +11.1%. Residential +16.8%, Nonres Bldgs +9.5%, Nonbldg +0.5%.
Comm/Rtl +18% Mnfg +32% Power -8% Pub Utilities +14%.
Current and predicted Inflation SEE Construction Inflation at Year-End 2022
Inflation adjusted volume is spending minus inflation.
Total volume for 2022 falls 1%. Rsdn +3%, Nonres Bldgs -1%, Nonbldg -9%.
Total volume for 2023 is up 1%. Rsdn -3%, Nonres Bldgs +8%, Nonbldg +2%.
SPENDING TOTAL ALL $ CURRENT $ AND INFLATION ADJUSTED CONSTANT $
Overall Construction Spending is up 15% since the onset of the pandemic, but, after adjusting for 25% inflation, volume is down 10%. Residential jobs are near even on track with volume, but Nonres and Nonbldg have volume deficits of approx 20-25% vs jobs.
- Feb 2020 to Aug 2022
- Resdn spend +42%, vol +6.5%, jobs +7%
- Nonres Bldgs spend -8%, vol -24%, jobs -3%
- NonBldg spend -7.5%, vol -24%, jobs +1%
JOBS VS CONSTRUCTION VOLUME VS SPENDING (VOL = SPENDING MINUS INFLATION

Labor Shortage? Jobs should track volume, not spending growth. Vol = spending minus inflation. Volume is down while jobs are up. If the same production levels ($ put-in-place per worker) as 2019 were to be regained, theoretically, nonresidential volume would need to increase 20% with no increase in nonresidential jobs. I don’t expect that to occur, therefore, productivity will remain well below that of 2019.
LABOR PRODUCTIVITY

Over the next year or two, there could be several billion$ of construction spending to repair hurricane damaged homes in Florida. That spending will NOT be reported in Census spending reports. Renovations to repair natural disaster damage are not recorded in construction spending. Construction spending to replace homes entirely lost to damage IS reported in Census spending, but is reported as renovations/repair, not new SF or MF construction.
RESIDENTIAL SPENDING SF-MF-RENO CURRENT $ AND CONSTANT $


Construction Jobs and Inflation
Construction jobs through August 2022 increased to 1.1% above the pre-pandemic high in Q1’20. Factoring in hours worked, we find that is reduced slightly to show jobs x hours worked for August 2022 is 0.4% lower than the peak in Q1 2020. Most anyone would say jobs have returned to the pre-pandemic high.
Construction spending through July is 14.3% higher than the pre-pandemic high in Q1’20. BUT INFLATION through July is 23% higher than pre-pandemic Q1’20. Therefore real construction volume (spending minus inflation) is currently 7% BELOW the pre-pandemic high in Q1 2020.
Jobs are up, but volume is down.
So, when you read that jobs are back to pre-pandemic levels, maybe that’s not as great as you might think. Sure more people are back to work, but has the volume of work needed to support those jobs increased sufficiently?
Inflation hides a lot of reality. We now produce 7% less volume of work put-in-place with 1.1% more workers putting in 0.4% less hours than before. That’s a huge construction productivity loss, down 6.6% in the last 30 months. Where does that productivity loss show up in the data?
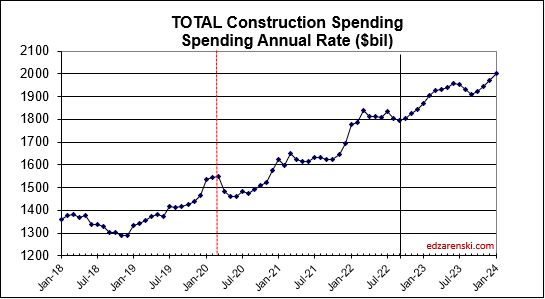
Here’s the plot of actual and forecast CONSTRUCTION SPENDING. Compare this to the next plot.
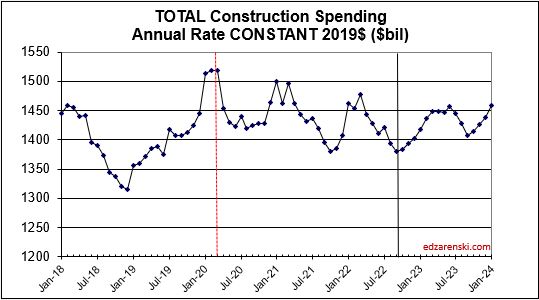
Here’s the plot of actual and forecast CONSTRUCTION SPENDING ADJUSTED FOR INLATION.
Notice, Residential volume is up 11% since Q1 2020, but nonresidential buildings volume is still down 23% and non-building volume is down 18%.
Let’s say construction labor is 35% of total construction cost. If wages go up by 5%, then total cost goes up by 5%x35% = 1.75%. Well, if productivity declines by 6.6%, labor cost goes UP by 6.6%x35% = 2.3%.
That’s the inflation cost. Here’s a look Behind the Headlines. These two plots show the number of jobs required to put-in-place $1 billion of volume (inflation adjusted spending) or the inverse, the amount of volume put-in-place by one job in one year.


It’s great that jobs are coming back, but don’t overlook the cost that has added to inflation. Don’t expect to see a lot of improvement over the next 12 months. In fact, if jobs continue to grow at the current rate (or any rate for that matter), this time next year the imbalance is worse.
