Construction Inflation
1-16-24 SEE Construction Inflation 2024
1-12-24 PPI Inputs table updated to Dec data, updated quarterly inputs, updated 2023 Firms Inflation plot
12-13-23 PPI ( Inputs Only) updated to Nov data
11-15-23 PPI Inputs and Final Demand updated to OCT data
10-13-23 PPI Inputs updated to SEP data
10-4-23 PPI Inputs and Final Demand tables updated to AUG data
8-11-23 PPI Inputs and Final Demand tables updated to July data
8-19-23 Inflation Table 2015-2025 updated to Q2 2023
Usually construction budgets are prepared from known “current” costs. If a budget is being developed for a project whose midpoint of construction costs is two years in the future, you must carry in your budget an appropriate inflation factor to represent the expected cost of the building at that time. Why the midpoint? Because half the project cost occurs prior to that point and half occurs later than that. The balance point for spending is 50-60% into the schedule. Construction inflation should always be calculated from current cost to midpoint of construction, or in the case of converting an older actual cost to a future budget, from midpoint to midpoint.
Any time a construction project is delayed or put on hold to start at some future date, construction cost inflation must be calculated and added to the previous budget to account for the unanticipated cost increase due to the delay. Of utmost importance is using appropriate cost indices and forecasting future cost growth to account for the difference in original budget and revised budget.
The level of construction activity has a direct influence on labor and material demand and margins and therefore on construction inflation.
- Long-term construction cost inflation is normally about double consumer price index (CPI).
- Although inflation is affected by labor and material costs, a large part of the change in inflation is due to change in contractors/supplier margins.
- When construction volume increases or decreases rapidly, margins change rapidly.
When construction is very actively growing, total construction costs typically increase more rapidly than the net cost of labor and materials. In active markets, overhead and profit margins increase in response to increased demand. These costs are captured only in Selling Price, or final cost indices.
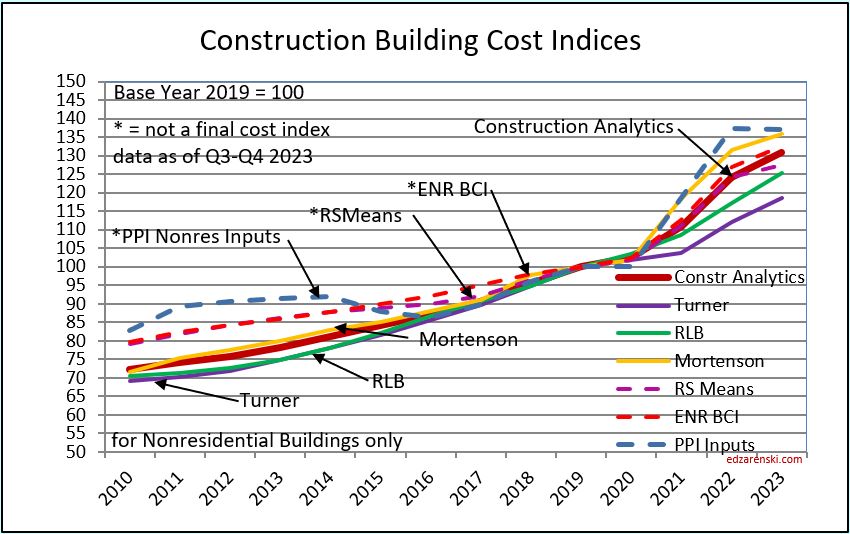
General construction cost indices and Input price indices that don’t track whole building final cost do not capture the full cost of inflation on construction projects.
Consumer Price Index (CPI), tracks changes in the prices paid by consumers for a representative basket of goods and services, including food, transportation, medical care, apparel, recreation, housing. This index in not related at all to construction and should not be used to adjust construction pricing.
Producer Price Index (PPI) for Construction Inputs is an example of a commonly referenced construction cost index that does not represent whole building costs. The PPI tracks material cost inputs at the producer level, not prices or bids at the as-built level.
Engineering News Record Building Cost Index (ENRBCI) and RSMeans Cost Index are examples of commonly used indices that DO NOT represent whole building costs yet are widely used to adjust project costs. Neither includes contractor margins.
It should be noted, there are far fewer available resources for residential inflation than for nonresidential inflation.
One of the best predictors of construction inflation is the level of activity in an area. When the activity level is low, contractors are all competing for a smaller amount of work and therefore they may reduce bids. When activity is high, there is a greater opportunity to bid on more work and bids can be higher. The level of activity has a direct impact on inflation.
To properly adjust the cost of construction over time you must use actual final cost indices, otherwise known as selling price indices.
Selling Price is whole building actual final cost. Selling price indices track the final cost of construction, which includes, in addition to costs of labor and materials and sales/use taxes, general contractor and sub-contractor margins or overhead and profit.
Refer to National Inflation Indices for comparison to several national selling price indices or various Input indices. National reference indices are useful for comparison. Few firms project index values out past the current year, therefore all future projections in these tables are by Construction Analytics.
1-18-23 Construction Analytics PPI Tables and Building Cost Index
Construction Inputs to Nonresidential Buildings dropped for five of of last six months, now down 5.2% since June, but still up 7.2% since last December. However, the average index for 2022, when compared to the average for 2021, is up 15.7%.
The average growth for the year accounts for all the peaks and valleys within each year and is the value carried forward into the index tables and charts. A glaring example of the difference between Dec/Dec tracking, or year over year, and annual average tracking, is Steel Mill Products which is down 28.7% Dec22/Dec21, but the annual average for 2022 is still up 9.0% from the average 2021. In fact, the last three years show Dec/Dec combined inflation is +71%, but the annual averages for the last three years show total inflation growth of 87%. Annual averages should be used to report inflation.
Residential inputs are down seven of the last eight months, down 7.1% since April, but still up 7.1% since last December. The average for 2022, when compared to the average for 2021, is up 12.7%.
Several major cost components have been on decline the last few months: Lumber/Plywood, Steel Mill Products, Fabricated Steel, Steel Pipe and Tube, Aluminum and Diesel Fuel. Of the 15 items tracked here, 10 declined in the last quarter. Concrete is the only product that has not posted any monthly decline in 2022. Costs are still high, but are moving in the right direction after 1st quarter 2022 costs that averaged +7% (28%annual) to +8%. Historically, most cost increases are posted in the 1st quarter and the least in the 4th quarter.
If inputs costs remain where they are right now as we start the year, input costs for 2023 will finish the year at -2% Nonres and -4% Residential. If we were to post small but steady cost increases of 0.25%/mo for the rest of the year, we would end with both Res and Nonres input costs up 4% for the year.
4-14-23 PPI Inputs slowed considerably since last year.
PPI Inputs to Construction March 2023—Nonres down 0.1% in Mar, down 6 of last 12mo, -1%over 12mo. Rsdn down 0.3% in Mar, down 9 of last 12mo, -7.5% over 12mo.
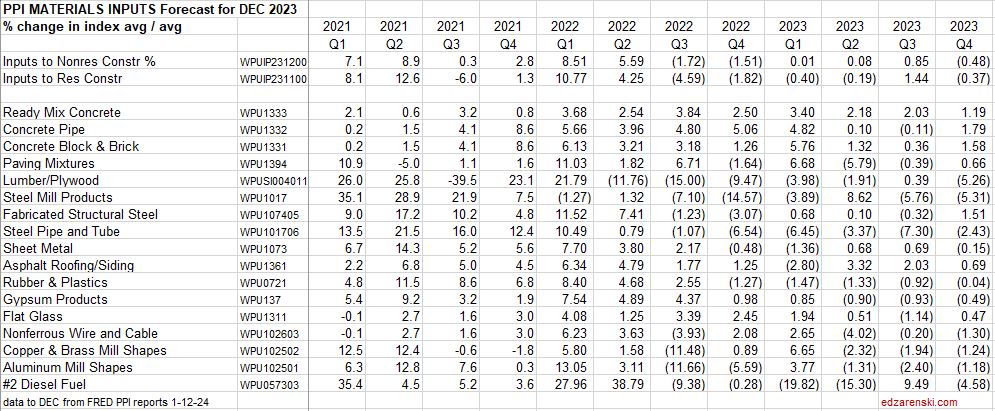
Qtrly change last 5 qtrs Nonres 9.7, 3.0, -3.2, -2.5, 1.6 Rsdn 15.2, -1.4, -5.0, -2.3, 1.0
Historically, the 1st or 2nd qtr would post the highest gains for the year. Here’s 1st and 2nd qtr for 2021, 2022, 2023
Nonres 7.1% & 8.9, 9.7 & 3.0, 1.6 & … Rsdn 8.1 & 12.6, 15.2 & -1.4, 1.0 & …
Last 12 months down -1.0% for Nonres and -7.5% for Rsdn. 1st qtr 2023 1.6 and 1.0, instead of (2022) 9.7 and 15.2% and (2021) 7.1 and 8.1%
Still early, but 12mo, 6mo and 3mo PPI signs are pointing down or at least low increases for construction inputs in 2023
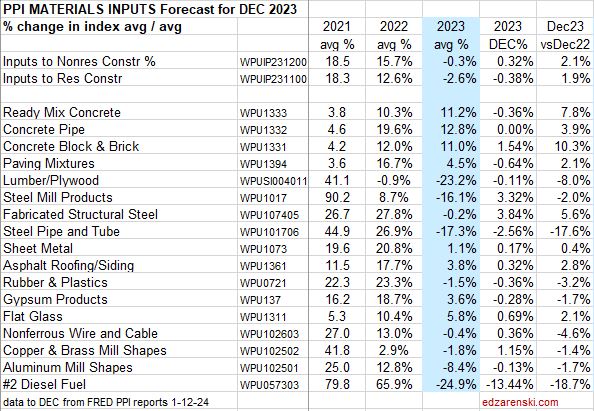
Be careful when referencing the 2023YTD. YTD is the growth so far this year. That is growth AFTER December. That does not represent the growth from the avg 2022. As an example, using Inputs to Nonres, the average growth in 2022 was 15.7%. That could be expressed as a starting Jan index of 100, a Jul 1 index of 115.7 and an ending Dec index of 131.4. The average of all 12 months in 2022 = 115.7, the average being at midyear. Well by averages the midyear index would be 115.7. The 2023YTD index is 2.6% since December (131.4) not 2.6% added to 115.7. This really highlights why it is much better to track the index than to report the percentage.
The last column, YTD vs 2022avg, gives an indication of 2023 avg if current YTD costs remain constant for the remainder of the year.
PPI INPUT TABLES and Inputs plot UPDATED 1-12-24
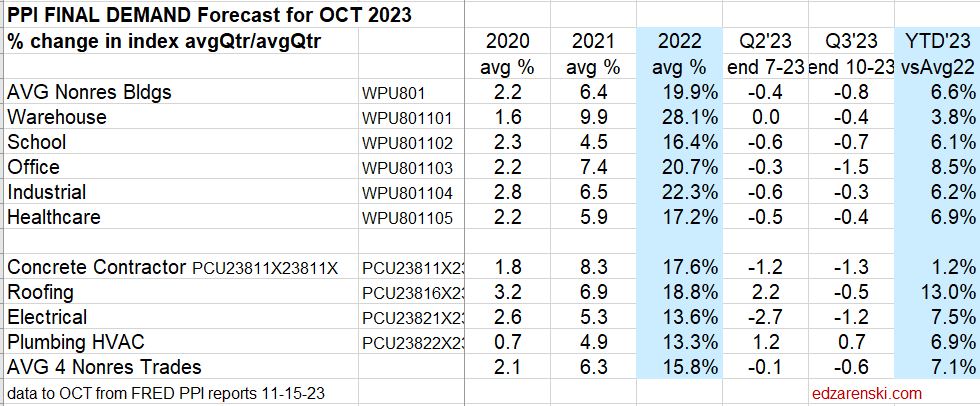
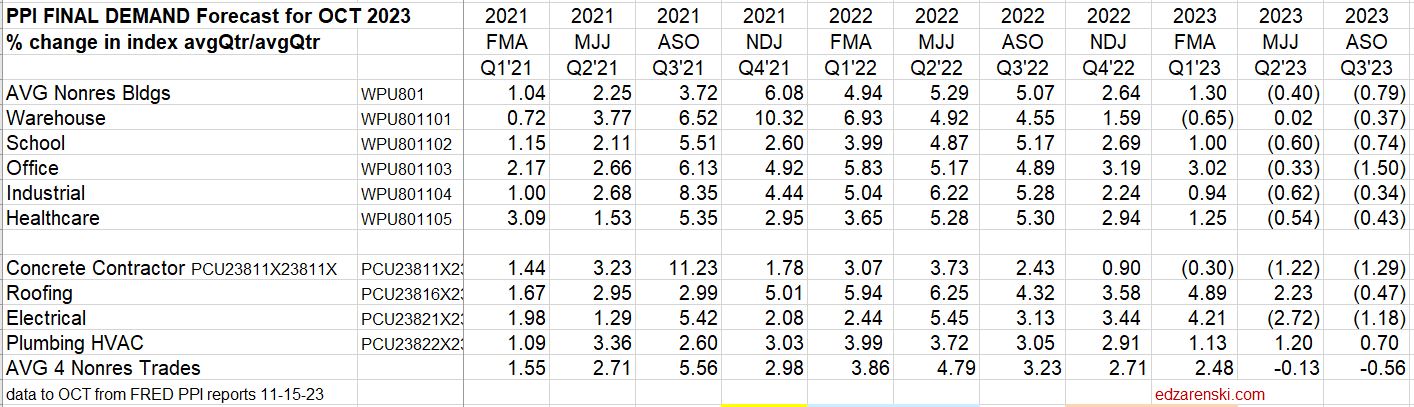
Final Demand PPI, or Selling Price, represents contractors bid price to client. Includes labor, material, equipment, overhead and profit. Labor includes change in wages and productivity. Every three months (Jan, Apr, Jul, Oct) BLS performs an update survey to correct these Final Demand indices. For the past six quarterly updates, about 80% to 90% of the change in the index was posted in the update month. Therefore, Final Demand indices should not be referenced monthly. These are quarterly indices. January is an update month. PPI Final Demand for Jan index is basically the correction for Nov and Dec. The index should NOT be compared mo/mo. Compare qtr/qtr, but make sure to use the correct update month with two other months, (Jan +Dec+Nov)/(Oct+Sep+Aug) The table shows the slowing progression from a 20% annual rate of gain for all of 2022 (avg nonres bldgs), to 2% the last two qtrs to only 0.1% the last qtr. Slowing is good. The last column, YTD vs 2022avg, gives an indication of 2023 avg if current YTD costs remain constant for the remainder of the year.
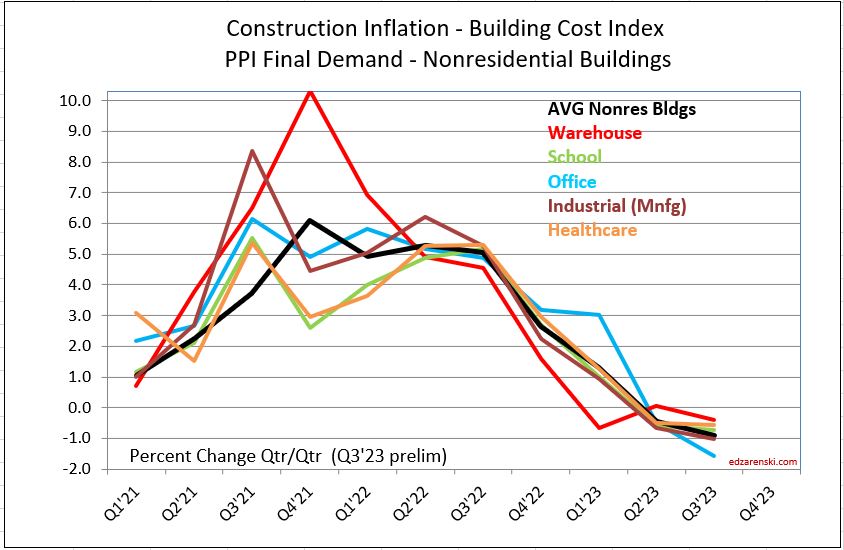
PPI FINAL DEMAND TABLE UPDATED 11-15-23
The Construction PPI Final Demand for Nonres Bldgs posted declines for the two most recent adjustment months, Apr and Jul. If distributed back to the months being corrected, Apr into Feb and Mar, Jul into May and Jun, it shows all bldgs, except Offc, have at least 6 months of declining cost. Office has been declining for only 3 months but Warehouse has been declining for 8 months.
The final demand PPI index for 2022 nonresidential buildings is substantially higher than Construction Analytics nonresidential buildings cost index reported in the index tables. These PPI values are but one of the references used to develop construction analytics building cost index.
Current and predicted Inflation rates 1-18-23:
- 2020 Rsdn Inflation 4.5%, Nonres Bldgs 2.6%, Non-bldg Infra Avg -0.3%
- 2021 Rsdn Inflation 13.9%, Nonres Bldgs 7.4%, Non-bldg Infra Avg 7.9%
- 2022 Rsdn Inflation 16.1%,Nonres Bldgs 12.9%, Non-bldg Infra Avg 13.8%
- 2023 Rsdn Inflation 1.9%, Nonres Bldgs 4.0%, Non-bldg Infra Avg 4.3%
Current and predicted Inflation updated to Q4’22 3-3-23
- 2020 Rsdn Inflation 4.5%, Nonres Bldgs 2.4%, Nonbldg Infra -0.3%
- 2021 Rsdn Inflation 14.0%, Nonres Bldgs 8.0%, Nonbldg Infra 7.9%
- 2022 Rsdn Inflation 15.8%, Nonres Bldgs 12.2%, Nonbldg Infra 13.8%
- 2023 Rsdn Inflation 2.2%, Nonres Bldgs 4.8%, Nonbldg Infra 4.7%
Current and predicted Inflation updated to Q2’23 8-17-23
- 2021 Rsdn Inflation 13.9%, Nonres Bldgs 8.2%, Nonbldg Infra 7.8%
- 2022 Rsdn Inflation 15.7%, Nonres Bldgs 12.1%, Nonbldg Infra 16.9%
- 2023 Rsdn Inflation 1.2%, Nonres Bldgs 5.4%, Nonbldg Infra 3.9%
- 2024 Rsdn Inflation 4.0%, Nonres Bldgs 3.8%, Nonbldg Infra 3.5%
Current and predicted Inflation updated to Q3’23 10-2-23
- 2023 Rsdn Inflation 1.4%, Nonres Bldgs 6.0%, Nonbldg Infra 3.9%
- 2024 Rsdn Inflation 4.0%, Nonres Bldgs 3.8%, Nonbldg Infra 3.5%
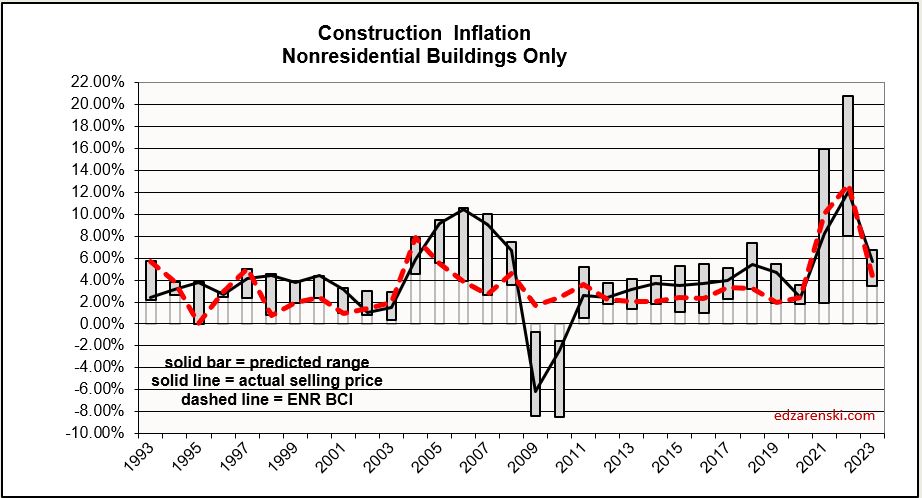
Most of the tables and plots here are cumulative indexes. Construction Inflation annual percent for Nonres Bldgs is plotted on this bar chart. The gray bar represents range of predicted inflation from 8 to 10 sources. The dark line is Construction Analytics (final cost) BCI. The red dash is ENR BCI (input index). The range in 2021 and 2022 was widest ever. The range for 2023 is small.
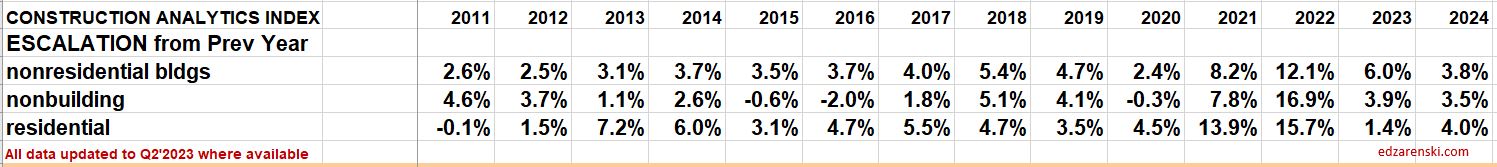
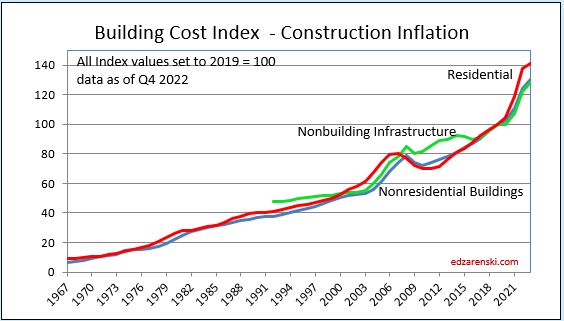
Construction Analytics Building Cost Index and other industry references
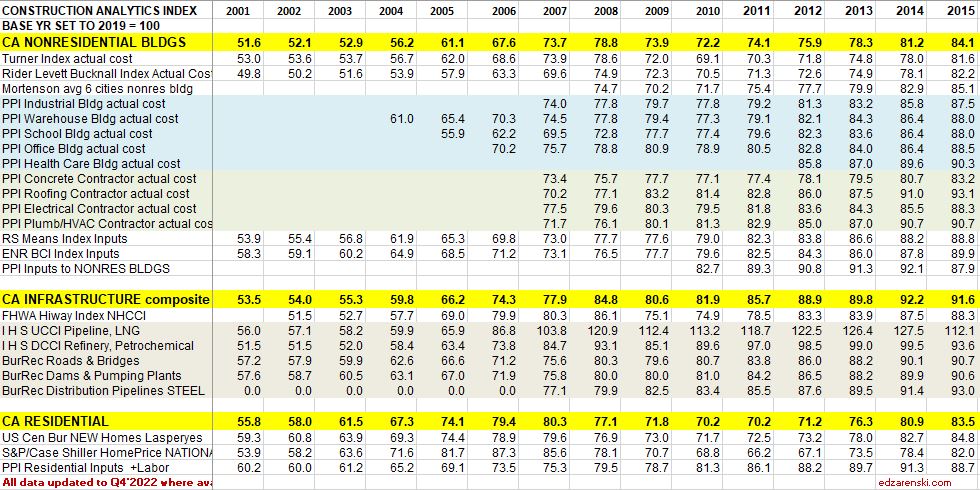
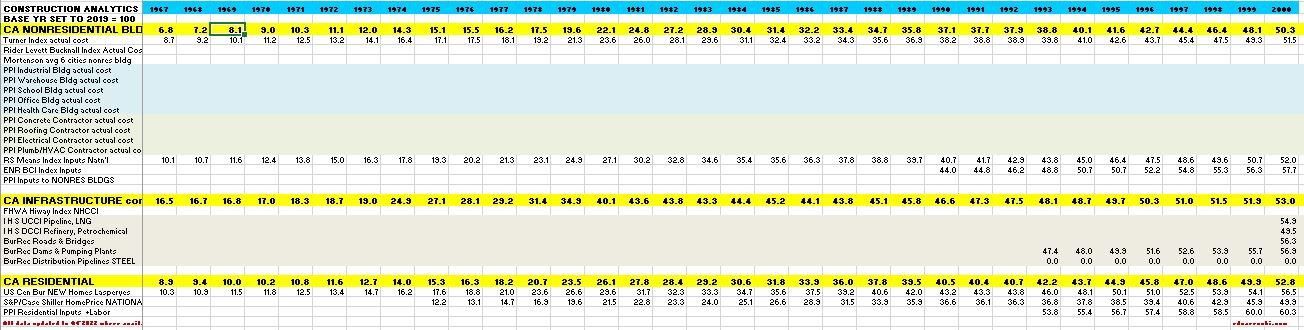
Tables and Plots 2001-2015 updated to Q4’22 2-6-23:
the following table 2015-2024 was updated to Q2 2023 on 10-2-23
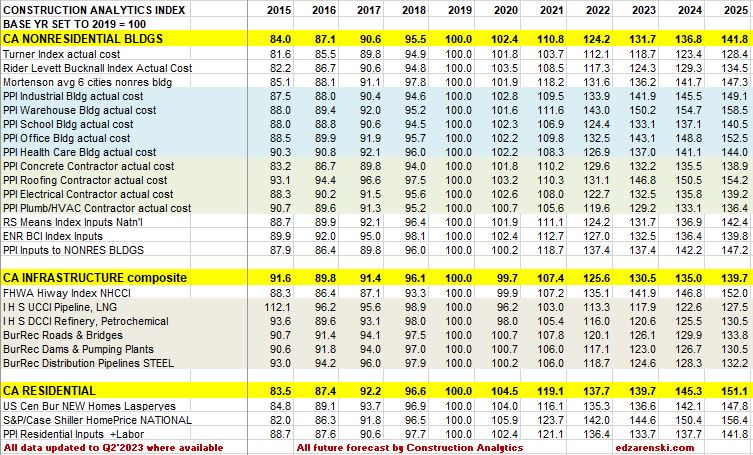
In the table above, dividing the current year by the previous year will give the current year inflation rate. All indices are the average rate for the year.
Also in the tables above, all reference indices data is gathered, then all are normalized to a common base, 2019 = 100. This allows to see how different indices compare.
How to use an index: Indexes are used to adjust costs over time for the effects of inflation. An index already compounds annual percent to prevent the error of adding annual percents. To move cost from some point in time to some other point in time, divide Index for year you want to move to by Index for year you want to move cost from, TO/FROM. Costs should be moved from/to midpoint of construction, the centroid of project cost. Indices posted here are at middle of year and can be interpolated between to get any other point in time.
Tables and Plots updated to Q4’22 2-6-23:
This Plot updated to Q3’23 11-15-23:
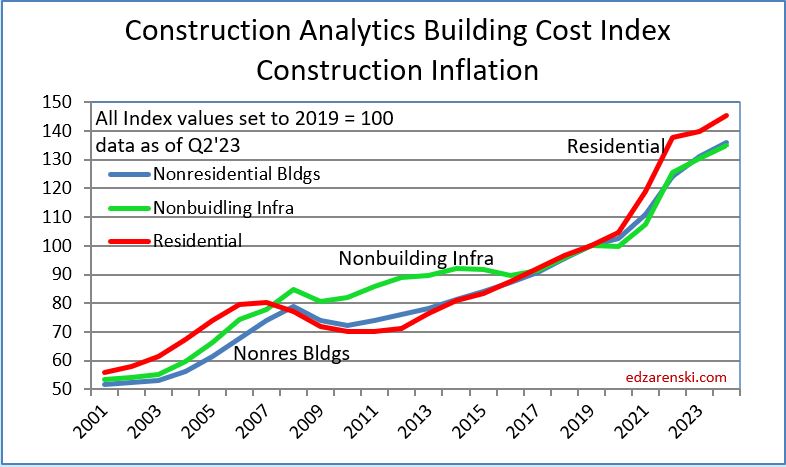
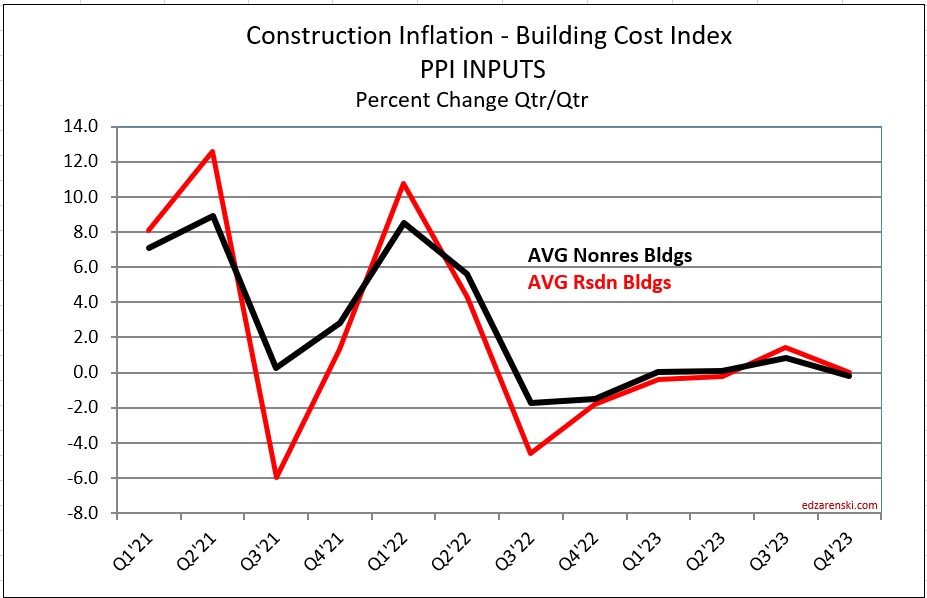
Plots below updated to Q4’23 1-12-24:
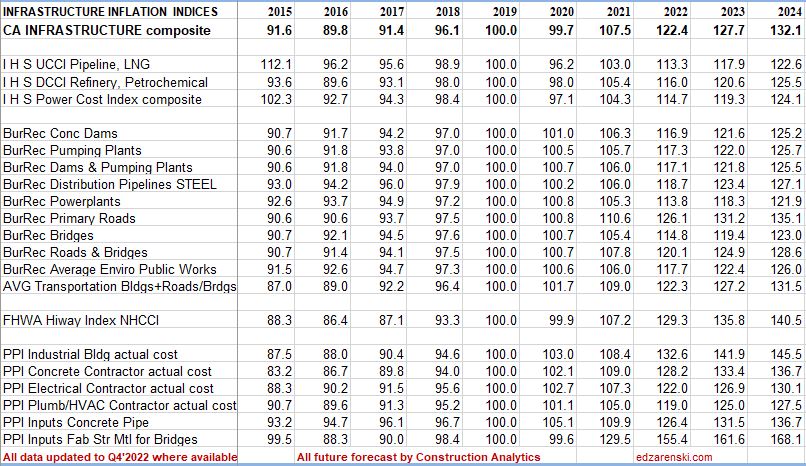
4-21-23 This table and plot is an extension of the tables and plots above. Data is as of Q4 2022, but the table covers from 1967 to 2000. Data is pretty sparse.

CBRE predicts nonres bldgs 2023 inflation at 6.5%. My analysis has it pegged at 5.7%. Pretty close.
LikeLike
In 2015 index for Nonres Bldg was 84, now 131. The increase is real.
LikeLike
Yes. But the safest way is to re-estimate the cost.
LikeLike
Hi Ed,
How are you estimating the 2023 (full year), 2024 and 2025 indices’ forecasts?
Thanks and regards,
Gregory
LikeLike
2023 is estimated based on movement in PPI final demand indices and in some part on mtrl movement and reading inputs from major industry reports. 2024 and 2025 are long term averages because there is no data and very little commentary.
LikeLike
Hi Ed,
I noticed that the CA NONRESIDENTIAL BLDGS index values changed compared to last year. For example, last year for year 2001 you posted a 52.2 value, whereas this year for the same year we have 51.6. What is the reason for these differences?
Thanks and regards,
Gregory
LikeLike
Sometimes it’s a revision at the source. Or it may be a revision on my part in calculation of labor or margins added to PPI materials inputs.
LikeLike
This article on construction inflation in 2023 by Ed Zarenski provides valuable insights into the factors contributing to rising construction costs. The comprehensive analysis of various components, such as labor, materials, and market conditions, offers a clear understanding of the challenges faced by the industry. The inclusion of data and projections adds credibility to the article. Ed Zarenski consistently delivers informative content on construction economics, and this article is no exception. Thank you for sharing this insightful piece!
LikeLike
Hi Ed: In your data and plots, is the 2022 column the last of the actual data as of December 2022, and the 2023 column a forecast through December?
LikeLike
In my data and plots, 2022 is the last of the actual data, now as of Feb 2023. The 2023 forecast is for the year. All future forecasts are by Construction Analytics.
LikeLike