Updates to Forecast, spending, starts, inflation, jobs
SEE ALSO Construction Analytics Outlook 2024
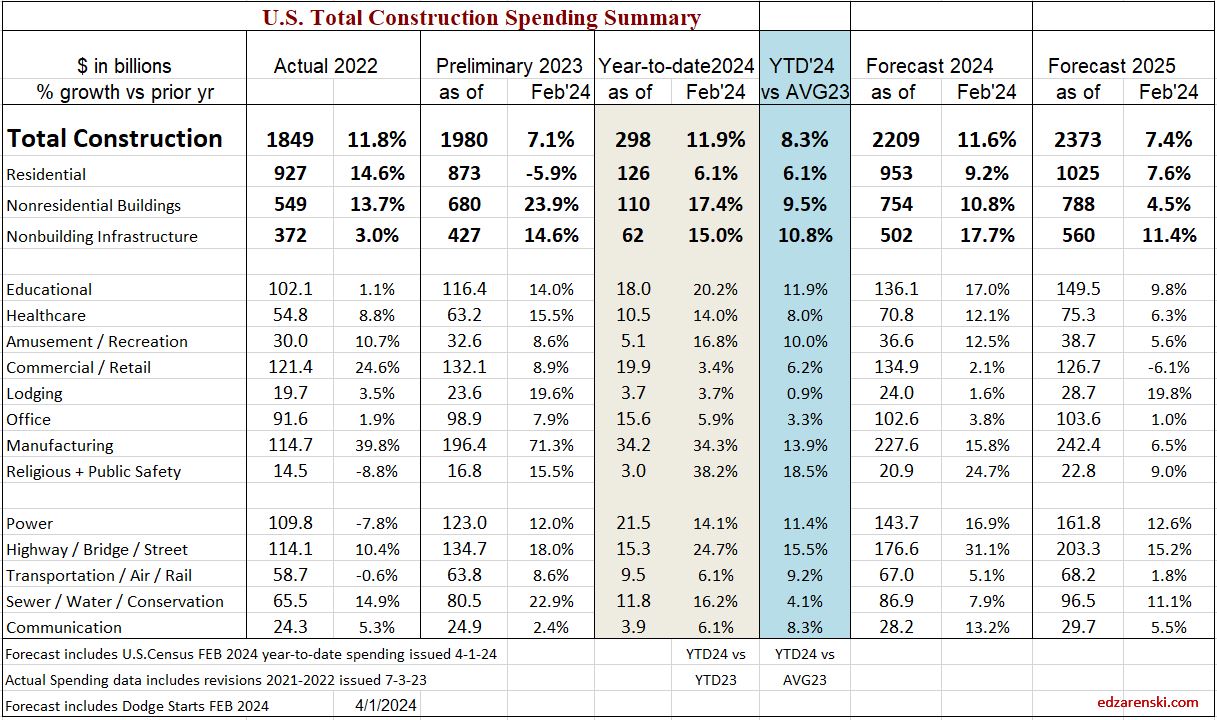
2024 construction spending will be measured to the avg of 2023, $1980 bil. The average Seasonally Adjusted Annual Rate (SAAR) for 2023 is the total spending for 2023. By Dec the SAAR was already 6% higher than the average for 2023. So we begin 2024 with Dec spending at a SAAR 6% above avg 2023.
As of Feb, the SAAR is 8.3% above 2023. Rsdn +6.1%, Nonres Bldgs +9.5%, Nonbldg +10.8%. If growth stalls here for the year, if we were to end the year with the SAAR unchanged from today, then we would finish with these gains for 2024. The trend in most cases is up, so I expect end of year we will be higher than today..
2024 construction spending, as of FEB, measured to the 2023 avg for Nonres Bldgs, is now +9.5% and trending up. The American Institute of Architects (AIA) Consensus for Nonres Bldgs averages +4%. Only one of the 10 forecasts for Nonres Bldgs spending in the AIA 2024 Consensus is still above the current reading.
The trend in Nonres Bldgs construction spending is up 17 of the last 18 months and continues up 9 of the 10 remaining months in 2024. To come close to most of the forecasts in the AIA, Nonres Bldgs spending for next 10 months of 2024 would need to decline drastically. To fall to the AIA Consensus average of +4% from the current SAAR, up +9.5%, all of the remaining 10 months of 2024 would need to fall from +9.5% to only +3% higher than 2023. Unless something sets off a recession, that will not happen.
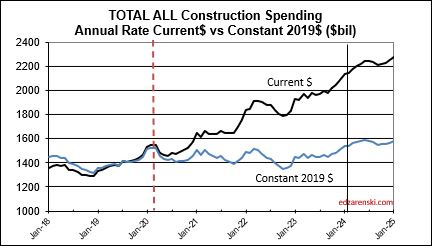
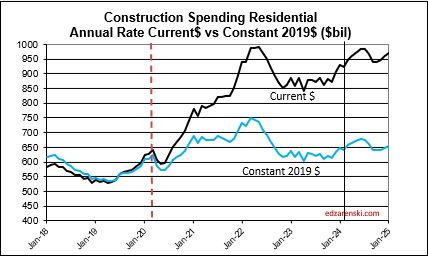
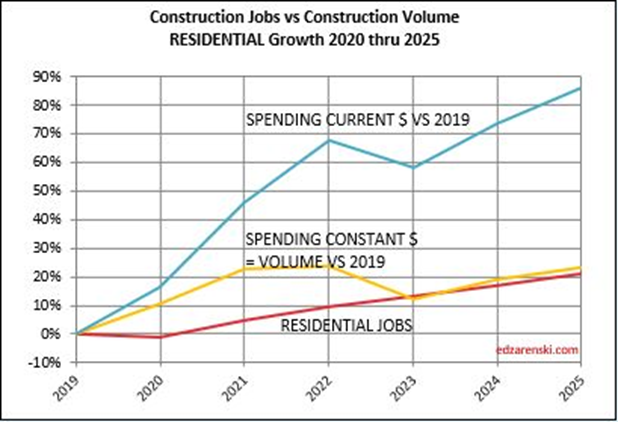
Since 2019, spending is up 42%. But after inflation Volume is up only 5%. Almost 90% of the spending growth since 2019 is inflation.

Construction Backlog, the amount of work under contract that is yet to be put-in-place, increased 9% to begin 2024. Nonres Bldgs and Nonbldg both increased over 11%. Although spending is at an all-time high, backlog increases if new starts exceed spending for the year. That could happen if spending decreased, but that is not the case here. It shouldn’t come as a surprise, but manufacturing construction backlog to begin 2024 is up 21%. Highway is up 15%. Environ Pub Works is up 14%.
Don’t try to correlate my Backlog calculation to the Associated Builders and Contractors (ABC) Backlog Indicator. They do not measure the same thing. ABC BI measures current backlog as a percent of previous fiscal year revenues, then multiplies that x12 to get what they refer to as the current remaining backlog months of support. I measure the backlog as the value under contract remaining to be completed at the start of this year compared to the backlog at the start of last year.
Neither of these give any indication of WHEN backlog gets spent. Backlog is never an indication of the amount of work to be completed in the given year. Some backlog gets spent over long duration projects that may go yet for several years.
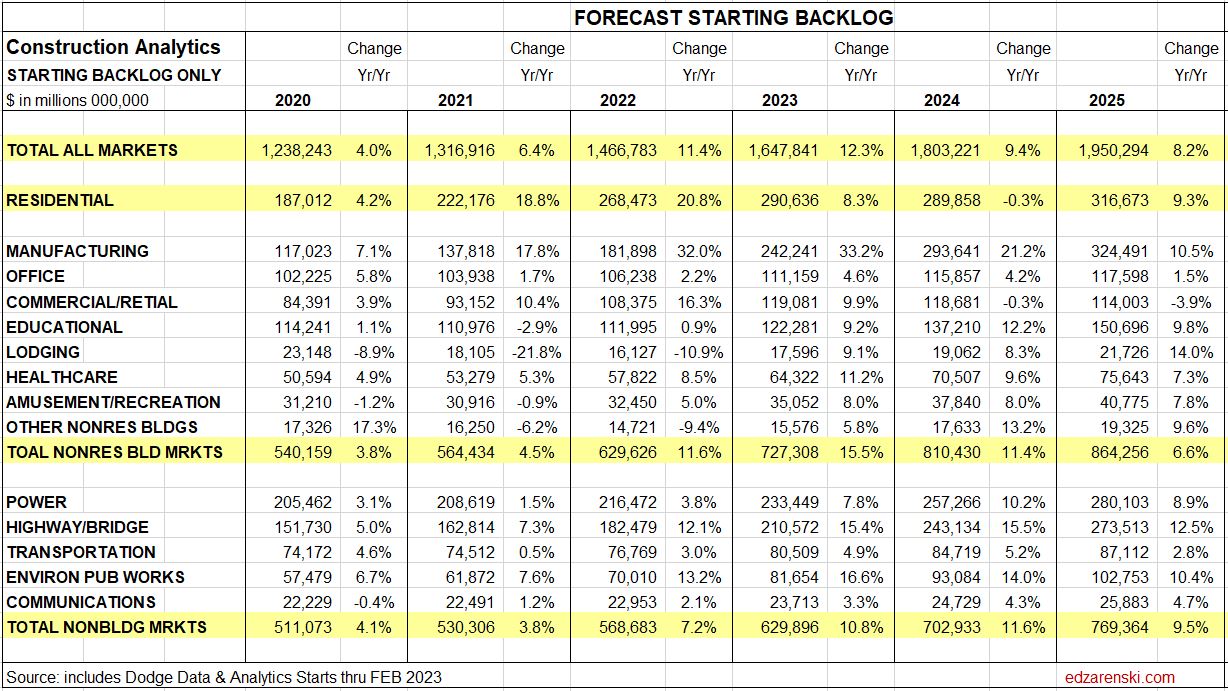


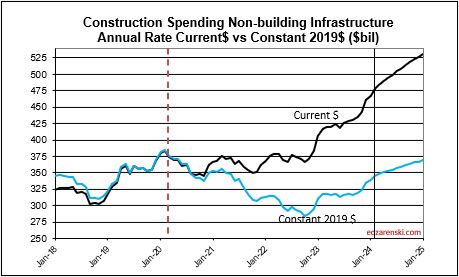
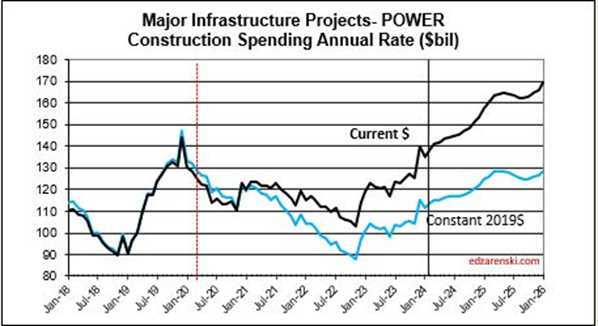
An avg spending curve for long-duration Non-bldg Infra is 15:30:30:20:5. The greatest spending impact does not show up until year two and three. Example: If 2024 posts $100bil in new starts for Infrastructure, only $15bil of that gets put-in-place in 2024. $30bil would get put-in-place in 2025 and 2026.
Manufacturing construction spending increased 80% in the last 18 months. After inflation volume increased 70%. Mnfg is 30% of all Nonres Bldgs spending, but generated 60% of the increase in Nonres Bldgs spending over the last 18 months.

In my forecast, every major sector ticks up each of next 3mo. All markets tick up each of Feb-Mar-Apr, except for Commercial/Retail. Warehouse starts, which comprise 60% of Comm/Rtl, fell 20% in 2023 and are forecast down 10%+ in 2024.

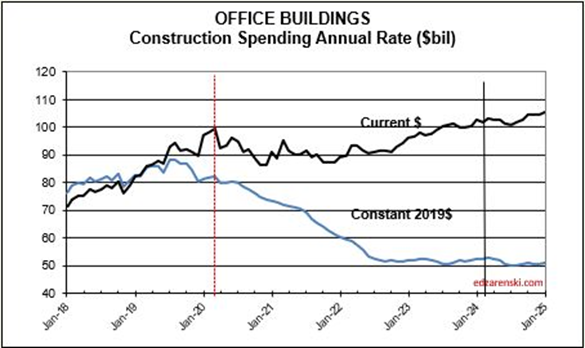
Looking at the Office Bldgs plot, keep in mind, the Office Bldg market includes Data Centers, where spending has increased.

In the past 18 months, Nonresidential Buildings construction spending increased 37%. Nonres Bldgs JOBS increased only 7%. Normally, this would be explained by inflation, but in this case after adjusting for inflation volume still increased 28%. 18 months, +28% volume, +7% jobs.
Jobs and volume of work should be moving together, evenly. The construction industry has been saying jobs shortages, and yet over an 18mo period, the nonresidential bldgs sector added 20% more volume of work than added jobs. Seems to me that would indicate that volume was absorbed by existing jobs.
In 2023 Nonresidential Building construction jobs increased 3.6%. In that same time Nonres Bldgs spending increased 24%. After inflation volume of business increased 17%. I wouldn’t be surprised if construction job openings remain elevated all through 2024.

Since 2016, construction spending has increased 63%, but after inflation, business volume increased only 1%/yr. From 2016 to 2023, jobs increased 2.5%/yr. Volume and jobs should be moving together.
In 2024, construction volume may increase 7%.
Construction Jobs increased every month since last Mar. In fact, there’s been only 2 down months in last 2 yrs. But in both Dec and Jan, avg hrs worked fell more than jobs added, so total hrs worked declined. Overall avg hrs worked for 2023 is up 4%. Volume is increasing.

