Home » Labor
Category Archives: Labor

Construction Volume Growth
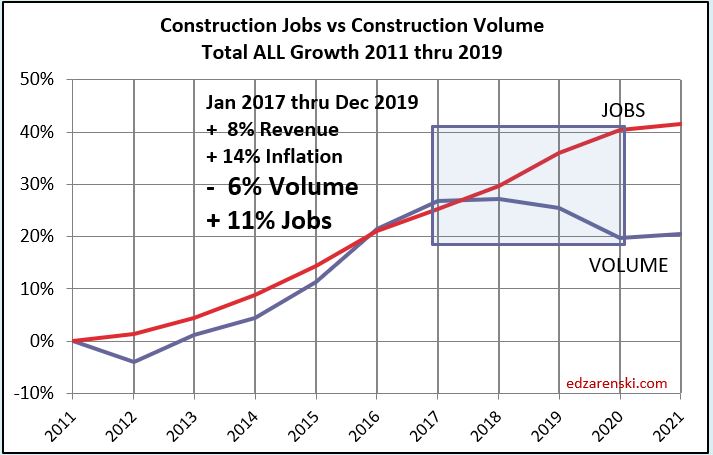
For the last three years 2017-2018-2019, construction spending increased 8%, but inflation was 14%. Volume DECREASED 6%. BUT Jobs increased 11%. This ought to leave some people concerned. In this plot of monthly data since 2015, the shaded box shows the period of concern, 2017-2019.

And average job openings was 70,000+ the last two years. The only other time a divergence like this has ever occurred is the years leading into the last recession.

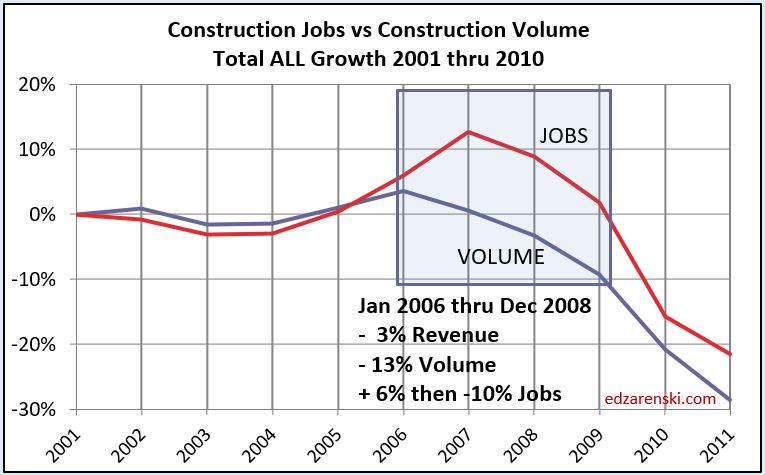
In 2004-2005-2006, spending increased 30%, but inflation was 28%. Volume increased only 2%. BUT Jobs increased 13%. And job openings increased 20,000/yr. After 15 years of near balanced growth, by the end of 2006 jobs growth exceeded volume growth by 15%. In the next 10 years that disparity never corrected.

We can reset the zero baseline to 2006 to see what has happened since 2006.
From 2007 through 2017, jobs and volume were balanced. Since then, the plot below for 2017-2019 looks exactly like 2004-2006 above. So this could raise concern, because,

if we have just experienced a period in which jobs and volume have been nearly in balance (2007-2016), then if the volume of work is no longer increasing, there is no support for adding jobs. Remember, we started this period with 15% excess jobs, but after 10 years, we swallowed that lump.
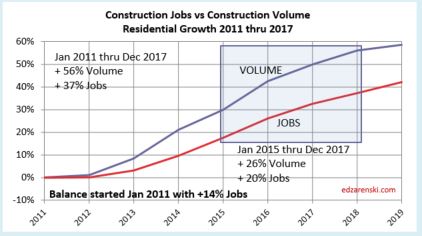
This plot is the same data as the first plot, only annually vs monthly. This plot of annual data since 2011 shows not much out-of-balance from 2011 to 2017. The shaded box shows the period of concern, 2017-2019.
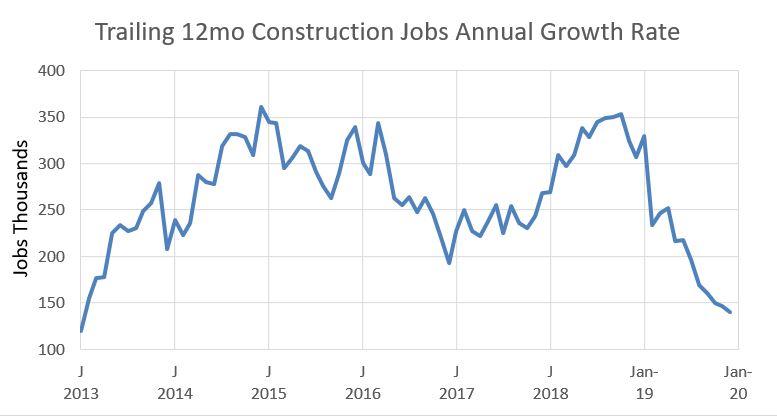
I had been predicting that jobs growth would slow and it has since Q4 2018. The plot below shows the average jobs growth rate for the preceding 12 months. The rate of jobs growth is now at a seven-year low. It could go lower. It probably should go lower, but nonresidential volume declines in 2020 while residential volume increases slightly, so there is a net growth. Non-building infrastructure work is expected to have strong spending and volume in the next two years due to years of backlog growth.

In almost 30 years of data, only six years are way out of balance, 2017-18-19 and 2004-05-06. Current data sure does not indicate there is a lot of construction work out there in need of additional workers. And if jobs are still growing, it certainly does not indicate there should be an increase in job openings, because volume is decreasing. In fact, by all measures, it should indicate job losses.
1-17-20 Job Openings dropped from a recent average near 350,000 to 214,000 in Nov.
The deficit created in the last three years, a 17% disparity in jobs vs volume growth, is similar to the 15% deficit in 2006, preceded by a long period of jobs and volume growth in balance, then going quickly and hugely out-of-balance. That has major implications for labor cost inflation and productivity which could affect schedules, and that’s not the kind of inflation easily tracked in wages. But it’s real.
SEE ALSO
2020 Construction Spending Increases, but Volume is Down
Expect Construction Jobs Growth to Slow in 2020
To Support Construction Jobs, We Need Volume

To Support Construction Jobs, We Need Volume
11-2-19
12-6-19 plots updated to include Nov jobs and Oct spending.
Construction Spending IS NOT Construction Volume.
I read an analyst report this week that stated construction jobs growth isn’t keeping pace with construction volume growth. The reference appeared to be to construction spending. That fails to apply inflation to convert construction spending to construction volume, so compares apples to oranges. Spending must be adjusted for inflation to get real volume growth. Jobs MUST be compared to volume.
For over two years now, construction volume growth has not supported construction jobs growth we’ve seen. I expected jobs growth to slow down. I’ve been saying this for over a year. This sure looks like it.
For 2018 jobs growth averaged over 300k. Since January 2019 the rate of jobs growth has dropped from 300k to 150k.
Current projected new starts data IS NOT supporting construction volume growth for the next 2 yrs. Growth of 3%/yr in non-building infrastructure will be offset by declines in residential buildings and flat nonresidential buildings. Therefore, there is no real volume support for jobs growth.
This plot adjusts construction spending by taking out inflation to get real construction volume growth. Last year of real volume growth was 2016. Yet jobs continue to climb. This can’t continue. The plot above shows it has slowed.

Construction jobs growth has slowed considerably over last 2Q, as expected. While construction jobs are up about +150k in last year, jobs (through Nov) increased only +48k in the last 7 months. I’m expecting this trend to continue. In fact, I wouldn’t be the least bit surprised to see in the near future some months when construction jobs decline. The fact is, construction volume simply does not support jobs growth.
Total construction volume, spending after accounting for inflation, has been down for 5 of the last 6 quarters. Volume peaked from Q1 2017 to Q1 2018, but the last year of real volume growth was 2016. Volume is flat or down while jobs continue to rise. This can only mean contractors will be at risk of being top-heavy jobs if a downturn comes.
Caution is advised if putting emphasis on construction JOLTS, which has been climbing to new highs. From mid-2006 to mid-2007, JOLTS reached near the then all-time high. But construction volume, starting in mid-2006, was already on the downward slope. Volume peaked in early 2006 and fell 10% by mid-2007. Construction did not begin shedding jobs until late 2006, but mid-2007, job losses were well underway. Within 12 months, more than 500,000 jobs were gone. Within 18 months, construction jobs were down 1.5 million.
Construction spending annual rate will increase by 3% in the next 12 months, but volume in constant $ after inflation will remain flat. In Q42020-Q12021 spending slows to less than inflation, so volume begins a modest decline. Growth of 3%/yr in non-building infrastructure will be offset by declines in residential buildings and flat nonresidential buildings. Jobs will continue to grow and spread the imbalance even more.
The construction jobs slow down has been in the cards for a long time. With all the talk of skilled labor shortages, there’s been little discussion of the unsustainable excess jobs growth. Maybe it’s about time to change the conversation.
Spending Revisions 9-3-19. Nonresidential Increases. Residential Slows.
Census Construction Spending released today revises data back to Jan 2013. 2018 spending was revised up by $13bil or 1% to $1.307 trillion. I expected upward revisions to 2018 residential that did NOT materialize. Almost all revision is to nonresidential.
Sizable upward revisions were posted to nonresidential buildings and non-building infrastructure for 2015, 2016 and 2017. Educational increased by $5.5bil in 2017 and Manufacturing by $4.3bil. Manufacturing also increased in 2015 and 2016. Power increased by 8%-10% in both 2015 and 2016 but decreased by 8% in 2018.

Nonresidential revisions added $15 to $20 billion in 2015, 2016 and 2017. This helps explain what would be excess growth in labor over this period, absorbing about 100,000 jobs.
It is unusual there were no sizable revisions to residential, the first I can ever remember there being no revisions to residential spending totals. It is not uncommon to see $10-$15 billion/year revisions to past years in residential. In this release, there were no annual revisions greater than $1 billion. However, for 2018, renovations was revised down by $4bil and single-family up by the same $4bil. I wouldn’t be surprised if all years 2013-2018 get revised next year. Typical annual revision is about +2.5%.
Biggest 2018 revisions: Commercial +$6bil, +6.6%; Educational +$3.5bil, +3.7%; Amusement/Rec +$1.5bil, +5.3%; Power -$7bil, -7%; Sewage $1.9bil, +8.5%; Water Supply +$1.5bil, +10.8%; Manufacturing +$5.6bil, +8.7%.
Biggest 2017 revisions: Educational +$5bil, +6%; Amusement/Rec +$1.7bil, +6.8%; Manufacturing +$4.3bil, +6.5%. Public Works +$5bil, +13%.
After revisions, 2018 construction spending growth was up (2.7% to 4.4%) in all sectors but still less than the increase in inflation (4% to 5%), so real market activity declined in all sectors. Average spending for 2018 was up 3.3%, but average construction inflation in 2018 was 4.8%, so real volume decreased by 1.6%.
Real market growth declined in all three major market sectors, Residential, Nonresidential Buildings and Non-building Infrastructure, however, performance varies by market. For example, in the Nonresidential Buildings sector, Educational, Healthcare and Manufacturing markets (almost 50% of the Nonres Bldgs sector) spending increased only 1% or less. With an average Nonres Bldgs Inflation rate of 5.1%, real volume in these three markets declined 4% to 5%. But Lodging, Office and Commercial markets spending increased 8% to 10%. After subtracting 5.1% inflation, real volume in these markets increased 3% to 5%.
For the Nonresidential Buildings sector, spending in 2018 increased by 4.4%, but nonres bldgs average inflation was 5.1% (i.e., Construction Analytics 5.1%, Turner 5.6%, RLB 4.6%, Mortenson 7.4%, PPI Bldgs 4.0% ). On average, nonres bldgs real volume in 2018 declined by 0.7%.
For the Residential Buildings sector, spending in 2018 increased by 2.7%, but res bldgs average inflation was 4.3%. On average, residential bldgs real volume in 2018 declined by 1.6%.
For the Non-building Infrastructure sector, spending in 2018 increased by 2.7%, but non-bldg infra average inflation was 5.6% (i.e., Highway 6.7%. Powerplants 3.2%, Pipelines 2.1%). On average, non-building infrastructure real volume in 2018 declined by 1.6%.
In 5 years from Jan 2011 through Dec 2015, total construction spending increased 40% but after inflation volume increased only 22%. Jobs adjusted for hours worked increased 21%, almost in balance. However, in the following 3 years from Jan 2016 through Dec 2018, spending increased 16%, but after 13% inflation, volume increased only 3%. Jobs adjusted for hours worked increased 12% during that 3-year period. Starting 2011, jobs exceeded work volume. At the end of 2018, the jobs/work volume imbalance was even greater.

Residential spending 2018 did get some monthly revisions, but the total was NOT revised up and unusual monthly variances were not revised away. This leaves 2018 with four months in which the spending varied from the statistical monthly average by more than 3 Std Dev. There are no other years outside of the 2006-2009 residential recession in which there were ANY monthly variances from statistical average reaching 3 Std Dev. For 60 months 2013-2017 the largest variance was 1.8 Std Dev.
Residential construction spending in 2018 looks more like the 2006-2009 recession than any growth years from 2001 to 2019. After the Feb 2018 high, spending declined in seven of the next ten months, then in 2019 declined in four of the next six months.
Residential construction spending declined in the last five consecutive quarters. The most recent quarter averaged $510 billion. The post-recession high was reached in Q1 2018 at $575 billion. Q2 2019 is down 10% from Q1 2018. July 2019 is down 12% from the Feb 2018 high.
Residential spending is forecast to increase through the end of 2019 but then is expected to decline in the 1st half 2020. The low by mid 2020 could match the current low of $510 billion. That would result in 7 out of 9 declining quarters.
Census doesn’t show the Renovations line item. Reno = (Total Rsdn minus SF+MF) is where the biggest residential declines occurred in 2018, down -$4bil, -2.3%. Residential Reno is down 13% in 2019 YTD.

Construction Jobs and JOLTS
6-16-19
8-15-19 edits – added plots
In early 2007, residential construction volume had already dropped 20% and total construction volume was down 10%, (the annual averages would not show this dramatic drop but a monthly plot would), yet construction job openings and labor turnover survey (JOLTS) was peaking at a 6 year high. From Jan 2007 to Jan 2008, construction had already lost 250,000 jobs. All of that was in residential construction. At the time, nonresidential construction was still growing.
Nonresidential buildings volume would peak in late 2008 and non-building infrastructure peaked in early 2009. By that time, in Q1 2009, residential volume was down 60%. Even though nonresidential construction was peaking, total construction was down 25%.
In 2008 construction jobs declined by another 500,000, about 90% residential jobs. JOLTS dropped to half of the 2007 peak high. It was over the next year or so that all construction began to decline, jobs would drop in all sectors and JOLTS would plummet to an all-time low.
The point is this: The construction recession began with the decline of residential construction in 2006-2007, at a time when JOLTS was at a 6-year high. Jobs declines lagged the decline in real construction volume (the annual average plot shows this well).
It is remarkable how residential construction volume from the Q1 2006 peak to Q1 2007 had dropped 20% but residential jobs increased by 6%. JOLTS was peaking at a 6 year high. Although total construction jobs increased in 2006, jobs started to decline in the 2nd half 2006 and would drop 200,000 in 2007. JOLTS continued to show job openings increasing from mid-2006 to mid-2007. Neither jobs growth nor JOLTS reflected what was occurring in real construction volume and certainly did not give any leading indication of what was on the horizon.
The AGC survey of contractors has been reporting difficulty hiring construction labor every year since 2012. Yet from May 2012 through May 2019, construction added 1,870,000 jobs, an increase of 33%, the 2nd strongest jobs growth period ever recorded, not far behind 1993-99 when jobs and volume grew equally (JOLTS was not tracked before 2000). In the four years 2003-2006, just prior to the great recession we added 1 million jobs and volume growth kept up with jobs for the first three years, but then the residential recession started and volume began to plunge. However, JOLTS increased from 2003-2007. These three periods mark the best periods of jobs growth in the last 30 years.
During the last seven years, unlike 1993-99 or 2003-05, when jobs and volume grew equally, construction volume (spending minus inflation) increased by only 22%, far less than the 33% jobs growth. While contractors continue to report difficulty filling jobs, the pace of jobs growth is near an all-time high and is out-pacing the growth in volume of work to support those jobs. JOLTS increased every year during this period.
Now fast forward to 2019. Construction spending growth for the previous two years, 2017 + 2018, increased 4.5% + 5.0%. But inflation during this period was 4.4% + 4.8%. Real construction volume for the last two years increased less than 1%. But jobs increased by nearly 8% and JOLTS more than doubled from 2016 to the end of 2018.
This is a real head-scratcher. Volume has not increased for two years, yet jobs are up 8% and the indicator for job openings is increasing. This is not at all what the data should be showing.
In fact, from the 2006-2007 pre-recession peak until now, non-supervisory jobs have recovered to within 7% of the previous high, but construction volume is still 18% below the previous peak. Total all construction jobs is only 3% lower than the pre-recession high.
Just as the data showed in 2007, the data at the start of 2019 shows that we are top-heavy construction jobs that are not supported by real growth in construction volume.
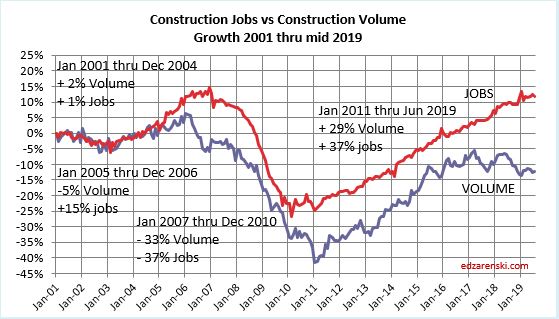
8-3-19 > added plot > Plot below shows the same data as the above two plots, only plotted monthly, with all data from 2001 thru 2019 on one plot. From 1991 to 2000, jobs vs volume disparity was only 1%. This plot sets Jan 2001 to zero baseline for both jobs and volume. By Dec 2006 the disparity was 20%. This plot shows construction jobs growth vs volume growth now has a wider disparity than Jan 2007 when we were leading into the Great Recession. By far, the largest portion of this growing disparity is residential. In the last 24 months residential volume has decreased by 12% but residential jobs have increased by 7%. To be fair, that doesn’t include some nonresidential jobs that were actually doing residential work.
Construction volume, (spending inflation adjusted to constant $ volume) hit a 3-year low in Dec-Jan.
8-3-19 > added 12 month trailing jobs plot. Jobs growth rate, although showing some minor up months, has been declining since Q3 2018. As of July 2019, the 12 month trailing total of new construction jobs has dropped almost 50% in 9 months. If we maintain the current rate of jobs growth (avg 15k/mo in 2019), within the next three months we will hit a six-year low. I’m expecting growth to slow, so we may hit that six-year low next month, in the August data.

With construction spending in 2019 predicted up only 2%, and forecasting 4.5% construction inflation for 2019, real volume for 2019 will be down 2.5%. Jobs thru April are already up 1.2% year-to-date. So the gap is widening.
We are in the third year of no increase in construction volume. But jobs have continued to grow and JOLTS is at an all-time high. These data sets should not occur at the same time. But this is exactly what occurred prior to the great recession after which we experienced a devastating drop in jobs. However, compared to the construction volume measured by inflation adjusted spending, both the changes in jobs and the JOLTS indicator of job openings seemed to lag real activity by about a year.
Even if we do not experience a construction recession similar to 2008-2011, the current situation may be signaling that we could experience a jobs correction with the slightest downturn. If a jobs correction does not materialize then we are headed for a period in which we will solidify the highest ratio of jobs per volume of work put-in-place as measured in the last 50 years.

See also these articles:
Construction Volume vs Jobs 2017-2018
Construction JOLTS – What’s wrong with this picture?
7-10-18
In the 24 months from May 2016 to May 2018, Construction Volume went up 3.0%. Jobs went UP by 8%, 500,000 jobs. Spending in that 24 month span increased by just over 12%, but inflation for that period across all construction averaged 9%, hence real volume increased only 3%. That’s a $35 billion increase in volume, enough new work to support 175,000 to 210,000 new construction jobs.
JOLTS (Job Openings and Labor Turnover Survey) job openings went up from 2.4% to 3.0%, up 50,000 openings. Jobs growth exceeded volume growth by more than double and yet job openings went up!
Not only did jobs growth of near 8% far exceed that needed to support the growth in new work, but also, because jobs growth was so strong, it should have reduced job openings.
What’s wrong with this picture?

Pretty obvious the numbers just don’t add up. First, since construction spending is always later revised up, in recent years by 2%, let’s be generous and assume spending will get revised up by 2%, and let’s keep inflation the same. That would result in a 5% increase in volume or closer to $60 billion in volume. That would support 300,000 to 360,000 new jobs, a need still well below the actual growth in jobs of 500,000.
No matter how we look at it, even generously supposing spending will later increase by 2%, jobs have increased greater than volume of work.
Companies predict job openings based on positions they need to fill within 30 days. But, what if their judgement of positions they need to fill is determined based on what they anticipate from increases in revenue, without taking inflation into consideration. Since revenue also includes inflation, which adds nothing to business volume, that would overestimate the need for new jobs. We’ve seen this before, in the last expansion.
2003-2006 construction spending increased by 35%, the most rapid increase in spending in over 30 years. But construction inflation during that four year period totaled over 30%, the most for four consecutive years dating back to 1978-1981. After adjusting for inflation real volume in 2003-2006 was up by less than 5%. Considering how high spending was and how much it felt like growth, there was surprisingly little. That did not hold back jobs expansion.
Construction firms added 15% to jobs, or 1,000,000 jobs during this period, more than 3x the actual need. Job Openings in the JOLTS report increased 100%+, from 100,000 to over 200,000. Firms hired far more than needed and kept increasing the report of job openings, even though they had already hired far more than required. In 2006, housing starts dropped 15%, residential spending dropped 25%, but residential jobs still increased by 6%. From 2003 to 2006, spending on nonresidential buildings increased by 20%, all of it inflation. Volume remained stagnant these four years, however jobs increased by 10%.
Clearly the increases in jobs during this period correlate more with spending than real inflation adjusted volume growth. This four-year period registered the largest productivity decline in over 30 years because the rate of jobs growth was much faster than volume growth.
For 2018-2019-2020, construction spending is currently forecast to increase 6.7%, 3.0% and 4.2%. But after adjusting for inflation, real construction volume is predicted to increase only in 2018 by about 2%. For 2019-2020 volume declines or remains flat.
An argument could be made that JOLTS openings is dependent on firms outlook for growth in the near future. For that, let’s look at predicted volume growth in 2nd half 2018 and in 1st half 2019. It is predicted spending will increase 1.5% in the 2nd half vs 1st half 2018. But adjusted for inflation, volume will decline by 1%. Likewise, for the 1st half 2019, although spending will increase, inflation will outpace spending and real volume will decline 1%. There is nothing in past data or forecast that would support an increase in forecast job openings.
See also What Jobs Shortage? 7-6-18 for related info.
Could it be that some firms are anticipating job needs based on spending, not on volume? Could it be that these firms are not adjusting revenues for inflation to get volume before using the data to prepare a business plan? This is not entirely anecdotal. In several presentations I’ve given over the years I’ve asked the audience, How many of you plan your business needs on your revenue? In a show of hands at a presentation to NHAGC, a large portion of the audience raised their hand.
If your construction company revenues are up 6% in a year when inflation is 5%, then your net volume is up only 1%. Your company jobs growth required is only 1%.
You cannot ignore the impact of inflation when forecasting jobs need.

What Jobs Shortage?
7-6-18
Jobs report for June issued this morning. Construction Jobs are up slightly. But the real story is in the last year of growth. Jobs are up 282,000 since June 2017. All across the industry, pundits are screaming jobs shortage. But is there one?
The current spending growth has 2018 on a path to reach an increase of near 8% in spending. But that is not volume. Most of that is INFLATION and that ADDS NO VOLUME. Inflation in 2018 is predicted (already in the spending numbers) to come in about 5% to 6%. Volume is spending minus inflation. Volume in 2018 forecast 2%-3%. Jobs are up 4% since June 2017.
Jobs growth of 4% when net volume is increasing only 2%-3% shows jobs growth in excess of volume. In 2017, jobs increased 3.4% against spending growth of 4.5%. But ALL of the spending growth was inflation, so net volume was 0%. So jobs growth has outpaced volume growth for the last two years by 5%.
See also Construction JOLTS – What’s wrong with this picture? 7-10-18 for related info.
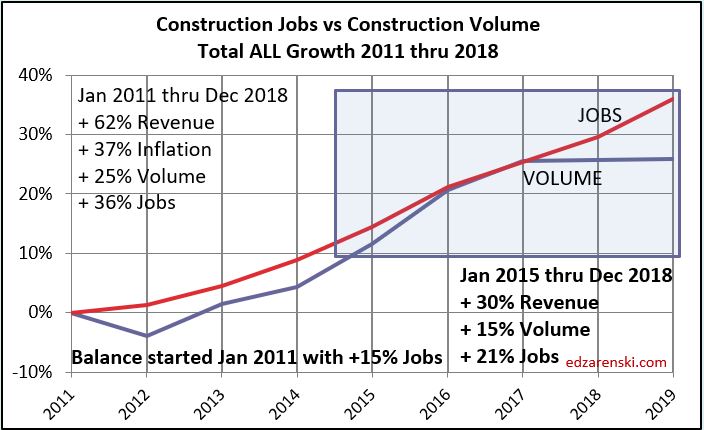
This plot sets the plot lines to zero starting at Jan 1, 2011 so the growth from the bottom of the recession can be visualized. We started Jan 2011 with an excess of jobs.
The plot below shows from Jan 2005 through Dec 2010, volume had dropped 15% more than jobs. So we started the recovery in 2011 with excess jobs compared to 2005.

When we look into the three major sectors, the numbers show shortages in residential and job excesses in nonresidential building and nonresidential infrastructure.
You can read much more detail on this in several other articles I’ve written. See this link Construction Jobs 3-8-18 for an article that includes all links to previous articles on the Jobs/Workload imbalance, has an explanation of how some residential jobs are counted in nonresidential and shows the volume/jobs plots for residential and nonresidential.
Residential construction jobs currently total 2,817,000. That’s 83% of the peak jobs year, 2006, which averaged 3,405,000 jobs. Volume of residential work, after adjusting spending for inflation, peaked in Q1 2006 at $780 billion. Volume in the 1st five months of 2018 averaged only $540 billion, only 69% of peak volume. Since the peak in 2006, residential jobs are at 83% of peak, but volume is only at 69% of peak. If we look only at growth since the bottom in Q1 2011, residential jobs have not kept up with volume growth. However, jobs have increase far more than volume compared to the previous peak.
Nonresidential building construction jobs currently total 3,388,000. That’s 99.7% of the peak jobs year, 2007, which averaged 3,397,000 jobs. Volume of nonresidential buildings work, after adjusting spending for inflation, peaked around Q42007-Q12008 at $530 billion. Volume in the 1st five months of 2018 averaged only $420 billion, only 79% of peak volume. Since the peak, non residential buildings jobs have returned to previous levels, but volume is only at 79% of peak. Nonresidential buildings jobs, whether we look at just from the 2011 bottom or we compare since the 2007-2008 peak have increased far more than volume.
The following link shows the jobs vs volume plots for residential and nonresidential.
Much more on this topic Construction Jobs
The AGC survey of contractors has been reporting difficulty hiring construction labor every year since 2012. Yet from June 2012 through June 2018 construction has added 1.5 million jobs, the 2nd strongest jobs growth ever recorded. It is 2nd to 1994-1999, the strongest construction expansion on record. We are currently in the 2nd strongest expansion, about equal to 1994-1999, but substantially stronger than 2000-2005.
AGC Aug 2018 survey >Eighty percent of contractors report difficulty finding qualified craft workers in latest AGC workforce survey: https://www.agc.org/news/2018/08/29/eighty-percent-contractors-report-difficulty-finding-qualified-craft-workers-

Construction Overtime – A Common Miscalculation
4-7-18
Construction Overtime – A Common Miscalculation
You never get full production out of all overtime hours worked. A common miscalculation when applying overtime overlooks productivity losses.
Let’s say we have a project that has 100 manweeks of productive work (100mw x 40hrs = 4000 manhours) remaining on the schedule to completion, but that we absolutely must finish the job is less time. Also, let’s say we modify the work week from 5 days 8 hours = 40 hours/wk to Overtime (OT) 6 days 10 hours = 60 hours/wk. A simple calculation indicates that if we add 50% more hours per week (60hrs vs 40hrs), we could finish the job in 1/3 less time.
- Original plan = 4000 manhours / 40 hrs/week/man = 100 manweeks
- Revised plan = 4000 manhours / 60 hrs/week/man = 67 OT manweeks
- Time saved = (100–67)/100 =33/100= 33% time saved, 33 mwks saved
- Cost added would be +20%. See example of cost calculation below.
But, unfortunately, that would not be correct. That would have to assume no OT productivity losses. You won’t get 60 productive hours out of a man in a 6-10s 60-hour OT workweek. You will get only 50 productive hours.
Productivity loss graphic from Applied Cost Engineering, Clark and Lorenzoni, Marcel Dekker, Inc., 1985.
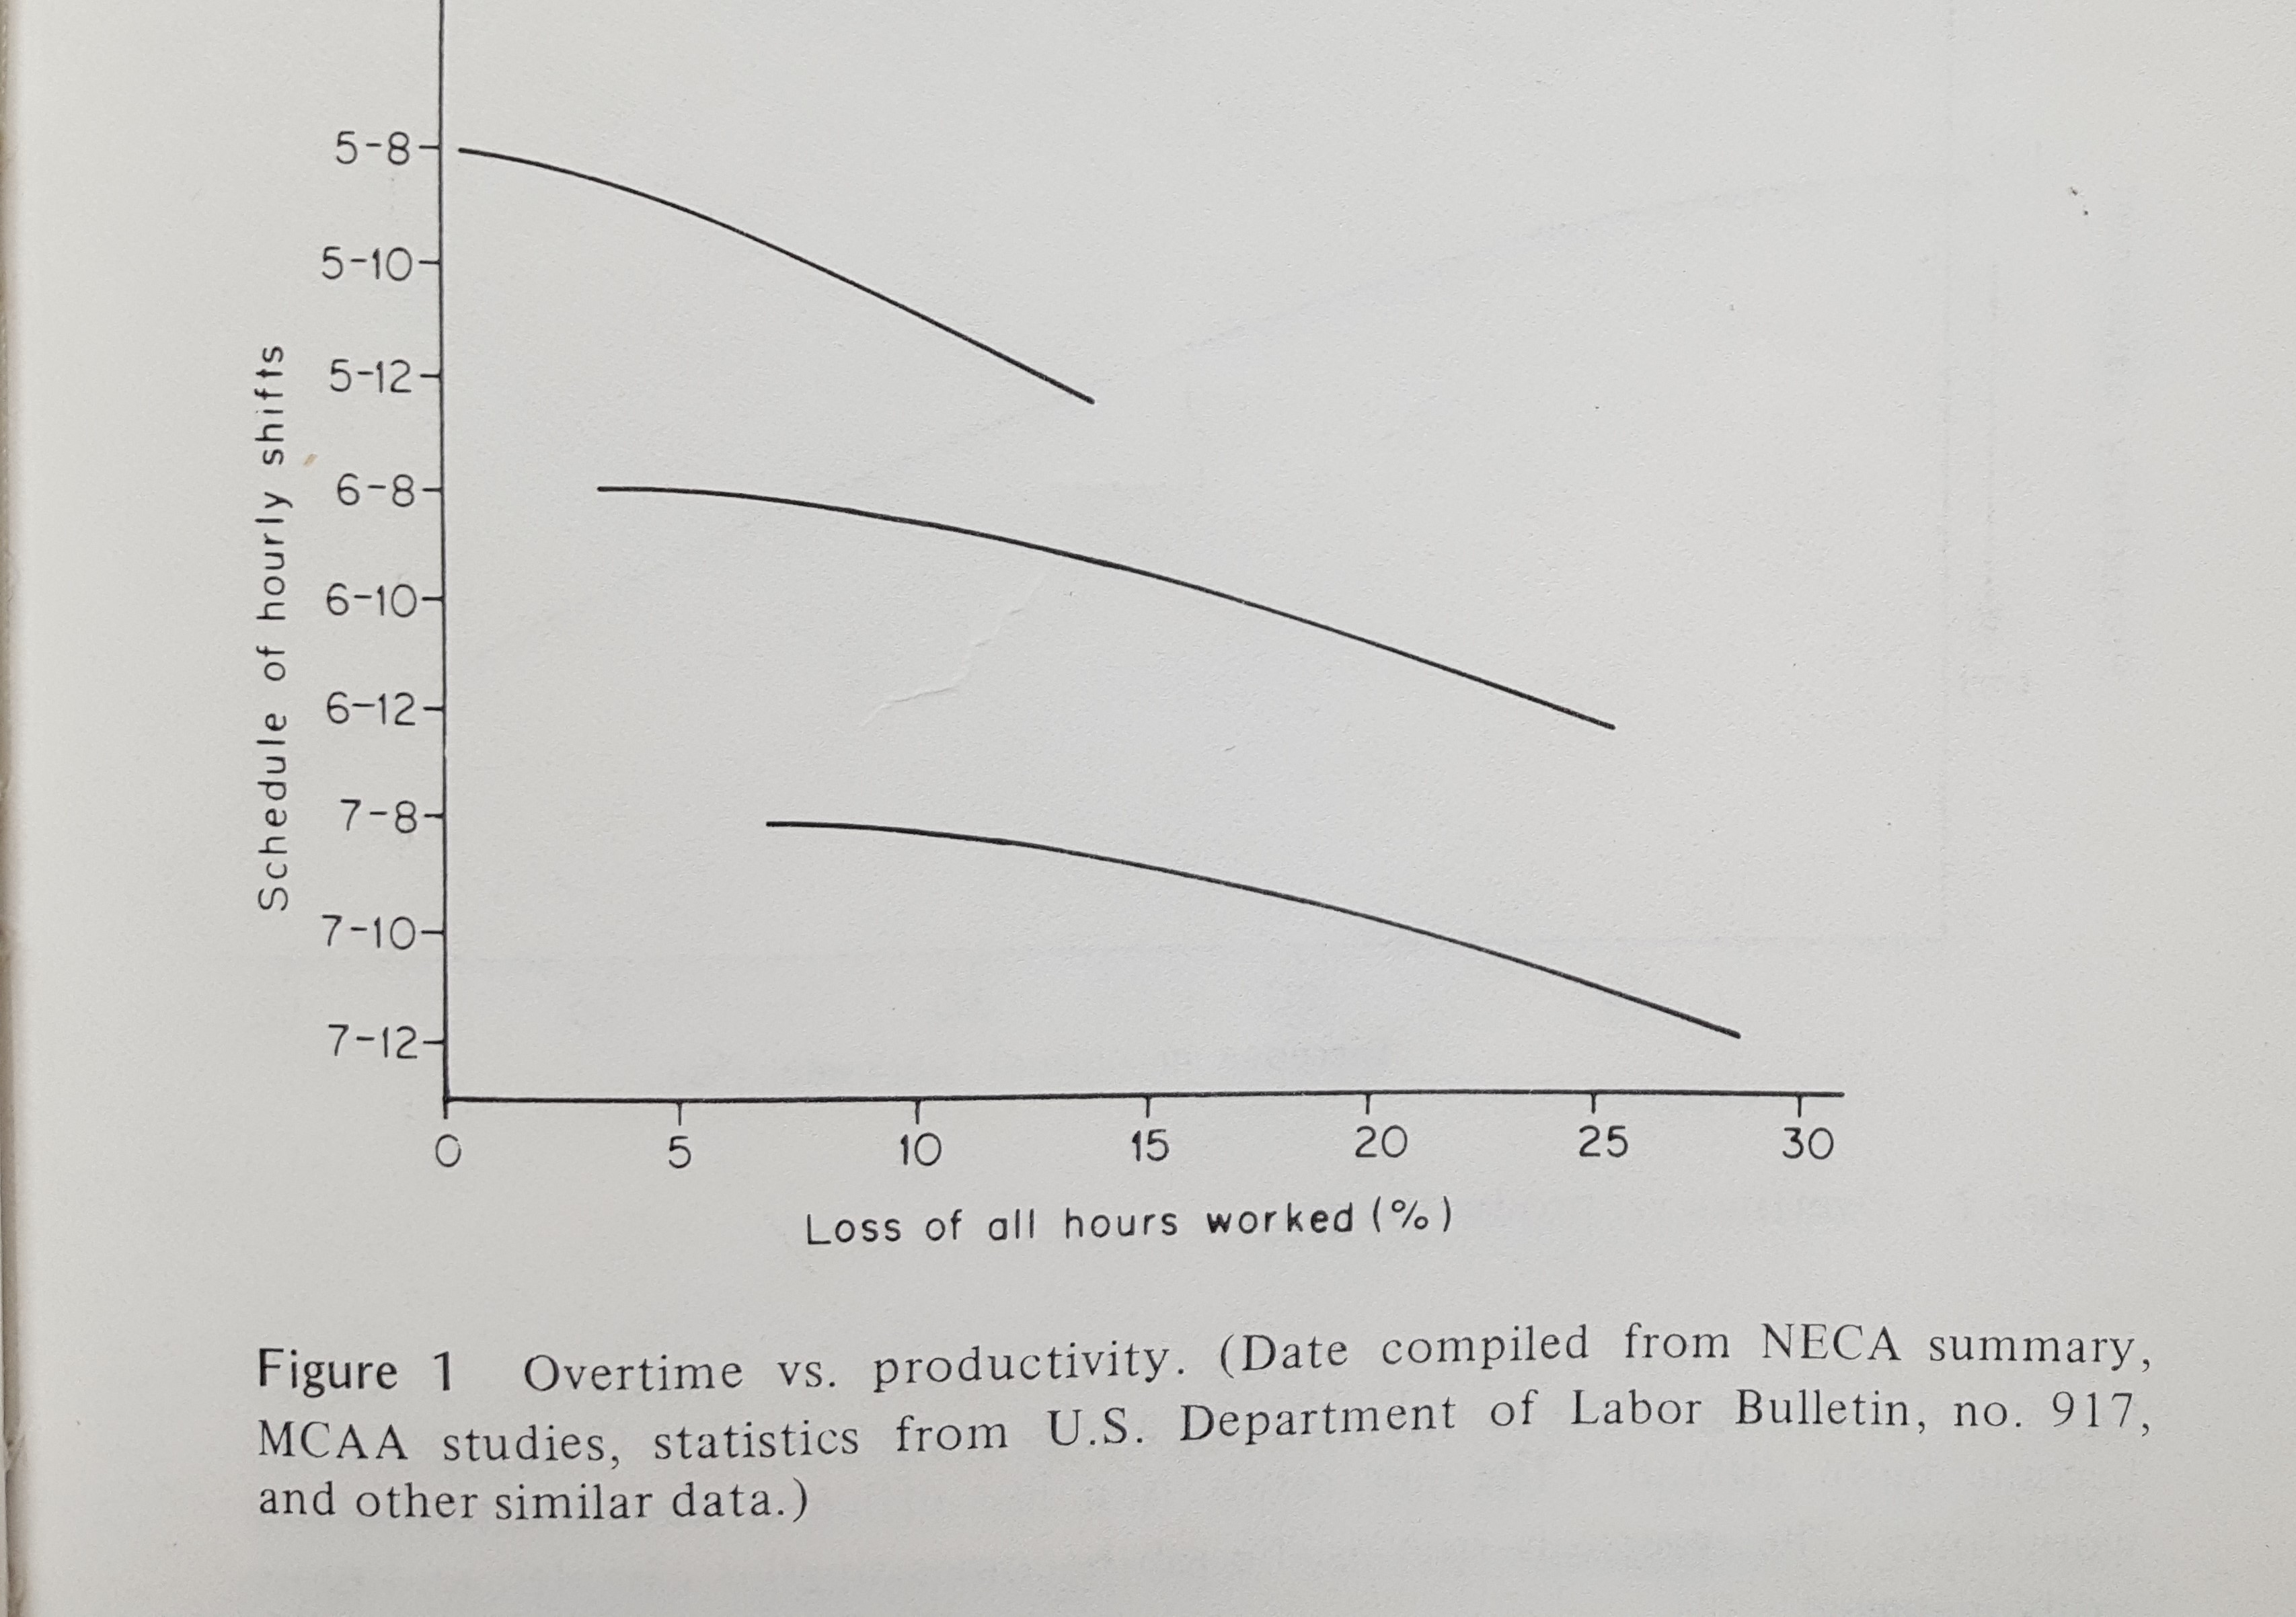
Yes, you still pay for all hours and the man is still on the job for 60 hours, but work progress slows as workers are kept on the job for longer periods. So how much time would be saved on the schedule?
Revised plan productivity 4000 manhours work / 50 productive hrs per week per man = 80 OT manweeks to completion.
Time saved = (100 – 80) / 100 = 20/100 = 20% time reduction or 20 mwks saved, not 33.
What did we get from this application of overtime compared to the original?
- 20 mnwks LESS of normal 40hrs =20×40= 800hrs less at normal 1x rate
- 80 mnwks at 20hrs/wk at OT, 1.5x rate =80×20= 1600hrs more at 1.5x rate
- Net cost 1600 x 1.5 – 800 x 1 = 1600 equivalent extra cost hrs over base 4000.
- Time saved (100-80)/100 = 20%
- Cost increased 1600/4000 = 40%
This simple example shows the full hourly time savings is not realized due to lost productivity plus many of the hours worked are at a higher cost. Though the initial basic OT estimate forecast 33% time saved at 20% extra cost, that scenario actually saved only 20% time and added 40% cost, double the initial budget.
If this was initially a 30 month project, with approximately 35% of the cost in labor, then overtime saved 6 months time, but added 15% inflation to the total cost.
There’s a significant difference in the original un-adjusted OT estimate of time/cost versus the OT time/cost analysis for nonproductive hours. That would be a serious mistake in estimating and could have serious cost implications against the budget.
This will vary with the OT scenario selected or any other data set used, but generally the more days and longer hours worked, the higher the extra cost ratio. Of course, a better way to accomplish a tightened schedule might be to add a second shift rather than work men longer hours. However, in times of restricted labor supply that might not be feasible.
See this blog post for OT productivity loss rates Overtime Isn’t Always What It Seems – Lost Productivity Construction

Construction Jobs
3-8-18
What data are analysts comparing to show construction jobs shortages?
There are numerous articles circulating in the industry regarding the difficult growth of construction jobs. Some compare the percent growth in jobs to the percent growth in construction spending, often citing that spending has increased far more than jobs.
Well yes, that’s true. BUT…
In the 5 years 2013-2017 jobs increased by 1.3mil or 23%. Spending increased by 45%. The industry, for 5 years, has been saying it is difficult to find skilled workers to fill jobs. And yet total construction jobs added in last 5 yrs = 1.3 million, near all-time high growth.
Only 3 times since 1970 have 5-year jobs totals increased by more than the most recent 5-year period 2013-2017. All of the top jobs growth occurred between 1994-2000.
Only 5 times has 3-year jobs growth exceeded the most recent 3-year period. The period 2004-2006, with the highest 3-year jobs growth, also represents 50-year peak construction volume, although closely rivaled for both jobs growth and peak volume from 1999-2001.
But, comparing jobs growth to spending growth is an invalid comparison. Jobs must be compared to volume. Spending is not volume.
Construction spending includes inflation. Inflation does not support jobs growth. If spending is increasing 6%/year and inflation increases 4%/year, then real construction volume is increasing only 2%/year. Balanced jobs growth would then increase 2%/year.
Spending is measured in current $, always current to the year, which includes inflation from year to year. Volume is reported in constant $, constant to the baseline year, which adjusts for inflation. Jobs should be compared to constant $ volume growth.

For the 5-year period 2013-2017, although spending increased 45%, inflation was near 4%/year for all 5 years. Real construction volume increased only 22%. Jobs, up 23%, just slightly exceeded volume growth during this period.
Update 3-6-19 – Jobs increased 324,000 in 2018, the largest increase since 2006. For the six years 2013-2018 jobs increased 1.6 million up 29%. Spending increased 50%. But after inflation volume increased only 25%. Jobs growth is exceeding volume growth.

I’ve written a series of articles on jobs vs spending/volume, comparing growth back to 2001. Links to the entire series can be found at the bottom of this post. Several things seem apparent from the analysis, among them, potentially hiring to match spending growth and hiring lags spending growth.
A benefit of the series is that it shows, although jobs/volume growth is nearly even, severe jobs imbalances exist within sectors. Nonresidential and Non-building show excess jobs while residential shows a severe jobs deficit.
Nonresidential buildings has had the largest jobs growth in excess of volume growth. This raises the question, are jobs being added in response to spending growth, which is almost 4%/year higher than real volume growth.
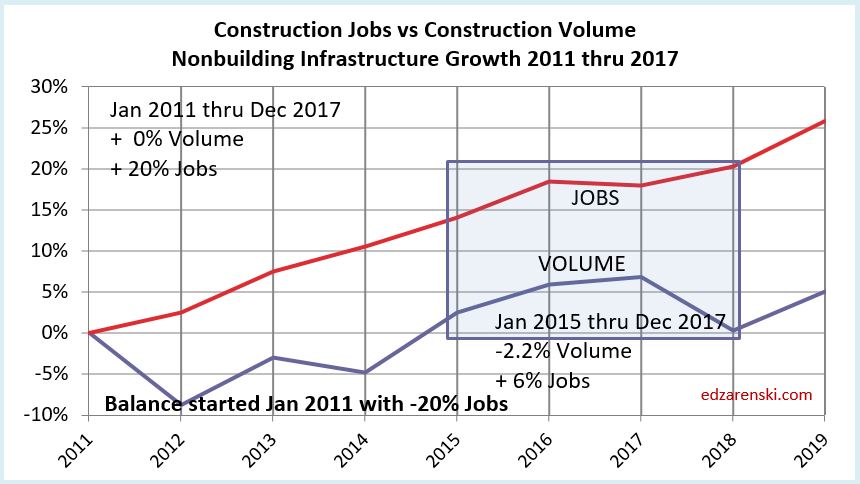
Non-building Infrastructure recent growth is similar to Nonres Bldgs, but it started 2011 with a large deficit.
Residential comparisons uncover some hidden factors. In this Residential plot, spending increased by 100% since Jan 1 2011, but after inflation volume increased by only 57%. Jobs lag 20% behind at only 37%.
But, are all residential jobs being counted? Several studies suggest that a large portion of residential construction jobs may be held by uncounted immigrant or day labor. So it’s possible the residential jobs deficit may not be as large as shown.
In addition to uncounted immigrant labor, some labor is mis-classified. Take for example, a high-rise multi-use building with commercial retail, office and residential space. Census definitions of spending classifications break out spending into the 3 market sectors, but the building is built by high-rise contractors (probably normally classified as commercial), not a residential contractor. This then is residential space built using labor classified as non-residential commercial. BLS writes this: “Establishments are classified into industries on the basis of their primary activity… For an establishment engaging in more than one activity, the entire employment of the establishment is included under the industry indicated by the principal activity”
The series of articles explains much more detail including productivity (annual $ put-in-place), jobs/workload balance and hiring patterns.
Residential Construction Jobs Shortages 2-3-18
Construction Jobs / Workload Balance 11-7-17
Jobs vs Construction Volume – Imbalances 8-8-17
Construction Jobs Growing Faster Than Volume 5-5-17
A Harder Pill To Swallow! 4-8-17
Is There a Construction Jobs Shortage? 3-10-17
Behind The Headlines – Construction Jobs 2-16-17
Construction Spending vs Jobs 2-9-17
Saturday Morning Thinking Outloud #5 – Jobs Growth 12-3-16
Saturday Morning Thinking Outloud #3 – Construction Jobs 11-19-16
Construction Jobs – Behind The Headlines 10-13-16
Construction Jobs Show 3rd Qtr Growth 10-7-16
Residential Construction Jobs Shortages
2-3-18
During the period including 2011 through 2017, we had record construction spending, up 50% in 5 years, moderate inflation reaching as high as 4.6% but averaging 3.8%, record construction volume growth (spending minus inflation), up 30% in 5 years and the the 2nd highest rate of jobs growth ever recorded.
Residential spending was up 90% in 5 years, but real residential volume up only 50%. Residential inflation, at 6%/year, was much higher than all construction. Jobs increased only 33%.
Construction added 1,339,000 jobs in the last 5 years. The only time in history that exceeded jobs growth like that was the period 1993-1999 with the highest 5-year growth ever of 1,483,000 jobs. That same 93-99 period had the previous highest spending and volume growth. 2004-2008 would have reached those lofty highs but the residential recession started in 2006 and by 2008 spending had already dropped 50%, offsetting the highest years of nonresidential growth ever posted.
The point made here is the period 2011-2017 shows spending and jobs at or near record growth. Although 2017 slowed, there is no widespread slowdown in volume or jobs growth.
This 2011-2017 plot of Construction Jobs Growth vs Construction Volume Growth seems to show there is no jobs shortage. In fact it shows jobs are growing slightly faster than volume. But that just does not sit well with survey data from contractors complaining of jobs shortages. So how is that explained?
There have been cries from some quarters, including this blog, that the answer lies in declining productivity. There seems to be plenty of workers, but it now takes more workers to do the same job that took fewer in the past. As we will see, that is part of the answer, but doesn’t explain why some contractors need to fill vacant positions. To find data that might answer that question about a jobs shortage we must dig a little deeper.
The total jobs vs volume picture masks what is going on in the three major sectors, Residential, Nonresidential Buildings and Non-Building Infrastructure. A breakout of jobs and volume growth by sector helps identify the imbalances and helps explain construction worker shortages. It shows the residential sector at a jobs deficit.
7 years 2011-2017 – % Jobs growth vs % Volume growth
- Totals All Construction Jobs +31%, Volume +30%
- Nonres Bldgs Jobs +27%, Volume +19%
- Nonbldg Hvy Engr Jobs +21%, Volume +12%
- Residential Jobs +40%, Volume +54%
The totals show jobs and volume almost equal, data that supports the 2011-2017 totals plot above and what we would expect in a balanced market. But severe imbalances show up by sector. Both nonresidential sectors show jobs growth far outpaced volume growth. Residential stands out with a huge deficit, with jobs way below volume growth.
Just looking at 2017 growth shows the most recent imbalances.
2017 % jobs growth vs % volume growth
- Totals All Construction Jobs +3.4% Volume -0.8%
- Nonres Bldgs Jobs +3.3% Volume -1.6%
- Nonbldg Hvy Engr Jobs +1.7% Volume -6.0%
- Residential Jobs +3.5% Volume +4.2%
Census recently released initial construction spending for 2017, totaling $1.230 trillion, up only 3.8% from 2016. What is somewhat disconcerting is that 2017 construction spending initial reports growth of 3.8% do not even match the total inflation growth of 4.6% for 2017, indicating a -0.8% volume decline. However, as does always occur, I’m expecting upward revisions (estimated +2%) to 2017$ construction spending on 7-1-18. If we don’t get an upward revision, then 2017 will go down as the largest productivity decline since recession. Even if we do get +2% upward revision to 2017$ spending, 2017 volume would be revised up to +1.2% and jobs growth will still exceed volume growth.
Let’s look a little deeper at the data within the sectors. Each chart is set to zero at Jan 2011 so we can see the change from that point, the low point of the recession, until today. At the bottom of each chart is shown a Balance at start. That represents the cumulative surplus or deficit of jobs growth compared to volume growth for the previous 10 years prior to Jan 2011. If there are no changes in productivity, or no surplus or deficit to counteract, then jobs should grow at the same pace as volume.
There are slight differences between the data in the three sector charts and the total construction chart. The sector charts use annual avg data and the totals chart uses actual monthly data.
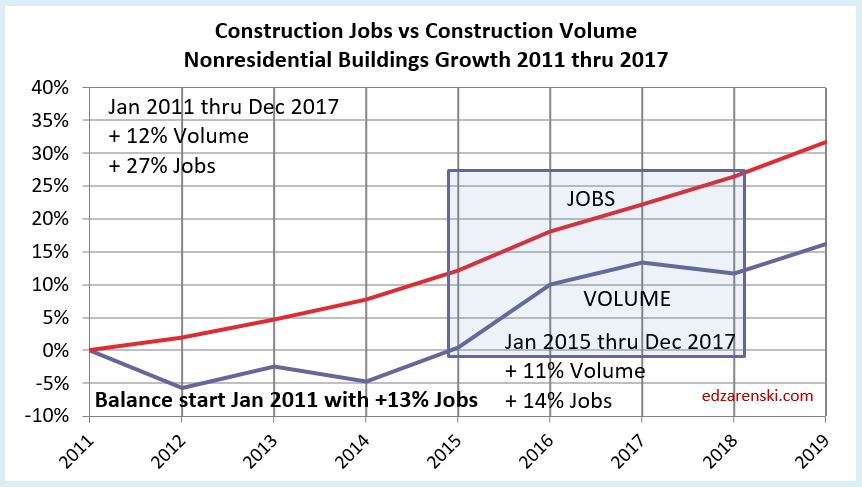
Nonresidential Buildings and Non-building Infrastructure, over seven years and the most recent three years, show jobs increasing far more rapidly than volume. Nonresidential Buildings started 2011 with a surplus of jobs after the recession, but Infrastructure started 2011 with a substantial deficit of jobs. Only in this last year did Infrastructure jobs reach long-term balance with work volume.
Nonresidential Buildings started 2011 with a 13% surplus of jobs and more than doubled it in the seven years following. I’ve suggested before it could be that a part of this surplus is due to companies hiring to meet revenue growth, and not inflation adjusted volume. Although nonresidential spending actually increased 43%, volume since 2010 has increased only 12%. Since 2010 there has been 30% nonresidential buildings inflation, which adds zero to volume growth and zero need for new jobs. A 43% increase in spending could lead companies to erroneously act to staff up to meet spending, or revenue, more than needed for the 12% volume increase.
This plot for residential work shows from 2011 to the end of 2017, we’ve experienced a 20% growth deficit in jobs. How many residential jobs does this 20% growth deficit represent? From Jan 2011 through Dec 2017, residential jobs increased from approximately 2,000,000 to 2,700,000. So the base on which the % growth increased over that time is calculated on 2,000,000. An additional 20% growth would be a maximum of 400,000 more jobs needed to offset the seven year deficit. But what about the imbalances that existed when we started the period?
During the residential recession from just 2005 through 2010, residential volume declined by 55%, but jobs were reduced by only 38%. For the entire period 2001-2010, total volume of work declined by 14% more than jobs were reduced. Some of the surplus jobs get absorbed into workforce productivity losses and some remain available to increase workload. It’s impossible to tell how much of that labor force would be available to absorb future work, so for purposes of this analysis an estimate of at least 5% seems not unreasonable. That would mean for 2011-2017, instead of a need for an additional 20% more jobs, the need could be reduced by 5% or 100,000 jobs.
This analysis shows a current deficit of 300,000 to 400,000 residential construction jobs. While it does also show nonresidential buildings jobs far exceed the workload and there are more than enough surplus jobs to offset the residential deficit, there would be several questions of how transferable jobs might be between sectors.
- Are there highly technical specialty jobs in Nonresidential Buildings that would not be transferable to Residential?
- What is the incidence of specialty workers engaging in work across sectors? i.e., job is counted in one sector but working in another sector.
- What has been the impact of losing immigrants from the construction workforce?
- Is the ratio of immigrant workers in Residential much higher than Nonresidential?
- Is the pay more attractive in Nonresidential construction?
- What, if any, percentage of the Residential workforce is not being counted? Day labor?
One thing is known for certain, high-rise multifamily residential buildings may often be built by a firm that is classified primarily as a nonresidential commercial builder. Therefore, some jobs that are counted as nonresidential are really residential jobs.
I think most of these would have a more negative impact on Residential jobs. However, there is some possibility that the overall deficit may not be quite as high as available data show (points 2 and 6). And there is always the possibility that we’ve crossed a threshold that has led to new gains in productivity, although to some extent, the stark differences between Residential and Nonresidential Buildings data might counter that proposition.
These two following report references both document that there is a large unaccounted for shadow workforce in construction. This workforce is probably mostly residential.
NAHB’s HousingEconomics.com “Immigrant Workers in the Construction Labor Force”
and these more recent reports adds volumes of data on immigrant labor
NAHB’s Jan 2018 Report on Immigrant Labor in Construction
Pew – U.S. Unauthorized Immigrant Total Dips to Lowest Level in a Decade NOV 2018
Unemployment and productivity includes only jobs counted in the official U.S. Census Bureau of Labor Statistics (BLS) jobs report. Both these reports document a large, unaccounted for shadow workforce in construction. By some accounts, 40% or more of the construction workforce in California and Texas are immigrant workers. Immigrants may comprise between 14% and 22% of the total construction workforce. It is not clear how many within that total may or may not be included in the U.S. Census BLS jobs report. However, the totals are significant enough that they would alter some of the results commonly reported.
The best way to see the implications that the available data do show is to look at productivity. The simplest presentation of productivity measures the total volume of work completed divided by the number of workers needed to put the volume of work in place, or $Put-in-Place per worker. In this case, $ spending is adjusted for inflation to get a measure of constant $ volume, and jobs are adjusted for hours worked.
As the Residential jobs deficit increases vs workload, this plot shows that $PIP is increasing. That makes sense. The workload continues to increase and the jobs growth is lagging, so the $PIP per worker goes up. For Nonresidential Buildings, the rate of hiring is exceeding the rate of new volume and therefore the $PIP is declining.

In boom times, residential construction adds between 150,000 and 170,000 jobs per year and has only twice since 1993 added 200,000 jobs per year. In the most recent several years expansion, residential has reached a high of 156,000 jobs in one year but has averaged 130,000 per year over 5 years. So it’s pretty unlikely that we are about to start adding residential construction jobs at a continuous rate of 200,000+ jobs per year.
If residential jobs growth were to increase by 50,000 jobs per year over and above current average growth, it would take 6 to 8 years to wipe out the jobs deficit in residential construction.
This problem is not going away anytime soon.
For more history on jobs growth see Is There a Construction Jobs Shortage?
For more on the imbalances of Res and Nonres jobs see A Harder Pill To Swallow!
For some hypotheses as to why nonresidential imbalances continue to increase see Construction Spending May 2017 – Behind The Headlines
