2-9-17
A few days ago I tweeted, “Last 16 months construction jobs growth outpaced growth in work put-in-place. Hard to see worker shortage from that perspective.”
The imbalance between construction spending and construction jobs is nothing new. It’s been going on for years. It reflects more than just worker shortages. In part it reflects hiring practices. It also captures changes in productivity due to activity. It also helps explain why sometimes new jobs growth rates do not follow directly in step with spending growth. That imbalance can be affected by either over/under-staffing or inflation.
This post presents a series of graphics that show the data that is compared and the percentages of increases (or declines) in balance between workers and output.
What data is available?
We get construction spending from Census and jobs from Bureau of Labor Statistics. For both we can break down the numbers by major construction sectors, Residential, Nonresidential Buildings and Non-building Infrastructure. Inflation is gathered from a number of sources and is specific to sector.
How to look at the data.
Construction spending must be adjusted for inflation to get real volume of work completed. Inflation (or deflation) can vary up or down by 2% to 10% but averages about 4%/year. The adjustment gives us what is referred to as “constant dollars.” Jobs must be adjusted for hours worked. Hours worked can change total workforce output by 2%-3%/year. Everything is converted to the most recent year for comparison.
The inputs:
This Building Cost Index plot shows inflation/deflation by sector. Note that it can vary dramatically from one sector to another. It is often driven by the amount of work activity within the sector. These indexes represent the actual final cost of buildings.

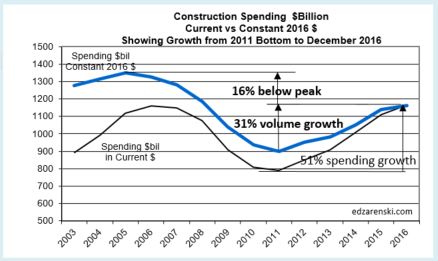
The inflation factors are applied to the annual spending within each sector. This plot shows the combined affect of inflation on total construction output. Current dollars is actual construction spending as reported by U.S. Census. Constant $ is inflation adjusted to 2016. Jobs adjusted for hours worked must be compared to constant dollars.
This plot breaks down the construction spending in constant dollars by sector. This provides the total work completed annually within each sector. This will allow tracking jobs by sector to constant $ by sector.

This plot shows U.S.Census CES jobs by sector. These are adjusted by the hours worked average per year. Hours worked doesn’t change by much within a single year but has varied by 4.5% from maximum to minimum and that has a significant affect on overall output. Adjusted jobs provides us with the total work output.

Those are all the inputs, adjusted to a constant point in time, 2016. Now we can look at how adjusted jobs growth compares to real spending output. I’ve often referred to this as productivity. When spending output is growing faster than jobs, productivity is increasing. When jobs are growing faster than spending output, productivity is decreasing.
The Outputs:
The difference between real spending output and jobs growth is more than simply explained as a change in productivity. It reflects the combined impact of hiring practices, hours worked, worker and skills shortages (or excesses) and changes in productivity on inflation adjusted spending. It does not provide a means to differentiate among these causes. However, regardless the cause, imbalances can be thought of as annual productivity gains or losses because they do indeed reflect the total real labor output required to perform the amount of real work put in place.

Leading up to and during the recession there appeared to be far more workers on hand than needed to get the work done. Prior to the recession, I expect a greater portion of the losses were over-hiring and worker productivity losses. It is not uncommon when work is plentiful that productivity declines (2005-2006). When spending started to decrease significantly it took a bit longer for companies to downsize their workforce. During that time (2007-2008) the greater portion of losses might be attributed to insufficient staffing reductions. As we approached the depths of the recession (2009-2010) staffing cuts exceeded the declines in actual work being put in place. Also, people who still had jobs were concerned about keeping their jobs and during such times at first productivity increases. At some point the insufficient staff becomes overworked and productivity declines (2010-2011). Post recession, spending increased faster than companies were replenishing their staff. That led to several years of productivity gains (2012-2015).
Another way to look at this same comparison is to plot the dollars of inflation adjusted volume of work per worker. Here I’ve plotted that by sector.

Some analysts prefer to report this as the number of jobs required to put-in-place $1 billion worth of work. Regardless how it is reported, it is imperative that the comparison be made to constant $, in this case adjusted here to 2016.

Finally we can look at the data for each sector and compare the work being completed each year to the total workforce output to complete that work. There are obviously significant differences in the data by sector.


The data outputs show some things that otherwise are not readily apparent. Note for instance that residential (constant $) spending peaked in 2005, but residential jobs peaked in 2006 when spending was already on the decline. That could be an indication that staffing patterns lag changes in work volume. From the 2005 peak to the 2008 bottom, residential spending declined from $700 billion to $300 billion, almost 60%, but jobs dropped from 3.5 million to 2 million, only about 45%. That would indicate that firms were significantly overstaffed at that time. That explains the several years of deep red bars on the residential productivity plot. That also helps explain in part the slow regrowth on residential jobs. For the real volume of work that was being completed at the time, which was real low, there was already excess staffing remaining on hand.
Work completed and worker output to complete the work will probably continue to be out of balance. It would be difficult to identify any abnormalities in the data releases, for example workers improperly classified to a sector. Any missing workers not captured in the survey would lower productivity. Real productivity gains and losses due to activity will always be a part of the mix. Hiring of less qualified workers due to skilled worker shortages is in the mix. And finally, companies delayed decisions on staffing adjustments will remain part of the issue.
