Home » Public
Category Archives: Public

Burning Questions – Recession, Labor, Infrastructure
I gave two conference presentations in the past month. The most pressing questions from the audience were:
Are we headed into a recession? When will recession start?
What can be done about the labor shortage?
How can we support all the infrastructure work that is about to begin?
RECESSION
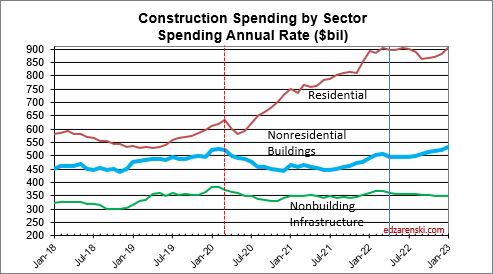
There is no question the sizable drop in starts in 2020 lead to a downturn in construction spending, mostly felt in 2021, but extending somewhat into 2022. However, this quickly turned around for residential spending and nonres bldgs spending is now past the low point caused by the pandemic initiated slowdown. With new construction starts to date at all-time highs and the forecast for new construction starts in the pipeline, it’s hard to envision how this would lead to a construction recession.
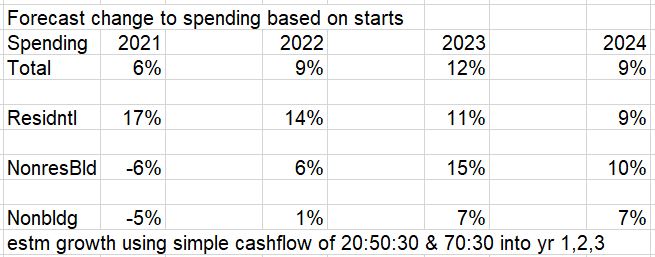
- In 2021, new starts increased 17%. Residential +21%, Nonres Bldgs +15% and Nonbldg +9%.
- In 2022, new starts are forecast up 11%. Residential +10%, Nonres Bldgs +18% and Nonbldg +4%.
- In 2023, new starts are forecast up 10%. Residential +12%, Nonres Bldgs +7% and Nonbldg +11%.
Total of all starts year-to-date in 2022 are up 6% over Jan-May 2021. Nonres bldgs starts are up 17% year-to-date. For the past 6 months, Dec’21 to May’22, residential construction starts posted 5 of the 6 highest months ever. The 6mo total for residential starts is the highest 6mo total ever recorded, up 4% over the previous 6mo record, posted in 2021.
Residential new starts get spent at a ratio of 70:30. Nonresidential Bldgs spending from new starts, on average, gets spent over the next 3 years in the ratio of 20:50:30. That is, 20% of spending from all starts within the year gets spent within the year started, 50% gets spent in the following year and 30% gets spent in the 3rd and sometimes 4th year. So from this we can say, if new starts are up 10% for the year then spending from that source will increase 10% x 20% or 2% the 1st year, 10% x 50%, 5% the 2nd year and 10% x 30%, 3% the 3rd year. If we get 3 consecutive years of growth in new starts there would be no downward pressure on spending for the next 3 to 4 years.
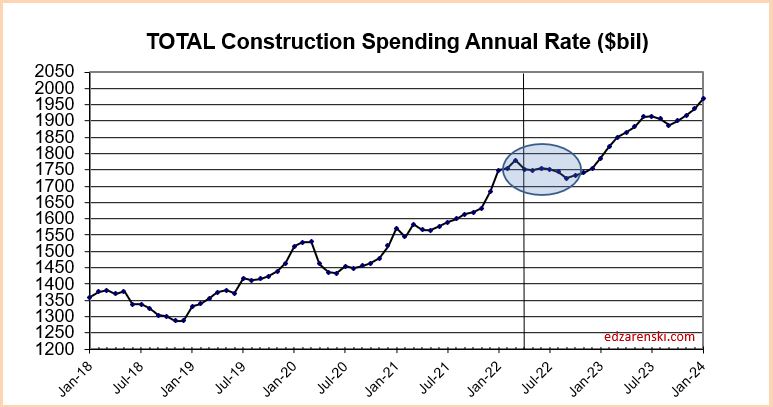
In the 2nd half of 2021, residential starts, although still strong, posted a few lower monthly totals. Although 2022 spending will still finish the year up, these lower monthly starts from late 2021 will work to cause a slight spending dip in the 2nd half of 2022. Nonresidential Bldgs spending is slowly increasing in 2nd half 2022. Nonbldg spending is flat or very slowly decreasing. The net effect is spending will post a decline in 4 of the next 8 months of 2022, but the total declines may not result in 2 consecutive quarters of declines. By the time we head into 2023, all three major construction sectors are in a growth pattern.
So, we will see a few months of spending declines, but the new starts pool of work is growing, not decreasing. The current forecast model is predicting no recession on the horizon.
LABOR SHORTAGE
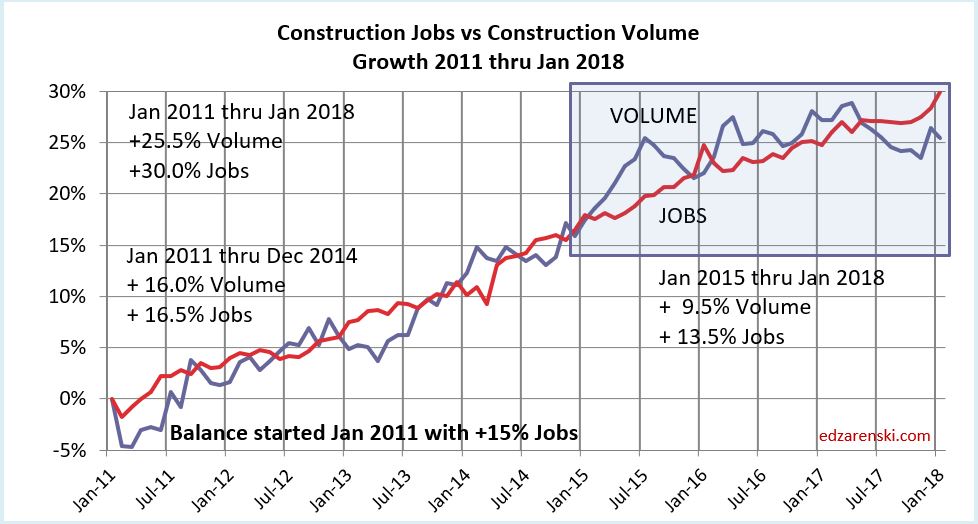
This next plot shows labor and volume of work (spending minus inflation) to support that labor growing equally, albeit with short-term peaks and troughs, from 2011 to 2018. In fact, this equal growth extends far back with only few years causing exception to this pattern. This plot, and the extension of this plot to older data, shows that normally, labor increases at the same rate as volume. You can see that 2018 posted a significant drop in volume while jobs continued to increase. This departure had nearly corrected itself by Jan 2020.
The most recent construction spending report, issued July 1, revised unadjusted spending data for 2020 and 2021, both years added $30+bil. That brought volume up those years on this plot. The current spread between jobs and volume of work is still 10%.
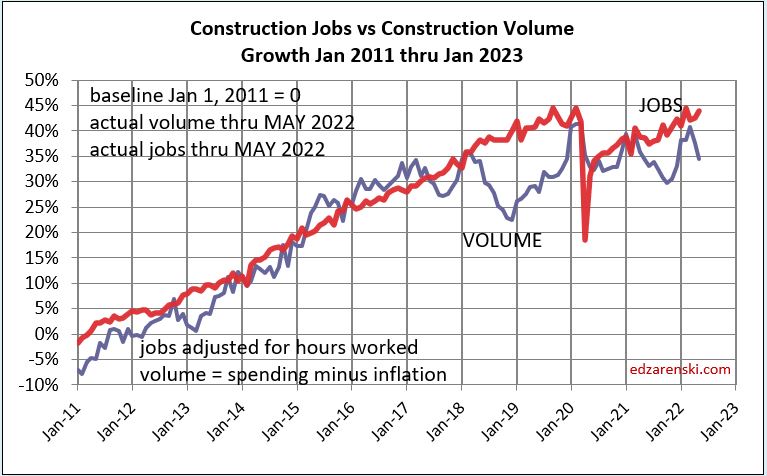
In May of 2020, jobs were already on the rebound, but the volume of work was not. Work volume did recover some at the end of 2020 but then fell again, as was predicted, into mid-2021. In May of 2020, jobs and the volume of work were near balance. Since May of 2020, spending increased by 22%, but most of that was inflation. Since May 2020, actual work volume increased by only 1.5%. Jobs increased by 9%.
The last time the normal jobs/volume growth pattern was disrupted like this was 2006, the only other time in the last 25 years this occurred.
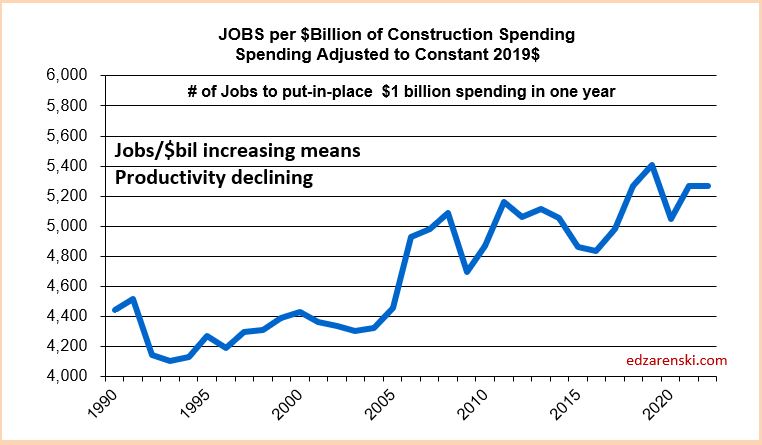
Volume, not spending, supports jobs. If volume is down, support for more jobs drops. If jobs increase while volume is declining then productivity is declining and the number of jobs required to put-in-place $1 billion of construction volume increases. At the same time, the inverse, the amount of volume put-in-place per job, decreases. This productivity loss drives up construction labor cost inflation and the need for additional labor to complete the job.
edited/added 8-6-22 Where the construction jobs are:
From Feb 2020 to Jul 2022 Nonres Bldgs and Nonbldg jobs are down 3.5% and 1.5%. Volume of work is down 20%.
Residential jobs are up 6.5%. Rsdn volume is up 14%.
It’s not quite that bad in either sector because some workers classified and counted as nonresidential perform work in the residential sector.
Total jobs up 1%. Total volume down 7%. That’s a slip of 8% in productivity. If labor is only 30% of total construction cost, an 8% slip in productivity is a 2.4% increase in inflation. That’s in addition to changes in wages.
INFRASTRUCTURE
The current administration has approved an infrastructure spending bill that earmarks approximately $500 billion for construction spending. It will take several years to start all this work.
The infrastructure spending bill may fund construction for a variety of buildings and non-building types of construction, for example, highway, water and sewer, educational, healthcare, etc. Rather than strictly classified as infrastructure, or as commonly referred to as nonbuilding construction, this bill will fund some forms of buildings and non-building construction in the public construction sector.
The total of all public construction is only 25% of all construction. This subset of construction totals about $360 billion in annual construction spending. It has never increased by more than $37 billion in spending ($35 billion in volume) in a year. Average growth is closer to $10-$15 billion/year. This public sector of construction does not have the capacity to increase by $100 billion/year.
As you can see in the plot above, it takes about 5000 jobs to support $1 billion of volume for 1 year. So, increasing volume by $35 billion in one year would require 35 x 5000 = 175,000 new jobs for that year. Keep in mind, this is to support a subset of construction that is only 25% of all construction.
Jobs rarely (4 out of 50 yrs) increase by more than 400,000 in one year for all construction. Even taking out the 13 years when jobs dropped, the average jobs growth for the past 50 years is only 220,000/year for all construction. That would seem to indicate the average growth for the public sector, at 25% of all construction, averages only 55,000 jobs/year.
Total all construction for the three years 2022-2023-2024 is forecast to increase $140 billion, $117 billion and $116 billion. The remaining 75% of the construction industry still adds a lot of demand for growth and jobs beyond just that of the public sector that gets a boost from the infrastructure bill. But after adjusting for inflation, the growth in volume over this three-year period is only about $120 billion. That would generate a need to create 600,000 new jobs over the next three years. About 25% of those jobs support the infrastructure funded growth.
If the infrastructure spending bill adds $35-$40 billion/year in spending, $30-$35 billion/year in volume, the need would be 150,000 to 175,000 jobs/year to support that 25% of the construction industry. Since it is unlikely the public sector of construction could add that many jobs, it is more likely the amount of construction spending added yearly will be somewhat lower.
Infrastructure has a slower spending curve than the 20:50:30 for nonres bldgs, roughly more like 15:40:30:15. If $100 bil of new contract awards start in 2022 then spending would be $15 bil in 2022, $40 bil in 2023, etc.. At $100 bil of new starts per year, the highest one-year growth would be $40 bil, probably double the pace the sector can grow.

Public/Private Construction Spending Forecast 2020-2021
12-18-20
Public Starts and Backlog
Leading into 2020, the Public markets with the highest growth in new starts the previous two years were Transportation and Public Works. Transportation terminals and rail starts were up 15% over two years, 25% in the last three years. Backlog nearly doubled in three years because a large portion of those starts is very long duration projects. Public works starts were up 13%, 20% in three years, and backlog is up 40%. Infrastructure projects typically have the longest duration. Projects contribute spending sometimes up to 5 or 6 years.
Public work backlog leading into 2020 was up an average 8%/year for the last three years. Some of this is very long-term work that started construction in 2017 and it will still contribute spending for the next several years. 40% of all public spending in 2020 comes from projects that started prior to Jan 2019.
2020 losses in new construction starts impact the forecast for the next few years. Total new starts in 2020 for Public work dropped 9%. Transportation starts fell 20%, Educational starts fell 11% and Public works fell 6%. Amusement/Recreation starts fell 40%. Highway/Bridge starts increased 4%.
2021 Starting Backlog for all Public work is down 5%. Backlog for Transportation projects drops only 4%, and that leaves 2021 still 2nd only to the all-time high in 2020. Both Educational and Public Works backlogs drop 7%. Amusement/Recreation backlog falls 40%. Highway backlog increases 3%. Of all public work in backlog at the start of 2021, 43% comes from projects that started prior to Jan 2020.
Public Spending
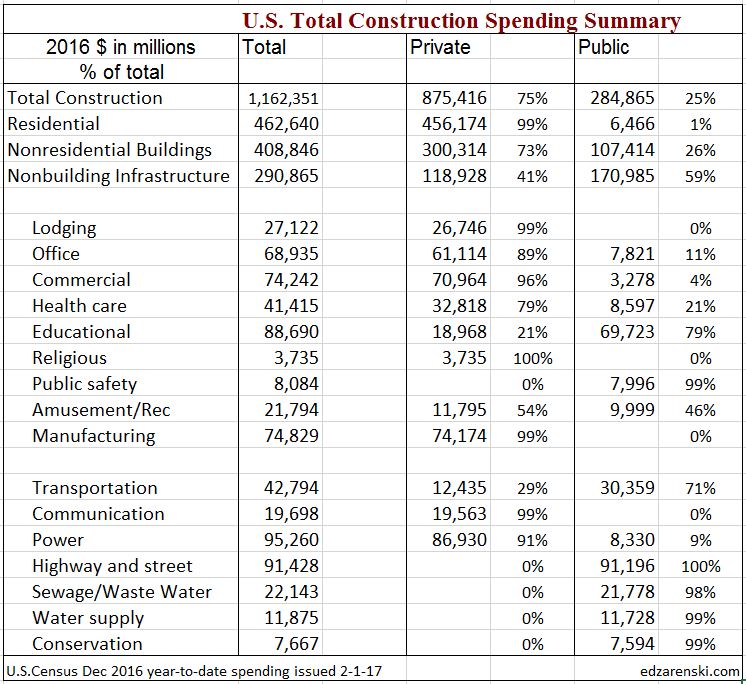
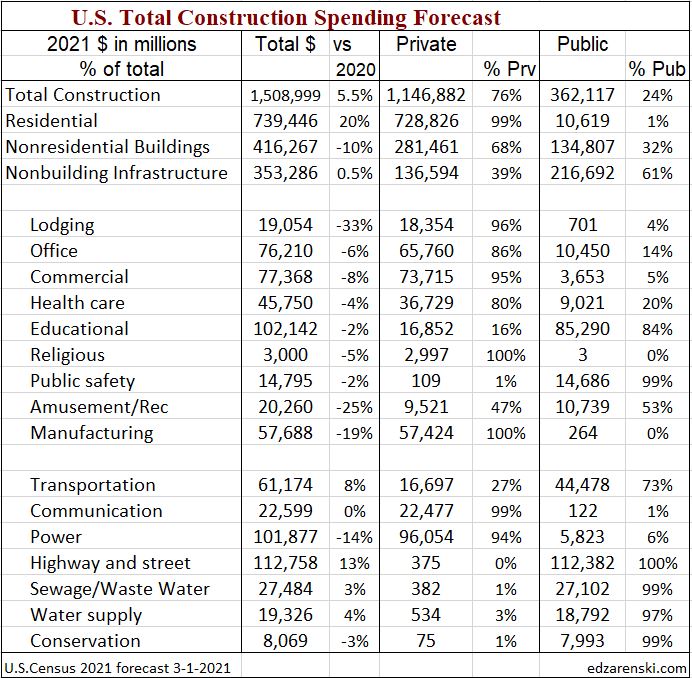
The two largest markets contributing to public spending are Highway/Bridge (30% of total public spending) and Educational (25%), together accounting for 55% of all public construction spending. At #3, Transportation is only 12% of public spending. Environmental Public Works combined makes up 15% of public spending, but that consists of three markets, Sewage/Wastewater, Water Supply and Conservation. Office, Healthcare, Public Safety and Amusement/Recreation account for about 3% to 4% each.
Highway is 100% public and Public Works 98%. Educational is 80% public, Transportation 70%, Amusement/Rec 50% and Healthcare 20%.
Total public spending for 2020 is projected to finished up 5% at $350 billion. Spending for every major public market is projected to finish up in 2020. By far, the largest Public spending increases measured in dollars for 2020 are Educational, Transportation and Public Safety.
Total public spending in 2021 is projected to finished up 5% at $370 billion. Transportation provides most of the gains in 2021 and Public Works adds some, but this forecast may come down without support from Highway or Educational.

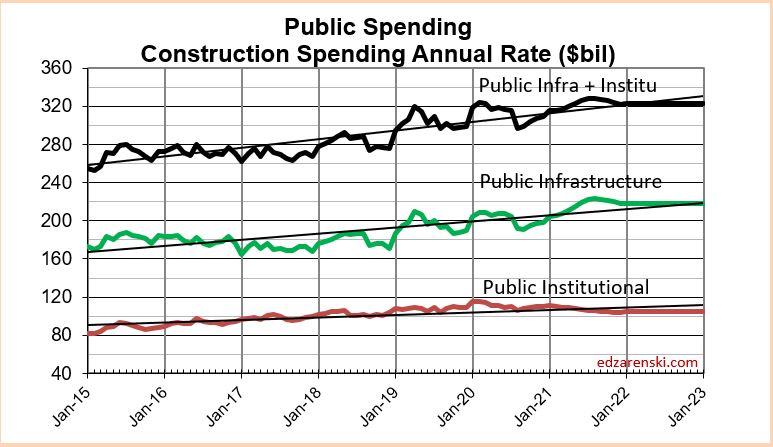
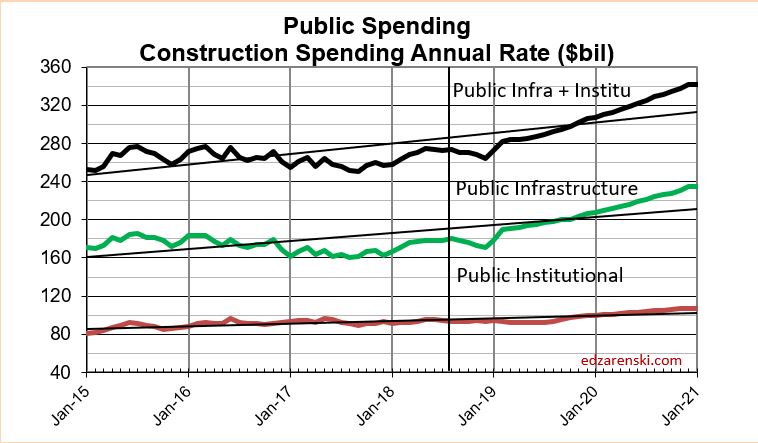
Public Infrastructure and Public Institutional
A bit less than 60% of all Non-building Infrastructure spending, $198 billion in 2020, is publicly funded. That public subset of work has averaged growth of $5 billion/year from 2013 through 2019, with maximum growth of $16 billion in 2019. 2020 increased only $4 billion. In 2020, Non-Building Infrastructure spending makes up about 60% of Public spending.
About 30% of all Nonresidential Buildings spending, $141 billion in 2020, is publicly funded. It’s mostly Educational. That public subset of work has averaged growth of $6 billion/year from 2013 through 2019, with maximum growth of $10 billion in 2017. 2020 increased $14 billion. In 2020, Nonresidential Buildings spending makes up about 40% of Public spending.
- Infrastructure = $349 billion, ~25% of all construction spending.
- Infrastructure is about 57% public, 43% private. In 2005 it was 70% public.
- Public Infrastructure = $198 billion. Private Infrastructure = $150 billion.
- Power and Communications are mostly privately funded infrastructure.
- Nonresidential Buildings is 30% public (mostly institutional), 70% private.
- Educational, Healthcare and Public Safety are Public Nonres Institutional Bldgs
- Public Commercial construction and Amusement/Rec. are not included.
- Public Institutional = $110 billion, mostly Education ($86b).
Public Infrastructure + Public Institutional = $308 billion, 22% of total spending.
Public Infrastructure + Institutional average growth is $12 billion/year. This subset has never exceeded $30 billion in growth in a single year. In 2019 spending increased $20 billion. With 10 months data posted, 2020 is forecast to increase $17 billion.
Although total all public spending may increase for 2021, the select group of Infrastructure + Institutional likely to be funded by an Infrastructure stimulus bill shows 2021 growth is uncertain and may remain flat.
See Also
Down the Infrastructure Rabbit Hole
Infrastructure – Ramping Up to Add $1 trillion

Public Infrastructure – Behind the Headlines
PUBLIC WORK AND INFRASTRUCTURE SPENDING
Most public work is non-building infrastructure, or public works type projects, but some public work is nonresidential buildings. In 2018, of $301 billion in public work, $177 billion (59%) is non-building infrastructure, $118 billion (39%) is nonresidential buildings, $6 billion is residential. The public subset of work in the last 25 years has grown by $20 billion/year only twice, during the construction boom of 2006-2007.
Excluding the worst recession years, the average annual growth of all publicly funded work since 2001 is $8 billion/year. In the four best construction boom years growth averaged $20 billion/year.
The two largest markets contributing to public spending are Highway/Bridge and Educational, together accounting for nearly 60% of all public construction spending. At #3, Transportation is only about 12% of public spending. Sewage/Waste Water and Water Supply add up to another 12% of public work. All other markets combined, none more than 4% of total public work, account for only 15% of public spending.
Non-Building Infrastructure sector, at a total of $313 billion in 2018, is less than 25% of all construction spending, mostly supported by the Power market. Power accounts for 33% of all non-bldg infrastructure spending. Highway represents 30% and Transportation about 15%. However, Power is 80% private; Highway is 100% public; Transportation 70% public.
60% of non-building infrastructure spending is publicly funded. Highway is a little more than half of all publicly funded non-bldg infrastructure work. The public non-bldg subset of work in the last 25 years has grown by $10 billion/year or more three times, 2006, 2007 and 2018. In 2006-2007, Highway accounted for most of that growth. In 2018, Transportation accounted for half the growth.
Excluding the worst recession years, the average annual growth of publicly funded non-bldg infrastructure work since 2001 is $5 billion/year. In the four best construction boom years growth averaged $12 billion/year.
Nonresidential Building sector, at a total of $434 billion in 2018, is 35% of all construction spending, mostly supported by the Educational and Commercial markets. Educational accounts for 22% of all nonresidential buildings spending, commercial 20%. However, Educational is 80% public, Commercial is only 4% public.
Other nonresidential buildings that are publicly funded are: Public Safety – 100% public; Amusement/Recreation Facilities (i.e.’ Convention Centers, Stadiums) – 45% public; Healthcare – 20% public; Office – 13% public. None are more than 4% of total public spending.
Less than 30% of nonresidential buildings spending is publicly funded. Educational is 60% of all publicly funded nonresidential building. The public nonresidential building subset of work in the last 25 years has grown by $10 billion/year twice, in 2007 and 2008. Both times, Educational accounted for 75% of that growth.
Excluding the worst recession years, the average annual growth of publicly funded nonresidential building since 2001 is $4 billion/year. In the four best construction boom years growth averaged $8 billion/year.
Residential is 40% of all construction spending but only 2% of public spending.
Average post-recession growth in public infrastructure + public institutional jobs is about 40,000 jobs per yr. Maximum growth in a year was 60,000 jobs. Growth of $10 billion in spending in a year supports about 40,000 new jobs.
All public work in the last 25 years has grown by $20 billion/year only twice. The average annual growth of all publicly funded work since 2001 is $8 billion/year. In the four best construction boom years growth averaged $20 billion/year.
Total All Public Infrastructure construction, including non-building public works and nonresidential public buildings, already has 2019 and 2020 growth projections at historic capacity of +$20 to +$30 billion/year. Historically, even in the construction boom years of 2005-2008, we have never exceeded that growth volume, especially by another $10-$20 billion/year, nor added an additional 40,000-80,000 jobs per year above the average 40,000 or the maximum 60,000 jobs in a year.
Any government funding intended to increase public infrastructure construction would most likely be limited by industry growth rates to at best no more than $10-$20 billion a year.
See Marketwatch.com for additional notes I’ve posted regarding spending limits.
The above Marketwatch article links to a twitter thread I posted that summarizes Infrastructure limitations in a nutshell.
See also these articles for much more analysis on Infrastructure
2018/02/16 Down the infrastructure rabbit hole
2017/01/30 Infrastructure – Ramping up to add $1 trillion

2019 Construction Economic Forecast – Summary – Dec 2018
Construction Analytics 2019 Construction Economic Forecast
This Dec. 2018 Construction Economic Forecast analysis addresses New Construction Starts, Inflation, Cash Flow or distribution of construction work over time, Annual Backlog and Spending. New Starts is new work entering Backlog. Cash Flow gives the pattern of Spending. Inflation differentiates between Revenue and Volume. Backlog, which can be referenced to assess expected future Volume and Spending, provides an indication of when Volume occurs or in what year Revenues occur. Starts data is from Dodge Data & Analytics. Spending data is from the U.S. Census Bureau. Jobs data is from the Bureau of Labor Statistics. Inflation data is from the source labeled. Cash flow, Backlog and Inflation forecast data are developed internally. All data in this report is national level data. All forecast data is by Construction Analytics.
NOTE 12-6-18: Dodge Data and Analytics new construction starts for October, released 11-20-18, reached the 2nd highest seasonally adjusted annual rate ever, 2nd only to June 2018. Most spending from these new starts will occur in 2020. U.S. Census construction spending for October posted large reductions to several months of residential spending. Construction Starts for October, the Dodge end-of-year report and October spending, all released between 11-21-18 and 12-3-18 significantly alter this analysis, by far most of the 2019 and 2020 changes are significant reductions in residential spending. See the 2019 Construction Economic Forecast – Nonresidential for detail on all nonresidential and non-building markets
This analysis was edited to include the most recent starts data and the U S Census October spending data.
For a fully formatted PDF of this Report click
2019 Construction Economic Forecast – Summary – Dec 2018
Link to the 2019 Nonresidential Forecast Report
2019 Construction Economic Forecast – Nonresidential – Nov 2018
Summary
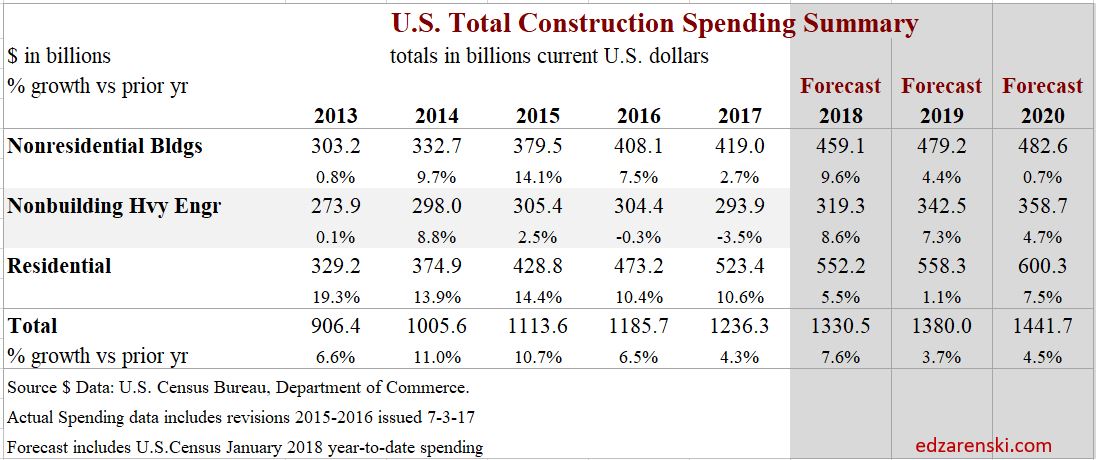
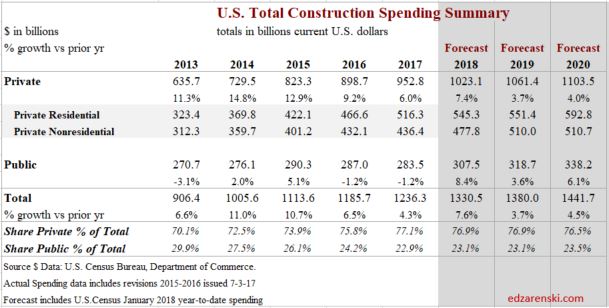
Total of All construction spending is forecast to increase 6.0% to $1.321 trillion in 2018 and 1.5% to $1.341 trillion in 2019. Spending in 2020 is forecast to reach $1.426 trillion.

Nonresidential Buildings construction spending is forecast to increase 5.8% to $444 billion in 2018, dip -0.2% to $443 billion in 2019 and climb 8.9% to $482 billion in 2020. Office (which includes data centers) and Amusement/Recreation support the 2019 but there is downward pressure from slowdowns or timing of cash flow in Manufacturing, Lodging, Healthcare and Educational. Educational, Healthcare, Recreation, Office and Manufacturing all support growth in 2020.
Residential construction spending for 2018 was recently revised down and starts for 2019 are expected flat to down slightly. The forecast is now for an increase of 5.6% to $562 billion in 2018, 0.5% to $564 billion in 2019 and 2.3% to $577 billion in 2020. Although residential spending is still increasing, growth has slowed to less than inflation. Real volume after inflation is declining.
Nonbuilding Infrastructure construction spending is forecast to increase 7.2% to $316 billion in 2018, 5.5% to $334 billion in 2019 and 9.9% to $367 billion in 2020. Transportation spending provides strong growth for the next three years from record new starts in 2017 and the 2nd best year of starts in 2018. Public Works had strong growth in 2018 starts and Highway starts hit a new high in 2018.

In July of the following year the spending data for the previous two years gets revised. Those revisions are always up, although some markets may increase while others decrease. So, even though the current forecast for 2018 is $1,321 trillion, a gain of 6.0%, that will most likely increase.
Dodge Data construction starts are initially anticipated to finish 2018 flat compared to 2017. However, starts are always revised upward in the following year. I expect revisions will show 2018 starts increased by 4% over 2017. Even with revisions, 2018 starts will post the slowest growth since 2011. Starts increased 84% in the period 2012-2017, residential 150% and nonresidential buildings 80%. This forecast includes only a total of 10% new starts growth for the 3-year period 2018-2020.
Starting backlog, currently at an all-time high, increased on average 10%/year the last three years. For 2019 starting backlog is forecast up 10% over 2018. 80% of all Nonresidential spending within the year will be generated from projects in starting backlog. Due to long duration jobs, 2019 nonresidential buildings starting backlog is up 50% in the last 4 years. Current indications are that 2019 backlog will be up 6%-8% across all sectors.
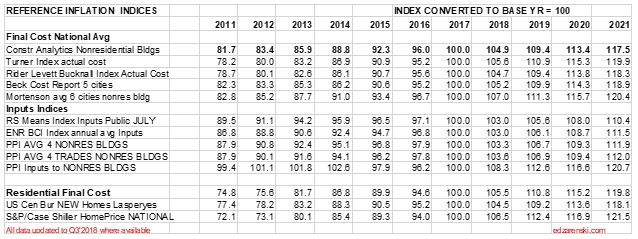
Construction Inflation Indices
When construction is very actively growing, total construction costs typically increase more rapidly than the net cost of labor and materials. In active markets overhead and profit margins increase in response to increased demand. These costs are captured only in Selling Price, or final cost indices.
General construction cost indices and Input price indices that don’t track whole building final cost do not capture the full cost of inflation on construction projects.
Revenue is spending but real volume is spending minus inflation. Outside of recession years, nonresidential buildings construction spending year over year growth dropped below 4% only SIX times in 50 years. The long-term average inflation is 3.75%. Every year that spending dropped below 4% growth, nonresidential buildings real volume declined.
To differentiate between Revenue and Volume you must use actual final cost indices, otherwise known as selling price indices, to properly adjust the cost of construction over time.
Construction Analytics Nonresidential buildings inflation forecast for 2018 is 4.9%. Current reliable inflation forecasts range from 4.7% to 5.6%. Spending needs to grow at a minimum of 4.7% just to stay ahead of construction inflation. Inflation in this sector has been at 4% or higher the last four years.
Selling Price is whole building actual final cost. Selling price indices track the final cost of construction, which includes, in addition to costs of labor and materials and sales/use taxes, general contractor and sub-contractor margins or overhead and profit.
Construction Analytics Building Cost Index, Turner Building Cost Index, Rider Levett Bucknall Cost Index, Beck Cost Index and Mortenson Cost Index are all examples of whole building cost indices that measure final selling price of nonresidential buildings only. The individual average annual growth for all these indices over the past 4-years is 4.6%/year.
Producer Price Index (PPI) for Construction Inputs is an example of a commonly referenced construction cost index that does not represent whole building costs. The PPI tracks material cost at the producer level, not prices or bids at the contractor as-built level.
Engineering News Record Building Cost Index (ENRBCI) and RSMeans Cost Index are examples of commonly used indices that DO NOT represent whole building costs yet are commonly used to adjust project costs. The ENRBCI tracks a limited market basket of labor and materials. RSMeans holds the quantity of materials and labor for a building constant. Neither index addresses contractor margins. However, they are useful in that they also publish input cost indices from many cities. This provides a reference to compare those cities to the national average, but still, only for a limited basket of labor and materials. Neither gives any indication of the level of market activity in an area.
Residential construction saw a slowdown in inflation to only +3.5% in 2015. However, the average inflation for six years from 2013 to 2018 is 5.7%. It peaked at 8% in 2013. It climbed back over 5% for 2016 and currently is near 5.5% in 2018. Anticipate national average residential construction inflation for 2018 at least 5.5 % to 6%.
Nonresidential Buildings indices have averaged 4% to 4.5% over the last five years and have reached over 5% in the last three years. Nonresidential buildings inflation totaled 18% in the last four years. My forecast shows nonresidential buildings spending in 2018 will reach the fastest rate of growth in three years, which historically has led to accelerated inflation.
There are clear signs of increasing construction activity and a tightening construction labor market. The national construction unemployment rate recently posted below 4%, the lowest on record with data back to 2000. During the previous expansion it hit a low average of 5%. During the recession it went as high as 25%. The average has been below 5% for the last 18 months. An unemployment rate this low potentially signifies labor shortages. The Job Openings and Labor Turnover Survey (JOLTS) for construction is at or near all-time highs. A tight labor market will keep labor costs climbing at the fastest rate in years. Labor shortages cause contractors to pay premiums over and above normal wage increases to keep workers from leaving. Some premiums accelerate labor cost inflation but are not recorded in published wage data.
Recent news of tariffs has extended beyond just steel. I calculated a 25% tariff on raw steel would add 1% to the cost of nonresidential steel buildings. Hi-rise residential buildings, if building is structural steel, would fall in this category. Wood framed residential impact would be small. A 25% increase in mill steel could add 0.65% to final cost of building just for the structure. It adds 1.0% for all steel in a building. If your building is not a steel structure, steel still potentially adds 0.35%.
Anticipate national average construction inflation for nonresidential buildings for 2018 and 2019, including steel impact, of 4.25% to 5.5%, rather than the long-term growth average of 4%. Adjust for any other yet unknown tariffs that may hit after Jan 1, 2019.
In the following plot, Construction Analytics Building Cost Index annual percent change for nonresidential buildings is plotted as a line against a bar chart background of the range of all other nonresidential building inflation indices. Usually the lows are formed by market basket input indices while the highs are formed by other selling price indices.

As noted above, some reliable nonresidential selling price indexes have been over 4% since 2014. Currently most selling price indices are over 5% inflation in 2018. Notice during that same period seldom did any input indices climbed above 3%.

Every index as published has its own base year = 100, generally the year the index was first created, and they all vary. All indices here are converted to the same base year, 2017 = 100, for ease of comparison. No data is changed from the original published indices.
Non-building Infrastructure indices are far more market specific than any other type of index. Reference specific Infrastructure indices rather than any average.
These links point to comprehensive coverage of the topic inflation and are recommended reading.
Click Here for Link to a 20-year Table of 25 Indices
Click Here for Cost Inflation Commentary – text on Current Inflation
Current$ vs Constant$
Comparing current $ spending to previous year spending does not give any indication if business volume is increasing. The inflation factor is missing. If spending is increasing at 5%/year at a time when inflation is 4%/year, real volume is increasing by only 1%.
The current Nonresidential buildings forecast of spending growth at 6.0% for 2018 would suggest that after inflation, nonresidential buildings construction volume is growing slightly. So expect volume growth in 2018, but next year 4.3% inflation and no spending growth is signaling a volume decline in 2019.
Nonresidential spending increased 43% since 2010, but there was 30% inflation. Real nonresidential volume since 2010 has increased by only 12%. Nonresidential jobs increased by 27% during that period, 15% greater than volume growth.
Residential spending increased by 110% since 2010, but after inflation, real residential volume increased by only 57%. Jobs increased by only 37%, 20% short of volume growth.
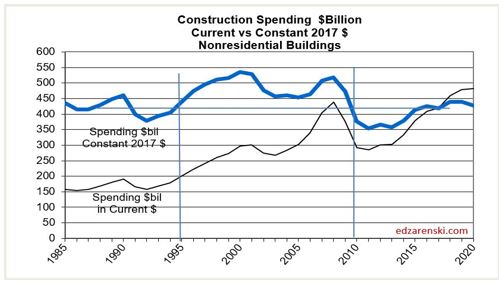
When comparing inflation adjusted constant dollars, 2018 spending will still be lower than all years from 1998 through 2007. In 2005 constant $ volume reached a peak at $1,450 billion. At current rates of growth, we would not eclipse the previous high before 2022.

Spending in current $ is 14% higher than the previous 2006 high spending.
Volume after adjusting for inflation is still 14% lower than the previous 2005 high volume.
Jobs and Volume
The period 2011-2017 shows both spending and jobs growth at or near record highs.
A spending forecast of 6.6%+ in 2018, or an increase of $83 billion in construction spending, demands a few words on jobs growth. Construction requires about 5000 workers for every added $1 billion in construction “volume”. But construction jobs growth seems to closely follow growth in spending. Construction jobs have increased by 400,000 in a year only four times in the last 50 years, each time accompanied by one of the four highest spending growth increases in 50 years. However, $80 billion in added spending is not the same as $80 billion in volume, and jobs needed is based on volume.
Although spending will increase 6.6%, construction inflation has been hovering near 4.5% for the last five years. Real volume growth in 2018 after inflation is expected to be near 2% or only $26 billion. That would mean the need, if there are no changes in productivity, is to add only about 130,000 additional jobs in 2018, a rate of growth that is well within reach. That is less than the average jobs growth for the last seven years.
Construction added 1,400,000 jobs in the last 5 years, an average of 280,000/year. The only time in history that exceeded jobs growth like that was the period 1993-99 with the highest 5-year growth ever of 1,483,000 jobs. That same 1993-99 period had the previous highest 5-year spending and volume growth going back to 1984-88.
Total spending increased 60%+ since 2010, but with 30% inflation. Real total volume since 2010 has increased by only about 30%. Jobs also increased by 30%, in balance with need. But the results are much different for Residential than Nonresidential.
Nonresidential spending increased 50% since 2010 with 35% inflation. Nonresidential volume since 2010 has increased by only 15%. Jobs increased by 27%, 12% in excess of volume growth.
Residential spending increased by 125% since 2010, but after 40% inflation, real residential volume increased by 85%. Jobs increased by only 40%, 45% short of volume growth.
Residential construction labor cannot be directly compared to residential volume because
- Some residential high-rise jobs, for example structure, are performed by firms whose primary activity is commercial construction. Those jobs are classified as nonresidential.
- Buildings that are multi-use commercial retail and residential, even lo-rise, may be built by contractors whose firms are classified nonresidential labor. The construction spending would be broken out to residential and nonresidential, but the labor would not.
- Some residential immigrant labor is not counted
For these reasons, it is best to simplify comparisons of spending activity to total labor.
For more on Jobs see Construction Jobs and Residential Construction Jobs Shortages
New Construction Starts
New construction starts for the six months in the 1st half 2018 reached an all-time high.
New Construction Starts three-month average for May-Jun-Jul is $840 billion, all-time high.
Year-to-date (YTD) 2018 starts are currently reported as up only 2% from 2017, but 2017 starts through September have already been revised up by 9%, 10% in nonresidential buildings, 16% in non-buildings and 3% in residential. 2018 starts will not be revised until next year. Revisions have always been up.
Revisions for the last 10 years averaged more than +7%/yr., with most of the upward revision in nonresidential buildings. Revisions to nonresidential buildings have been greater than 10%/year for the last 7 years. Therefore, 2018 starts growth is very likely under-reported.
All construction starts data in this report references Dodge Data & Analytics Starts Data.
Dodge releases its first forecast of next year’s starts every year in the 4th quarter. Last year the first forecast for 2018 was for starts to increase 3% to $765 billion. 2018 starts, based on data as of September, could reach $806 billion, but at first appearing to show no gain from 2017. That’s because 2017 has already been revised up by $50 billion. After 2018 revisions are posted next year, 2018 starts could reach $830-$840 billion. Dodge forecast 2019 starts at $808 billion, no change from 2018. This will be subject to two upward revisions.
- Previous year starts always later get revised upwards. Therefore, current year starts YTD growth is always understated. This analysis compensates for that.
- New starts will generate record high starting backlog for every sector in 2019.
- Even a low forecast for starts in 2019 produces record backlog for 2020.
For nonresidential buildings spending, long duration jobs can sometimes have a 5 to 6-year schedule. On average most years have at least some projects start that will be under construction for 4 years. For an entire year’s worth of starts, approximately 20% of the spending occurs in the year started, 50% in the next year, 25% in the third year and only 5% in the fourth year or later year. Residential starts contribute spending into the third year. This means that nonresidential spending growth in 2019 is still being affected by starts from 2016 and residential growth from starts in 2017. This also means that nonresidential spending growth in 2019 is still being affected by starts from 2016.
The next two plots show the 3-month moving average and trend line of starts for Residential and Nonresidential Buildings. Starts can be erratic from month to month. The trend line gives a better impression of how starts impact spending. It is the rate of change in starts cash flows that provides a predicting tool for spending.

The plot below is an index. The plot shows greater accuracy in the forecast when the slope of the predicted cash flow and actual spending plot lines move in the same direction. It’s not the spread between the lines that gives any indication. If the slope of the lines is the same, then the cash flow accurately predicted the spending.
The light green line for nonresidential buildings spending estimated from starts cash flow shows smooth spending, even though actual monthly starts are erratic (see nonres bldgs plot shown above). The actual spending often follows close to the pattern estimated from cash flows.

Starts are sometimes misinterpreted in common industry forecasting articles. Starts dollar values represent a survey of about 50% to 60% of industry activity, therefore Starts dollar values cannot ever be used directly to indicate the volume of spending. Also, Starts do not directly indicate changes in spending per month or per year. Only by including an expected duration for all Starts and producing a forecast Cash Flow from Starts data can the expected pattern of spending be developed. Finally, it is the rate of change in Starts Cash Flows that gives an indication of the rate of change in spending.
Starting Backlog
Nonresidential Buildings starting backlog at the beginning of 2018 reached an all-time high. For nonresidential buildings this backlog will contribute spending until the end of 2021. 2019 Backlog is forecast to increase 8%. For purposes of this analysis, I’ve set only moderate or low increases in starts for 2020 and 2021, so this forecast may hold down the future backlog and spending forecast. However, backlog leading into 2019 is up 70% in 5 years.
Starting Backlog is the Estimate-to-Complete (ETC) value of all projects under contract at the beginning of a period. Projects in starting backlog could have started last month or last year or several years ago.
- 75%-80% of all Nonresidential Buildings spending within the year will be generated from projects in starting backlog.
- 80%-85% of all Non-Building Infrastructure spending within the year will be generated from projects in starting backlog.
- 70% of All Residential spending within the year is generated from new starts, but this is weighted because 85% of all residential work is short duration single family and renovation work.
- 65% on long duration Multifamily Residential spending within the year will be generated from projects in starting backlog.

Non-building Infrastructure starting backlog at the beginning of 2018 reached an all-time high. Some of this is very long-term work that will contribute spending until the end of 2025. In fact, more than half of all spending in 2019 comes from projects that started prior to Jan 2018. 2019 Backlog is forecast to increase 10%. Backlog is up 45% in 5 years but is up 50% in just the last 3 years.

Multifamily residential has a longer duration and a greater percentage of spending comes from backlog. But, due to the shorter duration of projects, about 75% of single family and residential renovation spending within the year is generated from new starts. Unlike nonresidential, backlog does not contribute nearly as much short-term residential spending within the year.
Cash Flow
Simply referencing total new starts or backlog does not give an indication of spending within the next calendar year. Projects, from start to completion, can have significantly different duration. Whereas a residential project may have a duration of 6 to 12 months, an office building could have a duration of 18 to 24 months and a billion-dollar infrastructure project could have a duration of 3 to 4 years. New starts within any given year could contribute spending spread out over several years. Cash flow totals of all jobs can vary considerably from month to month, are not only driven by new jobs starting but also by old jobs ending, and are heavily dependent on the type, size and duration of jobs.
Cash flow from all starts still in backlog supports a 2018 spending forecast of $1,321 billion, a spending increase of 6.0% over 2017. The forecast for 2019, based on a minimal increase in starts, is $1,341 billion, an increase of only 1.5% over 2018. Dodge initial November 2018 forecast for 2019 construction starts is for $808 billion, no gain over 2018. However, subsequent revisions may increase that a few percent.
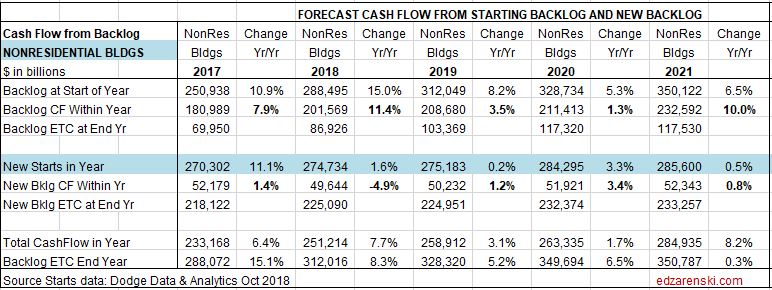
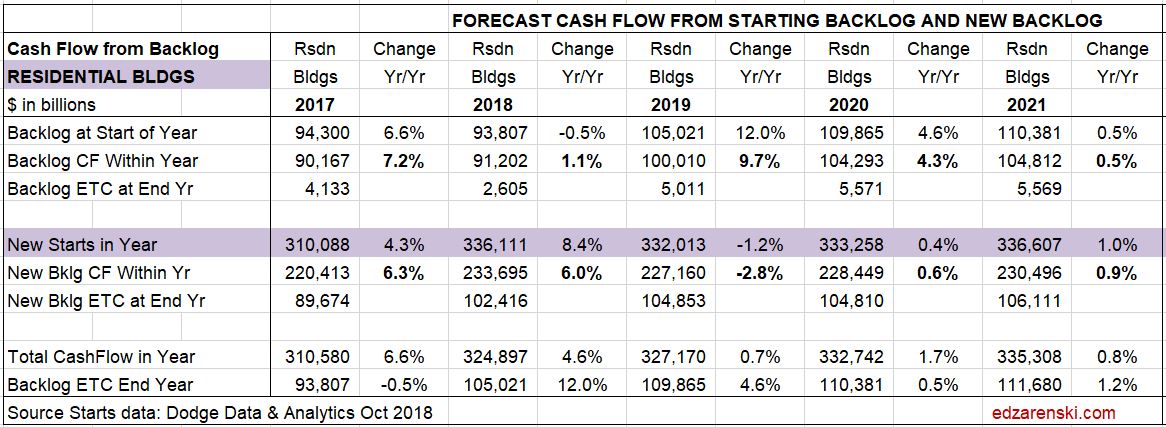
The following table illustrates the difference between Starts and Cash flow. It shows Manufacturing Bldgs. projects in backlog as of October 2018 and predicted starts in 2018 through 2021. Note there are sometimes vast differences between amounts of Starts, whether already in Backlog at beginning of year or New Starts within the year, and Cash Flow from Backlog and New Starts.
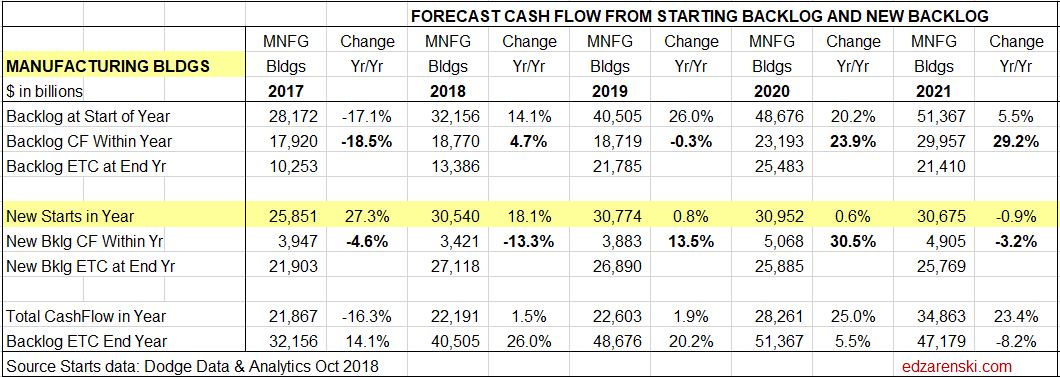
Cash Flow modeling predicted a huge decline of -16% in manufacturing spending in 2017. This was in stark contrast to seven other economic analysts who predicted spending would be between -7% and +7%, for an average of +0.4% as reported in the January 2017 AIA Consensus. Manufacturing spending actually ended the year at -13.0%. Obviously, there is no correlation between a 25% increase in new starts within the year and a predicted -16% drop in spending. The actual -13% drop in 2017 spending reflects a return to normal after an unusually large volume of spending in 2015 and 2016 that was generated by a record volume of starts in 2014.
Note that new manufacturing starts were up 27% in 2017 and could be up 18% in 2018, yet 2018 spending is forecast to increase only 1.5%. This is due to projects that started several years ago but are now coming to an end. They are dropping out of the monthly cash flows and holding down 2018 spending even though starts have been up substantially for two years. This substantial volume of new starts in 2017 and 2018 will be providing a boost to spending in 2020 and 2021.
Spending
Total of All construction spending is forecast to increase 6.0% to $1.321 trillion in 2018 and 1.5% to $1.341 trillion in 2019 and 6.3% to $1.426 trillion in 2020.

Construction spending is strongly influenced by the pattern of continuing or ending cash flows from the previous two to three years of construction starts. Current month/month, year/year or year-to-date trends in starts often do not indicate the immediate trend in spending.
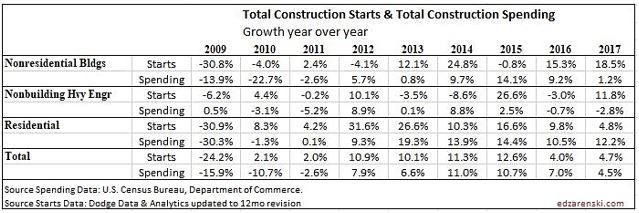
The following table clearly shows there is not a correlation between starts in any year with spending in either the current or the following year. The practice of using construction starts directly to predict spending can be very misleading in an industry that relies on data for predictive analysis to plan the future. Not only does it not predict the volume of spending in the following year, it does not even consistently predict the direction spending will take, up or down, in the following year. It’s a false indicator and it’s not a good use of data.
Residential Buildings Spending
Residential construction spending for 2018 was recently revised down and starts for 2019 are expected flat to down slightly. The forecast is now for an increase of 5.6% to $562 billion in 2018, 0.5% to $564 billion in 2019 and 2.3% to $577 billion in 2020.
Residential spending in 2018 slows after six years of growth all over 10%/year. Average spending growth the last seven years is 12%/year. Although Residential 2019 construction spending is still increasing slightly 0.5%, growth has slowed to less than inflation of 5%. Therefore real 2019 residential volume after inflation is forecast to decline by 4%+, the largest real volume decline since 2009. In 2018 residential spending increased 5.6%, but after inflation real volume increased only a fraction of a percent.
Residential spending in 2018 is 50% single family, 13% multi-family and 37% improvements. In 2011, improvements were 48% of residential spending.
Single Family Residential spending is more dependent on new starts within the most recent 12 months than on backlog from previous starts.

Total starts for the last 6 months are the highest since 2006, but % growth has slowed considerably. New starts in 2017 which initially posted only 2% growth have already been revised up to 4%. I expect that to be revised up to 5%. Growth of 7% is expected for 2018. Slower growth is now expected after 5 years (2012-2016) of starts increasing at an average 20%/year. Multi-Family Residential spending is more dependent on backlog.

Residential spending hits a 12-year high in 2018. Residential spending reached a current $ peak of $630 billion in 2005. 2018 pending is still 10% below that peak. In constant $, adjusted for inflation, all years from 1998 through 2007 were higher than 2018. In constant $, 2018 spending is still 27% below the 2005 peak.

Nonresidential Buildings Spending
Nonresidential Buildings construction spending is forecast to increase 5.8% to $444 billion in 2018, dip -0.2% to $443 billion in 2019 and climb 8.9% to $482 billion in 2020. Office (which includes data centers) and Amusement/Recreation support the 2019 but there is downward pressure from slowdowns or timing of cash flow in Manufacturing, Lodging, Healthcare and Educational. Educational, Healthcare, Recreation, Office and Manufacturing all support growth in 2020.


Nonresidential buildings construction spending in constant $ (inflation adjusted $) reached as high as $440 billion in 2017 but averaged only $419 billion in 2017. In 2018 it will reach a high of $430 billion but average only $424 billion. The yearly average recently peaked at $431 billion in 2016. Constant $ spending or real volume growth shows all years from 1996 through 2010 had higher volume than the 2018 forecast. Volume reached a peak $536 billion in 2000 and went over $500 billion again in 2008. In constant $ 2018 is still 20% below that 2000 peak.
Non-building Infrastructure Spending
Non-building Infrastructure construction spending is forecast to increase 7.2% to $316 billion in 2018, 5.5% to $334 billion in 2019 and 9.9% to $367 billion in 2020. The forecast growth for 2019 will be supported by Transportation and Public Works but will be held down somewhat by Highway. Transportation terminals and rail project starts both increased more than 100% in 2017 and both are long duration projects types that will contribute spending for several years. Environmental Public Works had strong 20% growth in 2018 starts and Highway starts hit a new high in 2018.
Non-building Infrastructure construction spending in constant $ (inflation adjusted $) reached $311 billion in 2016, an all-time high, but then dropped to $296 billion in 2017. In 2018 it will reach $302 billion. Constant $ spending or real volume growth has been within +/- 3% for the last 5 years.

Non-building Infrastructure spending, always the most volatile sector, in mid-2017 dropped to 2013 lows. However, this short dip was predicted. Cash flow models of Infrastructure starts from the last several years predicted that dips in monthly spending would be caused by uneven project closeouts from projects that started several years ago, particularly in Power and Highway markets.

Current backlog is at an all-time high, up 10%+ each of the last 3 years, and spending is expected to follow the increased cash flows from the elevated backlog. Transportation terminals new starts in 2017 jumped 120%. Rail project starts increased more than 100%. Starting backlog for all transportation work is the highest ever, up 100% in the last two years. Transportation spending is projected to increase 20-25%/year for the next two years.
No future growth is included from infrastructure stimulus and yet 2018 spending is projected to increase by 8%. 2019 and 2020 are forecast to increase 5% to 6%.
Public Infrastructure and Public Institutional
Less than 60% of all Non-building Infrastructure spending, about $170 billion, is publicly funded. That public subset of work averages growth of less than $10 billion/year.
About 25% of all Nonresidential Buildings spending, about $110 billion, is publicly funded, mostly Educational. Nonresidential buildings spending makes up almost 40% of Public spending.
- Infrastructure = $300 billion, ~25% of all construction spending.
- Infrastructure is about 60% public, 40% private. In 2005 it was 70% public.
- Public Infrastructure = $170 billion. Private Infrastructure = $130 billion.
- Power and Communications are privately funded infrastructure.
- Nonresidential Buildings is 25% public (mostly institutional), 75% private.
- Educational, Healthcare and Public Safety are Public Nonres Institutional Bldgs
- Public Commercial construction is not included.
- Public Institutional = $100 billion, mostly Education ($70b).

Public Infrastructure + Public Institutional = $280 billion, 23% of total construction spending.
Public Infrastructure + Institutional average growth is $12 billion/year. It has never exceeded $30 billion in growth in a single year.
See also Publicly Funded Construction
See also Down the Infrastructure Rabbit Hole
Public Spending
Total public spending for 2018 is projected to finished up 9.5% at $320 billion. Every major public market is projected to finish up for 2018. By far, the largest Public spending increases for 2018 are Highway, Transportation, Sewer and Waste Disposal and Water Supply.

The two largest markets contributing to public spending are Highway/Bridge (32% of total public spending) and Educational (25%), together accounting for nearly 60% of all public construction spending. At #3, Transportation is only about 10% of public spending. Environmental Public Works combined makes up almost 15% of public spending, but that consists of three markets, Sewage/Waste Water, Water Supply and Conservation. Office, Healthcare, Public Safety and Amusement/Recreation each account for about 3%.
Educational is 80% public, Transportation 70%, Amusement/Rec 50% and Healthcare 20% public. Power is about 6% public, along with few other smaller shares.
Public spending hit a 4-year low in mid-2017. It has been increasing since then and is now near an all-time high. I’m expecting to see strong growth through 2020.
Due to long duration job types, 2018 starting backlog is up 30% in the last 3 years. In 2018, 40% of all spending comes from jobs that started before 2017. Leading 2018 growth are Educational (+15%) and Transportation (+35%), with a combined total forecast 20% growth in public spending.
Current levels of backlog and predicted new starts gives a projection that Public Non-building Infrastructure spending will reach an all-time high in 2018 and again in 2019.

For a Full Formatted PDF of this Report click
2019 Construction Economic Forecast – Summary – Dec 2018
Link to the 2019 Nonresidential Forecast Report
2019 Construction Economic Forecast – Nonresidential – Nov 2018

2018 Construction Spending Forecast – Mar 2018
3/15/18
Preliminary data is in for total year 2017 construction spending, 2017 construction starts and 2018 starting backlog. The following forecast is developed using the current data.
2018 Construction Spending Forecast – Mar 2018
A brief note on 2017.
2017 Spending Wrap Up
Total construction spending in 2017 now stands at $1.233 trillion, an increase of 4.0% over 2016.
Residential spending, up 10.5% for the fifth consecutive year above 10% growth, leads all construction spending in 2017 for the seventh consecutive year. Nonresidential Buildings finished the year up 2.3%. Only Non-building Infrastructure did not improve over 2016, down 3.8% for the year. However, Non-building Infrastructure had been at an all-time high for the previous two years.
2017 spending finished below my forecast due to performance in Educational, Office, Power and Highway, four of the five largest markets which together make up half of all nonresidential spending. All came in lower than forecast. However, some of these markets are prone to very large post-annual upward revisions and that has the potential to add to 2017 spending when those revisions are released in July 2018. For instance, in the July 2017 revisions, Power spending for the previous year, 2016, was revised up by 10%.
History shows spending has been revised up 53 times in the last 60 months. I expect to see future revisions smooth out spending in unusually low periods and increase total 2017 spending above this forecast. Both April and July preliminary spending appear statistically too low. The average post-annual total spending revision for the last five years is +2.8%. The post-annual revision to 2016 was only 2.2%. Revisions due for release on July 1, 2018, if even only a +1% revision to 2017, would adjust total 2017 spending up to $1,245 billion. This would slightly alter the 2018 forecast.

2018 Spending Total All Construction
Total All 2018 construction spending is forecast to increase 7.6% to $1.330 trillion.
Nonresidential Buildings spending forecast for 2018, up 9%, will be supported by Manufacturing and Educational. Non-building Infrastructure returns to strong growth of 8%, with potential to hit a new all-time high due to very large projects in Power and Transportation. Residential spending in 2018 slows to growth under 6% after six years all over 10%/year.
Dodge Data 2017 construction starts increased 3% from 2016. However, starts are always revised upward in the following year. I expect revisions will show 2017 starts increased by more than 6% over 2016. Even with that revision, 2017 starts posted the lowest growth since 2011, weighted heavily by the slowdown in residential starts.
Total starting backlog for 2018, currently at an all-time high, has increased on average 10%/year the last three years. 80% of all Nonresidential spending within the year will be generated from projects in starting backlog. Public share of new construction starts are up only 10% in 3 years. But due to long duration job types, 2018 starting backlog is up 30% in the last 3 years.
None of this spending forecast includes any projections for potential work from future infrastructure stimulus.
Current$ vs Constant$
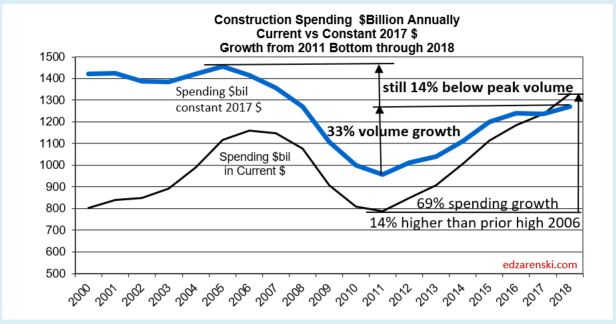
Construction spending reached a new current $ high in 2017 at $1,236 billion. The previous high in current $ was $1,161 in 2006. Spending first surpassed that in 2014 and has been increasing since. But that is in current $, which includes inflation.
Comparing current $ spending to previous year spending does not give any indication if business is increasing. The inflation factor is missing. If spending is increasing at 4%/year in a time when inflation is 6%/year, real volume is declining by 2%.
Although 2018 current $ spending will reach $1,330 billion, after adjusting for 4.5% to 5% inflation, 2018 constant $ volume will increase to only $1,270 billion. When comparing inflation adjusted constant dollars, 2018 spending will still be lower than all years from 1998 through 2007. In 2005 constant $ volume reached a peak at $1,450 billion. At current rates of growth, we would not eclipse the previous high before 2022.
While spending in current $ is 7% higher than the previous high spending, volume is still 14% lower than the previous high volume.
For more on Inflation Adjusted spending see Construction Spending is Back
Jobs and Volume
The period 2011-2017 shows both spending and jobs growth at or near record highs.
A spending forecast of 7%+ in 2018, or nearly $100 billion in construction spending, demands a few words on jobs growth. Construction requires about 5000 workers for every added $1 billion in construction volume. Construction jobs have never increased by 500,000 in one year. However, $100 billion in added spending is not the same as $100 billion in volume, and jobs growth is based on volume.
Although spending will increase 7%-8%, construction inflation has been hovering near 4.5% to 5% for the last five years. Real volume growth in 2018 after inflation is expected to be near 3% or $40 billion. That would mean the need, if there are no changes in productivity, is to add only about 200,000 additional workers in 2018, a rate of jobs growth that is well within reach. That is less than the average jobs growth for the last seven years.
Construction added 1,339,000 jobs in the last 5 years, an average of 268,000/year. The only time in history that exceeded jobs growth like that was the period 1993-99 with the highest 5-year growth ever of 1,483,000 jobs. That same 1993-99 period had the previous highest 5-year spending and volume growth going back to 1984-88.
Construction added 185,000 jobs in the last 4 months, Nov17-Feb18. That’s happened, for any 4-month period, only 5 times since 1984. The last time was 2005-06, during the fastest rate of spending increases since 1984.
Total all spending increased 55% since 2010, but there was 30% inflation. Real total volume since 2010 has increased by only 25%. Jobs increased by 30%, 5% in excess of volume growth. But the results are much different for Residential than Nonresidential.
Nonresidential spending increased 43% since 2010, but there was 30% inflation. Real nonresidential volume since 2010 has increased by only 12%. Jobs increased by 27%, 15% in excess of volume growth.
Residential spending increased by 110% since 2010, but after inflation, real residential volume increased by only 57%. Jobs increased by only 37%, 20% short of volume growth.
For more on Jobs see Construction Jobs and Residential Construction Jobs Shortages
Residential Buildings Spending
Total Residential spending in 2017 finished at $523 billion, up 10.6% from 2016. This is the 5th consecutive year that residential spending exceeded 10% annual growth. Average spending growth the last six years is 13%/year.
Residential spending in 2017 was 50% single family, 13% multi-family and 37% improvements. In 2011, improvements was 48% of residential spending.
Census does not include flood damage repairs (house shell remains intact but gut renovate) in improvements but does include full flood damaged structure replacements (structure rebuild permit classified as new) in improvements.
Residential spending is more dependent on new starts within the most recent 12 months than on backlog from previous starts. Total starts for the last 6 months are the highest since 2006, but % growth has slowed considerably. New starts in 2017 posted only 2% growth, but I expect that to be revised up to at least 4%. Similar growth of 6%-7% is expected for 2018. Slower growth is now expected after 5 years (2012-2016) of new starts increasing at an average 20%/year.

Residential 2018 spending growth is forecast to increase only 6% after five years over 10%. Total residential spending in 2018 is forecast at $552 billion.
Residential spending will reach a 12-year high in 2018. Residential spending reached its current $ peak of $630 billion in 2005. Current 2018 pending is still 13% below that peak. In constant $, adjusted for inflation, all years from 1998 through 2007 were higher than 2018. In constant $, 2018 spending is still 27% below the 2005 peak.
Residential buildings construction spending in constant $ reached $523 billion in 2017. Previous spending adjusted to equivalent 2017$ shows that all years from 1996 through 2007 had higher volume than 2017. Volume reached a peak $748 billion in 2005. Only the years 2004-2006 had higher spending in current $. The 2005 current $ peak of $630 billion is still 17% higher than 2017, but 2017 volume is still 30% lower than peak volume.

Nonresidential Buildings Spending
Nonresidential Buildings spending in 2017 finished at $419 billion, up only 2.7% from 2016.
2017 spending finished below my forecast due to performance in Educational and Office. Educational starts increased 6%+/year for the last three years, but spending increased only 4%/year the last two years. Office starts increased nearly 30% in 2016, but spending increased only 3% in 2017. I suspect either big upward revisions to 2017 spending or large increases in backlog will boost 2018 spending in these two markets.

Nonresidential Buildings new starts are up 60% in four years. 2018 starting backlog is the highest ever, up 15% from 2017. Nonresidential Buildings 2018 starting backlog is 50% higher than at the start of 2014, the beginning of the current growth cycle.

Starting backlog has increased for five years at an average 10%/year. Spending from starting backlog, up 10% in 2018, increased for five years at an average 9%/year.
For 2018, Educational spending is projected to increase 14%, the best increase since 2007. Starting backlog increased 10%/year for the last three years. Manufacturing posted several very large project starts in 2017. Spending is projected to increase 12% in 2018.
Nonresidential Buildings spending in 2018 is forecast to reach a new high, $459 billion, an increase of 9.5% over 2017, surpassing the previous 2008 high. Educational and Manufacturing make up 55% of the growth.
For the Full Expanded 2018 Construction Spending Forecast – Nonresidential Bldgs
Nonresidential buildings construction spending in constant $ (inflation adjusted $) reached $419 billion in 2017. In 2018 it will reach $439 billion. Constant $ spending shows all years from 1996 through 2010 had higher volume than the 2018 forecast. Volume reached a peak $536 billion in 2000 and went over $500 billion again in 2008. In constant $ 2018 is still 18% below that 2000 peak.

Non-building Infrastructure Spending
Total non-building infrastructure spending in 2017 dropped to $293 billion, down 3.7% from 2016.
Non-building Infrastructure spending, always the most volatile sector, dropped to yearly lows from June through September, the lowest since November 2014. However, this short dip was predicted. Cash flow models of Infrastructure starts from the last several years predicted that dips in monthly spending would be caused by uneven project closeouts from projects that started several years ago, particularly in Power and Highway markets.

Current backlog is at an all-time high and spending is expected to follow the increased cash flows from the elevated backlog. Environmental Public Works (Sewage/Waste disposal down 14%, Water Supply down 9% and Conservation/Dams & Rivers down 7% in 2017) posted the largest declines in 2017 and accentuated the declines in the infrastructure sector. The sector was expected to increase in the last quarter 2017. All three markets posted increases in the 4th quarter, up 8% over the 1st nine months of 2017.
Non-building Infrastructure 2018 starting backlog is the highest ever, up 10%+ each of the last 3 years. Transportation terminals new starts in 2017 jumped 120%. Rail project starts increased more than 100%. Starting backlog for all transportation work is the highest ever, up 100% in the last two years. Transportation spending is projected to increase 20-25%/year for the next two years.
No future growth is included from infrastructure stimulus and yet 2018 spending is projected to increase by 8%.

Non-building Infrastructure will reach a new high for spending in 2018. Spending reached an all-time high in 2015 and stayed within 0.3% of that high for 2016. A 3.5% decline in 2017 was more of a decline than expected, but there may still be upward revisions to the preliminary total.
Non-building Infrastructure spending in 2018 is forecast to reach $319 billion, an increase of 8.6% over 2017.
My forecast for 2018 is predicting every infrastructure market will post gains, but it is the Power and Transportation markets that account for most of the growth in 2018. Transportation new starts in 2017 grew 120% due to massive new air terminal and rail projects. Spending growth in the Power market is not quite so apparent. Combined Power new starts are down for both 2016 and 2017, but the spending gains are coming from projects that started in 2015, a year in which starts were up over 120%.
Adjusted for inflation, spending in 2018 will be nearly equal to the all-time highs reached in 2015 and 2016.
Non-building Infrastructure construction spending in constant $ reached $294 billion in 2017. Recent highs were posted in 2015 and 2016 at $305 billion and $304 billion and 2018 is expected to reach $319 billion. Previous spending adjusted to equivalent 2017$ shows that 2008 and 2009 were both just slightly higher than $300 billion. Constant $ volume reached a peak $313 billion in 2016. Spending in current $ hit new highs in 2015 and 2016. This is the only sector that has current $ and constant $ at or near all-time highs.

Public Infrastructure and Public Institutional
Only 60% of all Non-building Infrastructure spending, about $170 billion, is publicly funded. That public subset of work averages growth of less than $10 billion/year.
Only about 25% of all Nonresidential Buildings spending, about $100 billion, is publicly funded, mostly Educational.
- Infrastructure = $300 billion, 25% of all construction spending.
- Infrastructure is about 60% public, 40% private. In 2005 it was 70% public.
- Public Infrastructure = $170 billion. Private Infrastructure = $130 billion.
- Power and Communications are privately funded infrastructure.
- Nonresidential Buildings is 25% public (mostly institutional), 75% private.
- Educational, Healthcare and Public Safety are Public Nonres Institutional Bldgs
- Public Commercial construction is not included.
- Public Institutional = $100 billion, mostly Education ($70b).

Public Infrastructure + Public Institutional = $270 billion, 23% of total construction spending.
Public Infrastructure + Institutional average growth is $12 billion/year. It has never exceeded $30 billion in growth in a single year.
See also Publicly Funded Construction
See also Down the Infrastructure Rabbit Hole

Public Spending
Public construction is a subset of Nonresidential Buildings and Non-building Infrastructure and about 1% of Residential.
The two largest markets contributing to public spending are Highway/Bridge (32% of total public spending) and Educational (26%), together accounting for nearly 60% of all public construction spending. At #3, Transportation is only about 10% of public spending. Environmental Public Works combined makes up almost 15% of public spending, but that consists of three markets, Sewage/Waste Water, Water Supply and Conservation. Office, Healthcare, Public Safety and Amusement/Recreation each account for about 3%.
2017 spending was down 1%, but has been at or near the all time high for three years.
Total public spending for 2017 finished flat at $284 billion with most major public markets down for the year. By far, the largest Public spending declines in 2017 are Sewer and Waste Disposal which is 7% of public markets, it was down 16% and Highway/Bridge, down only 3.5%, but Highway is 32% of all public spending.
Public spending hit a low in June 2017. It has been increasing since then, Public Educational, in the second half 2017 up 10% from the low point, now at a post recession high. We can expect to see another six months of growth before spending levels off in mid-2018.
Due to long duration job types, 2018 starting backlog is up 30% in the last 3 years. In 2018, 40% of all spending comes from jobs that started before 2017. Leading 2018 growth are Educational (+15%) and Transportation (+35%), with a combined total forecast 20% growth in public spending.
Current levels of backlog and predicted new starts gives a projection that Public Non-building Infrastructure spending will reach an all-time high in 2018 and again in 2019.
Total Public spending in 2018 is forecast to reach $307 billion, an increase of 8% over 2017, the best growth in 10 years.
Educational and Transportation will contribute equally and together account for almost 60% of the Public spending growth in 2018. Transportation new starts in 2017 grew 120% due to massive new air terminal and rail projects. Educational new starts total for the last three months posted the highest quarter in at least seven years. The 2nd highest quarter was also within the last 12 months, so still contributes fully to 2018 spending. 2018 signifies a turn-round in Public spending which has not posted significant growth since the recession.

Public spending is 10%, $30 billion, below 2009 all-time highs, most of the deficit coming from declines in Educational, Sewage/Waste Water and Water Supply. In 2018, Highway and Transportation are at all-time highs.
Click here for a formatted printable PDF Construction Spending Forecast – Summary Mar 2018
See these posts for additional info
2018 Construction Spending Forecast – Nonresidential Bldgs
Starts Trends Construction 2018 Forecast – Fall 2017 11-8-17
Backlog Construction 2018 Forecast – Fall 2017 11-10-17
For more on Jobs see Construction Jobs / Workload Balance 11-7-17
For effects of inflation see Constant Dollar Construction Growth 11-2-17
Construction Activity Notes 4-25-18
Notes on March 2018 Construction Spending

Publicly Funded Construction
2-28-18
- What types of construction might get funded by Infrastructure stimulus?
- How big is the Infrastructure construction market?
- What share of Infrastructure is Public work?
- What other types of work are publicly funded?
- How much new stimulus work can be added to current backlog?
- Total all construction spending in 2017 will be about $1.240 trillion.
- Infrastructure = $300 billion, 25% of all construction spending.
- Infrastructure is about 60% public, 40% private. In 2005 it was 70% public.
- Public Infrastructure = $170 billion. Private Infrastructure = $130 billion.
- Power and Communications are privately funded infrastructure.
- Nonresidential Buildings is 25% public (mostly institutional), 75% private.
- Educational, Healthcare and Public Safety are Public Nonres Institutional Bldgs
- Public Commercial construction is not included.
- Public Institutional = $100 billion, mostly Education ($70b).
Total Public Infra + Institu = $270 billion, 23% of total construction spending.
The potential target markets for an infrastructure stimulus plan could range from the $170 billion public civil infrastructure market up to a total $270 billion market that includes public institutional work. All of these types of projects may not get funded. Then again, Communications, which is 99% private and not included here, has been considered to receive some stimulus funding (rural broadband).

Total All Construction spending, all public + private construction, has average growth of $50 billion/year. Adding $100 billion of spending in a single year, from all sources public and private, is the maximum level of growth for the entire construction industry.
Public Infrastructure + Institutional average growth is $12 billion/year. It has never exceeded $30 billion in growth in a single year.
Public Infrastructure best growth (highest for at least 3 consecutive years, and in almost all cases was from 2005-2007) over the last 15 years, averages 10%/year. For Sewer, Water, Conservation and Communications that’s equivalent to adding only $1 bil to $2 bil per year. For Transportation it’s $4 bil/yr and for Highway it’s $8 bil/yr. For Public Institutional, Educational it’s $8 bil/yr. and other institutional about $2 bil/yr. If all these could hit best ever averages at the same time then Infrastructure spending would grow $25-$30 billion/year.
Spending growth from work already in record backlog for public infrastructure + institutional is predicted to increase by $10-$20 billion/yr. in each of next several years. Transportation alone for the next two years is increasing by more than $10 billion/year. Adding $15-$20 billion/year more in spending for an infrastructure expansion plan would push total public work well above record levels, at least for the next three years. That is probably not sustainable.
Public infrastructure and institutional, only 23% of the entire industry, can probably only absorb another $10 billion of new growth per year on top of the predicted growth. That would push growth to $20-$25 billion/year, near record growth in each of the next three years.
For every $10 billion a year in added infrastructure spending, that also means adding about 40,000 new construction jobs per year.
Average post-recession growth in public infrastructure + institutional jobs is about 35,000 jobs per yr. Max growth was 50,000 jobs/yr. Historical maximum jobs growth would seem to limit spending growth to a total of about $15 billion/year. That is the amount of spending already predicted from work in backlog, without adding any more work from an infrastructure stimulus plan.
Because the potential markets to which stimulus might be applied are relatively small in comparison to all construction, and because those markets identified are already at record backlog, both historical maximum spending growth and jobs growth identify potential limits on infrastructure stimulus growth. Those limits are much lower than generally thought.
This article has more on the same topic Down the Infrastructure Rabbit Hole 2-16-18
Read more Details Behind The Headlines – Infrastructure 3-23-17

Down the Infrastructure Rabbit Hole
2-16-18
Down the Infrastructure Rabbit Hole. A twitter thread on construction capacity.
The infrastructure sector is only 25% of all construction spending, with the largest share being the Power market. Power accounts for 33% of all infrastructure spending. Highway represents 30% and Transportation about 15%. However, Power is 80% private, Transportation 30% private.
Only 60% of all Infrastructure spending is publicly funded. Highway is about half of all publicly funded Infrastructure construction. That public subset of work in the last 25 years has grown by $20 billion/year only once and averages growth of less than $10 billion/year.
Most public work is Infrastructure or public works projects, about 60%, but some public work is nonresidential buildings, about 40%. Public Safety is 100% public. Educational projects are 80% public. Amusement/Recreation Facilities (i.e.’ Convention Centers, Stadiums) is 50% public. Healthcare is 20% public.
The two largest markets contributing to public spending are Highway/Bridge (32%) and Educational (26%), together accounting for nearly 60% of all public construction spending. At #3, Transportation is only about 10% of public spending.
Sewage/Waste Water and Water Supply add up to another 10% of the market. All other markets combined, Conservation and all other various nonresidential buildings, none more than 4% of the total, account for less than 20% of public spending.
It is rare that Nonbuilding Public Infrastructure construction spending increases by more than $10 billion in a year. Once, only once, it increased by an average of $10 billion/year for three years. Excluding recession, average annual growth is $4 billion/year.
It is rare for Total All Public Infrastructure to increase by $20 billion in a year. It has done so only ever twice. Excluding the two worst recession years, the average annual growth since 2001 is $7 billion/year.
For every $10 billion a year in added infrastructure spending, that also means adding about 40,000 to 50,000 new construction jobs per year.
Infrastructure construction spending is near all-time highs and has been for the last several years. Public spending is 10% ($30bil) below all-time highs, the largest deficits coming from Educational, Sewage/Waste Water and Water Supply.
Either an infrastructure spending plan is used to create new work or it becomes a funding source to pay for work already planned, in which case it does not increase spending or jobs projections.
As proposed, states and municipalities would be required to come up with 80% of the funding for any new infrastructure project to qualify for 20% of funding from the federal government, potentially shifting the bond funding tax burden to states.
Alternatively, states could solicit private partnership funding, in which case what would normally be considered public assets could become privately controlled assets. This raises a whole new list of issues for discussion, not engaged here.
Infrastructure currently has the highest amount of work in backlog in history. Public work is at its 2nd highest starting backlog only to 2008. Starting backlog accounts for 80% of spending in the current year and 60% of spending in the following year.
Current levels of backlog and predicted new starts gives a projection that Public Nonbuilding Infrastructure spending will reach an all-time high in 2018 and again in 2019.
Total All Public Infrastructure in 2018 also reaches an all-time current$ spending high. However, in constant$, inflation adjusted, volume of work is still well below previous peak.
The non-building infrastructure construction sector does not have the capacity to increase spending over and above existing planned (booked and projected new starts) work by another $10 billion/year, nor does it have the capacity to add an additional 40,000 jobs per year.
Total All Public Infrastructure construction, including public works and Nonresidential public buildings, already has a growth projection near historic capacity. It cannot double that volume by another $10-$20 billion/year and add an additional 40,000 – 80,000 jobs per year.
Below is the timeline of my articles series on Infrastructure. Some of the numbers have changed slightly over the past year, but not enough to change the premise of the articles.
2-28-18 Publicly Funded Construction
2017/12/03 spending-summary-construction-forecast-fall-2017
2017/11/11 backlog-construction-forecast-fall-2017
2017/10/10 is-infrastructure-construction-spending-near-all-time-lows
2017/03/23 behind-the-headlines-infrastructure-spending-&-jobs
2017/03/06 calls-for-infrastructure-problematic
2017/03/05 infrastructure-public-spending

Spending Summary Construction Forecast Fall 2017
3-15-18 see also 2018 Construction Spending Forecast – Mar 2018
12-2-17
Summary
Total construction spending in 2017 will reach $1,236 billion, an increase of 4.2% over 2016. Residential spending is above 10% growth for the 5th consecutive year.
Year-to-date construction spending growth through October is 4.1%.
Residential leads construction spending growth in 2017 for the seventh consecutive year, up 10.6%. My Nonresidential Buildings forecast has been lowered since July but finishes the year up 2.8%. Only Non-building Infrastructure will not improve over 2016, down 3.7% for the year. However, Non-building Infrastructure has been at an all-time high for the previous two years.

This forecast is down slightly since July due to reductions in both nonresidential buildings and non-building infrastructure. Educational, Office, Power and Highway, four of the five largest markets which together make up half of all nonresidential spending, were all lowered. Some of these markets are prone to very large post-annual upward revisions and that has the potential to add to 2017 spending when those revisions are released in July 2018. In the July 2017 revisions, Power spending for 2016 was revised up by 10%.
History shows spending has been revised up 51 times in the last 55 months. I wouldn’t be surprised to see future revisions smooth out spending in unusually low periods (April and July) and increase total 2017 spending above this forecast. I suspect revisions in July 2018 may show 2017 spending as high as $1,250 billion. The average post-annual total spending revision for the last five years is +2.3%. The total revision to 2016 was only 2.2%.
None of the spending detailed in this analysis includes any projections of potential work from future infrastructure stimulus.
Total construction spending in 2018 is currently forecast to reach $1,334 billion, an increase of 8.0% over 2017. For the first time since pre-recession, Non-building Infrastructure will lead all spending with potential to increase by 10% growth over 2017.
Non-building Infrastructure is forecast to lead 2018 spending with an increase of 10.2% due to very large projects in Power and Transportation. Nonresidential Buildings growth is strong for 2018, forecast up 9.3%. Residential spending in 2018 slows to only 5.7% growth after six years averaging 13%/year.
Total spending will reach a new high in 2018 for the third consecutive year. However, in constant $ adjusted for inflation, spending is just back to the level of 2008. The all-time constant $ high was reached in 2005. Adjusted for inflation, 2018 will still be 12% below that level. At current rates of growth, we would not eclipse the previous high before 2022.

Growth of 8% in 2018 or $100 billion in construction spending demands a few words on jobs growth. Construction requires about 5000 workers for every added $1 billion in construction volume. Construction jobs have never increased by 500,000 in one year. However, $100 billion in added spending is not the same as $100 billion in volume, and jobs grow based on volume. Although spending will increase 8%, construction inflation has been hovering near 4.5% to 5% for the last five years. Real volume growth in 2018 after inflation is expected to be just over 3% or $40 billion. That would mean the need, if there are no changes in productivity, is to add about 200,000 additional workers in 2018, a rate of jobs growth that is well within reach since that is below the average jobs growth for the last seven years.
Residential Buildings Spending
Total Residential spending in 2017 will finish at $523 billion, up 10.6% from 2016. Residential spending is above 10% growth for the 5th consecutive year.
Residential spending was expected to dip between May and October due to a low volume of work contributed from starts cash flows. The actual data shows, after reaching a seasonally adjusted annual rate (saar) of $536 billion in March, the high for the year, spending dropped 3% to 4% to as low as $515 billion saar three times and has averaged only $520 billion saar from April through October. New starts in Q1’17 reached an 11-year high, so I expect the rate of spending to increase at year end. Residential work will close out the year with 10.6% growth, the 5th consecutive year over 10%. Average growth the last six years is 13%/year.
Residential spending is 50% single family, 13% multi-family and 37% improvements.
Residential Improvements has posted 18% growth year-to-date. Single Family spending is up 9% while multi-family is up only 4%. That is compared to 2016 when improvements for the year finished up 10%, SF up 4% and MF up 5%. Census does not include flood damage repairs in improvements but does include full flood damaged structure replacements in improvements.
Total residential spending in 2018 slows to a forecast of $553 billion, only 5.7% growth over 2017.
Due to the shorter duration of projects, nearly 70% of residential spending within the year is generated from new starts. Unlike Nonresidential, backlog does not contribute nearly as much to Residential spending within the year. New Residential starts in Q1’17 reached an 11-year high. Residential starts are at a post-recession high.
Residential spending will reach a 12-year high in 2018. Adjusted for inflation, all years from 1996 through 2007 were higher. Inflation adjusted spending is still 30% below the all-time high reached in 2005.

Nonresidential Buildings Spending
Total Nonresidential Buildings spending in 2017 will come in at $420 billion, up only 2.8% from 2016.
Commercial/Retail is expected to finish the year with +13% growth and Lodging +9%. An unexplained surprise was Office, which by early indicators was predicted to show large gains in spending. Two independent sources reported new office starts in 2016 up 25% to 30%. Starting backlog coming into 2017 was near or at an all-time high. Spending was forecast to jumped at least 20% in 2017. Instead, spending posted declines from May to September and is now forecast to finish with only a 4% gain. This market accounts for the single largest miss in my forecast posted in Feb 2017.
The only major nonresidential building in decline this year is Manufacturing. Manufacturing spending was expected to fall in 2017 after peaking in 2015 from massive growth in new starts in 2014. Spending stayed close to that level in 2016. Based on cash flows from starts, spending was expected to decline in 14 of the last 18 months. It declined in 11 of those months. We are at the point of turn-around with only one monthly decline predicted in the next three months and no spending declines expected next year. For 2017, Manufacturing new starts are up 35%.
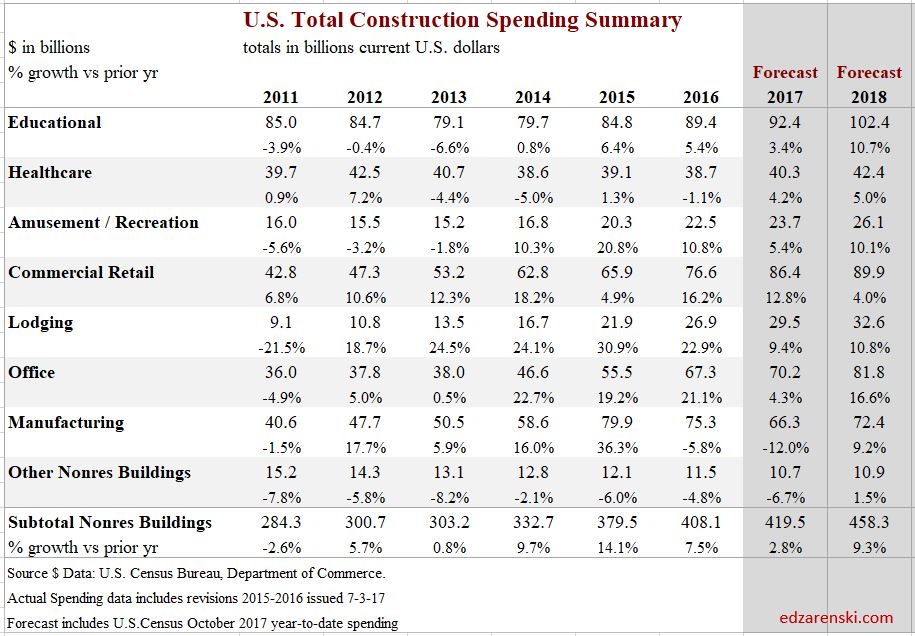
Nonresidential Buildings starts in the six months from Aug 2016 to Jan 2017 posted the (then) highest amount of new starts since Jan-Jun 2008, also the year Nonresidential Buildings spending peaked. Then new starts in the six months Apr-Sep 2017 just surpassed both those previous peak highs.
Nonresidential Buildings 2018 starting backlog is 50% higher than at the start of 2014, the beginning of the current growth cycle. Starting backlog has increased for five years at an average 10%/year. Spending from starting backlog, up 10% in 2018, increased for five years at an average 9%/year.
Total nonresidential buildings spending in 2018 is forecast to reach $458 billion, an increase of 9.3% over 2017. Office, educational and manufacturing make up 70% of the growth.
Nonresidential Buildings will reach a new high for spending in 2018, surpassing the previous 2008 high. However, adjusted for inflation, spending is 18% below the all-time high reached in 2000.
Non-building Infrastructure Spending
Total non-building infrastructure spending in 2017 drops to $293 billion, down 3.7% from 2016.
Non-building Infrastructure spending, always the most volatile sector, dropped to yearly lows from June through September. Infrastructure construction spending in August dropped to the lowest since November 2014. However, this was predicted. Cash flow models of Infrastructure starts from the last several years show current dips in monthly spending are being caused by uneven project closeouts from projects that started several years ago.
Current backlog is at an all-time high and spending will follow the expected increased cash flows from the elevated backlog. Environmental Public Works (Sewage/Waste disposal down 16%, Water Supply down 9% and Conservation/Dams & Rivers down 7%) posted the largest declines in 2017 and accentuated the declines in the infrastructure sector. The sector is expected to increase slightly in the last quarter 2017. In recent months there are already substantial gains being posted in Conservation and Transportation.
No future growth is included from infrastructure stimulus and yet 2018 is projected to increase by 10%.

Total non-building infrastructure spending in 2018 is forecast to reach $324 billion, an increase of 10.5% over 2017. My forecast for 2018 is predicting every infrastructure market will post gains, but it is the Power and Transportation markets that account for almost all the growth in 2018. Transportation new starts in 2017 grew 120% due to massive new air terminal and rail projects. Spending growth in the Power market is not quite so apparent. Combined Power new starts are down for both 2016 and 2017, but the spending gains are coming from projects that started in 2015, a year in which starts were up over 120%.
Non-building Infrastructure will reach a new high for spending in 2018. This sector had posted a new high in 2015 and nearly equaled that in 2016. Adjusted for inflation, spending in 2018 will be nearly equal to the all-time highs reached in 2015 and 2016.

Public Spending
Total public spending for 2017 remains flat at $287 billion with most major public markets down for the year.
At midyear, I expected Educational and Highway to support a Public spending increase in 2017. Those gains did not materialize. A decline in Highway spending offset small gains in Educational. By far the largest Public spending decline is in Sewer and Waste Disposal, down 16%.
Public spending hit the low for the year in July. It increased for the last three months, most recently by an 11% increase in Public Educational spending in October. We are now near the high for the year and can expect to see another six months of growth before spending levels off in mid-2018.

When you see graphics that present Residential, Nonresidential and Public spending all on the same plot, they are not additive. Only Residential and Nonresidential can be added to reach total spending. Public is a subset of Nonresidential, composed partly of Nonresidential Buildings (~40%) and partly Non-building Infrastructure (~60%), with a slight amount of residential.
The two largest markets contributing to public spending are Highway/Bridge, 32% of total Public spending, and Educational, 25% of Public spending. The third largest market, Transportation, is only about 10% of Public spending. Environmental Public Works combined makes up almost 15% of public spending, but that consists of three markets, Sewage/Waste Water, which accounts for 8%, Water Supply and Conservation. Office, Healthcare, Public Safety and Amusement/Recreation each account for about 3%.
All of Highway/Bridge is Public spending. Only 80% of Educational spending is Public and only 70% of Transportation is Public. Environmental Public Works markets are 99% Public.

Total Public spending in 2018 is forecast to reach $305 billion, an increase of 6.3% over 2017. Public spending in 2018 will reach the highest year over year growth since 2008.
Educational and Transportation will contribute equally and together account for almost 60% of the Public spending growth in 2018. Transportation new starts in 2017 grew 120% due to massive new air terminal and rail projects. Educational new starts total for the last three months posted the highest quarter in at least seven years. The 2nd highest quarter was also within the last 12 months, so still contributes fully to 2018 spending. 2018 signifies a turn-round in Public spending which has not posted significant growth since the recession.
See this companion post for Starts Trends Construction Forecast Fall 2017 11-8-17
After New Starts, dollars are tracked in Backlog, Backlog Construction Forecast Fall 2017 11-10-17
For more on Jobs and Workload see Construction Jobs / Workload Balance 11-7-17
For effects of inflation see Constant Dollar Construction Growth 11-2-17
Infrastructure & Public Construction Spending
3-5-17
Infrastructure work does not normally grow in leaps and bounds.
Seldom does infrastructure construction spending grow by more than $10 billion in a year. Rarely does it grow by more than $20 billion.
Currently at about $300 billion a year, infrastructure represents only about 25% of all construction spending. The infrastructure sector is comprised of the longest duration type projects such as energy, highway/bridge, transportation terminals, railway and water/waste water resource development. It is not unusual for projects to take four to five years to reach completion.
Increasing new construction starts by $40 billion for new infrastructure work in any given year on average might add only $8 to $10 billion in spending in each of the next four or five years. To increase spending by $10 billion a year we would need to increase new starts by $40 billion every year. We’ve only ever come close to adding $40 billion in new starts once, in 2015.
In 2015, new infrastructure starts increased by $38 billion or 27%, due to an increase of $13 billion in new power generation plants and an increase of $21 billion in new LNG plants and port facilities. That will keep infrastructure spending growth elevated throughout 2018 and 2019. Measuring a total increase of 250% in power projects, that is a scenario unlikely to be duplicated in coming years.
2017 spending comes from: 10% 2014 starts; 35% 2015; 35% 2016 and 20% new starts in 2017.
Although new infrastructure starts were down in 2016 and are expected to decline again in 2017, the amount of work in backlog at the start of 2017 is the highest its ever been and spending in 2017 is forecast near the all-time (2015) high. Spending in 2018 from backlog will increase again and 2018 will hit another all-time high. There are no annual declines in spending predicted for the next four years. Some very large public infrastructure projects that started in 2014, 2015 and 2016 still contribute large amounts to spending in 2017 and well into 2018.
Increasing infrastructure spending by $10 billion a year would require adding about 35,000 to 40,000 new construction jobs per year. To accommodate all growth since the recession bottom, this sector averaged adding only 20,000 new jobs per year. Current spending growth is predicted to add $40 billion in work over the next three years and this will absorb all new heavy engineering jobs growth. The non-building infrastructure sector does not have the capacity at this time to increase spending by another $10 billion/year over its current growth rate, nor does it have the capacity to add an additional 40,000 jobs per year.
This summary of current projected spending does not include any future infrastructure work that might be generated from a proposed $1 trillion spending plan.
It is important to note here that 90% of all work in the power sector is private work. Only 60% of infrastructure work is publicly funded. However, some nonresidential building is publicly funded.

Public spending is not all public works projects.
Most public work is infrastructure, or public works projects. However, not all infrastructure is public work. The power market is the largest infrastructure market. But, already noted above, power work is mostly private. So the market responsible for one third of all infrastructure work is 90% private. Educational projects, typically considered nonresidential buildings, are 80% public and 20% private.
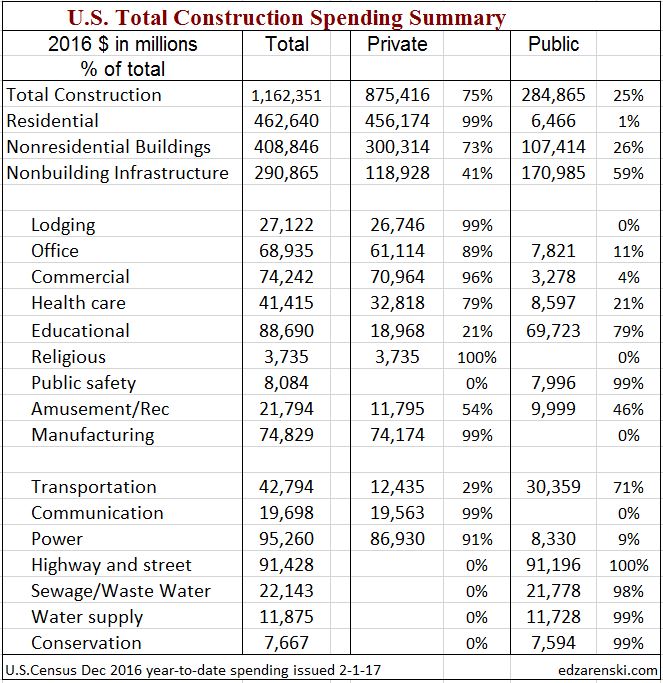
The two largest markets contributing to public spending are highway/bridge (32%) and educational (25%), together accounting for 57% of all public spending. The next largest market, transportation, is only about 10% of public spending.
Highway/bridge work fluctuates the most with large monthly swings up or down. However, 4 out of 5 times over the last 12 years, any large monthly move up or down was accompanied by a partially offsetting opposite move the following month. Highway spending hit an all-time high in 2015 and again in 2016.
Two of the three largest annual growth increases ever recorded in public spending were driven by educational spending. In the third largest growth year, highway just barely edged out educational spending for the top spot.
If educational work were to be considered part of future infrastructure expansion, then the maximum capacity to increase public infrastructure spending obviously increases. Together with other public works projects this could potentially provide a large enough market base to increase public infrastructure spending by $10 billion a year over and above the growth already in backlog or anticipated. But most of the added work would need to be to the education market. Even with potentially adding educational market work to the infrastructure expansion plan, the hope of expanding infrastructure spending by another $10 billion/year remains difficult at best.
Any increase to future work needs to be considered as over and above the spending growth patterns already due to work in backlog and new starts anticipated. This plot of predicted public spending does not include any future infrastructure work that might be generated from a proposed $1 trillion spending plan. About 80% of all spending in 2017 is already in backlog. About 50% of all the spending from Jan. 2018 through Jan. 2020 will already be in backlog by Jan. 2018.
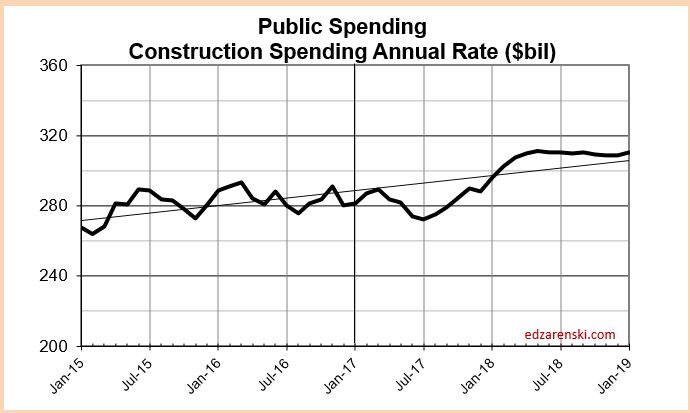
The following article is an extension of this discussion Calls for Infrastructure Problematic
Public Construction Spending 2016-2017
10-21-16
updated 2-16-17 edited to include 2016 year-end total$ public vs private
The two largest components of Public Construction Spending, by far, are Highway/Bridge/Street and Educational Buildings. These two markets have more impact on the magnitude of public spending than any other markets. All of Highway ($90bil) is public spending. About 80% ($70bil out of $88bil) of Educational buildings is public spending. Together they add up to 55% of all public construction spending.
The next three largest public markets in order are: 70% of Transportation ($30/$42bil); all of Sewage/Wastewater ($22bil) and all of Water Supply ($12bil). These three markets account for only about 22% of public spending. Eight remaining markets, none larger than 3.5% of the total public sector, combined make up ~20% of total public spending. Five of those eight, Office, Health care, Public Safety, Amusement and Power, each account for $8 to $10bil and each is 3% to 3.5% of Public work.
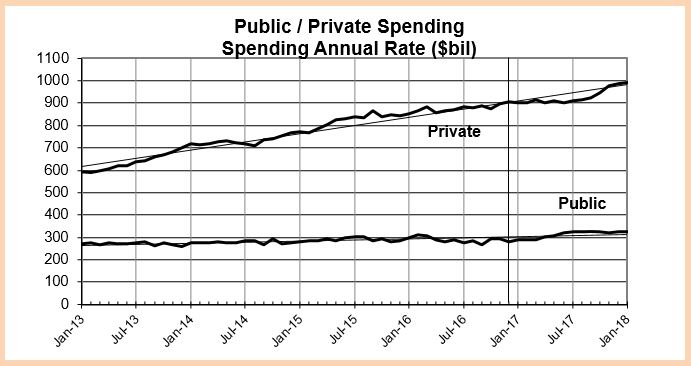
Public Construction Spending average for the first six months of 2016 was the highest since 2010 and is up 10% from the Q4’13-Q1’14 low point.
Public spending finished 2016 down 0.8% from 2015, but that is down from a near six-year high, so spending is still strong. It is still -9% below its 2009 peak.
The biggest mover to total public spending this year is educational spending. Public educational spending in 2016 is up 4.7%. Because it represents 25% of all public spending, it has a net impact of moving total public spending up +1.2%, greater impact than any other market.
Public commercial spending is up 24% but has only a 1% market share of public work so moves public spending by only +0.24%. Power is down -20% but at a share of only 3% moves public spending by only -0.6%. Public components of office, public safety, sewage/waste disposal and water supply are all down by a combined -7%. At a combined market share of 18% that nets a -1.26% reduction in total public spending.
Public spending peaked in 2009 when Educational buildings spending was at its highest. Highway spending has been at or near its peak for the last 16 months but that, with current educational spending, which is still more than 20% below its peak, has not been enough to carry public spending to new highs.
Expected spending predicted from new construction starts gives a much better picture for 2017.
Highway/Bridge/Street starts in 2015 finished just shy of a 6-year high (in 2013) but 2016 was down 13% from 2015. On average 2015+2016 starts are still 5% higher than 2014. Highway projects are long duration, so very good starts from the end of 2014 and the beginning of 2015 will still contribute strong spending well into 2017. Highway spending is expected to finish up slightly over 2016.
Educational new starts in 2016 finished the year up 11%, posting a 4th consecutive annual increase and educational spending for 2017 should finish up 10%.
Transportation spending in 2017 should increase 6%.
Overall, total public construction spending in 2017 is predicted to grow by 8% to 9%, the first substantial growth since 2007, reaching new highs in the 2nd half. Educational spending will take the lead in 2017 public work. Historically, public spending increases by less than 10% per year.