PUBLIC WORK AND INFRASTRUCTURE SPENDING
Most public work is non-building infrastructure, or public works type projects, but some public work is nonresidential buildings. In 2018, of $301 billion in public work, $177 billion (59%) is non-building infrastructure, $118 billion (39%) is nonresidential buildings, $6 billion is residential. The public subset of work in the last 25 years has grown by $20 billion/year only twice, during the construction boom of 2006-2007.
Excluding the worst recession years, the average annual growth of all publicly funded work since 2001 is $8 billion/year. In the four best construction boom years growth averaged $20 billion/year.
The two largest markets contributing to public spending are Highway/Bridge and Educational, together accounting for nearly 60% of all public construction spending. At #3, Transportation is only about 12% of public spending. Sewage/Waste Water and Water Supply add up to another 12% of public work. All other markets combined, none more than 4% of total public work, account for only 15% of public spending.
Non-Building Infrastructure sector, at a total of $313 billion in 2018, is less than 25% of all construction spending, mostly supported by the Power market. Power accounts for 33% of all non-bldg infrastructure spending. Highway represents 30% and Transportation about 15%. However, Power is 80% private; Highway is 100% public; Transportation 70% public.
60% of non-building infrastructure spending is publicly funded. Highway is a little more than half of all publicly funded non-bldg infrastructure work. The public non-bldg subset of work in the last 25 years has grown by $10 billion/year or more three times, 2006, 2007 and 2018. In 2006-2007, Highway accounted for most of that growth. In 2018, Transportation accounted for half the growth.
Excluding the worst recession years, the average annual growth of publicly funded non-bldg infrastructure work since 2001 is $5 billion/year. In the four best construction boom years growth averaged $12 billion/year.
Nonresidential Building sector, at a total of $434 billion in 2018, is 35% of all construction spending, mostly supported by the Educational and Commercial markets. Educational accounts for 22% of all nonresidential buildings spending, commercial 20%. However, Educational is 80% public, Commercial is only 4% public.
Other nonresidential buildings that are publicly funded are: Public Safety – 100% public; Amusement/Recreation Facilities (i.e.’ Convention Centers, Stadiums) – 45% public; Healthcare – 20% public; Office – 13% public. None are more than 4% of total public spending.
Less than 30% of nonresidential buildings spending is publicly funded. Educational is 60% of all publicly funded nonresidential building. The public nonresidential building subset of work in the last 25 years has grown by $10 billion/year twice, in 2007 and 2008. Both times, Educational accounted for 75% of that growth.
Excluding the worst recession years, the average annual growth of publicly funded nonresidential building since 2001 is $4 billion/year. In the four best construction boom years growth averaged $8 billion/year.
Residential is 40% of all construction spending but only 2% of public spending.
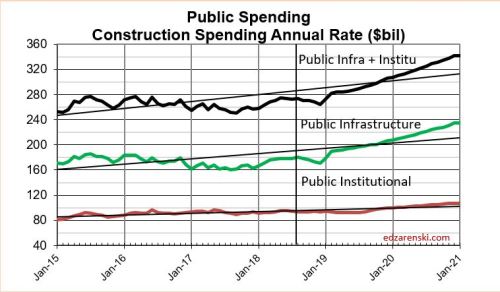
Average post-recession growth in public infrastructure + public institutional jobs is about 40,000 jobs per yr. Maximum growth in a year was 60,000 jobs. Growth of $10 billion in spending in a year supports about 40,000 new jobs.
All public work in the last 25 years has grown by $20 billion/year only twice. The average annual growth of all publicly funded work since 2001 is $8 billion/year. In the four best construction boom years growth averaged $20 billion/year.
Total All Public Infrastructure construction, including non-building public works and nonresidential public buildings, already has 2019 and 2020 growth projections at historic capacity of +$20 to +$30 billion/year. Historically, even in the construction boom years of 2005-2008, we have never exceeded that growth volume, especially by another $10-$20 billion/year, nor added an additional 40,000-80,000 jobs per year above the average 40,000 or the maximum 60,000 jobs in a year.
Any government funding intended to increase public infrastructure construction would most likely be limited by industry growth rates to at best no more than $10-$20 billion a year.
See Marketwatch.com for additional notes I’ve posted regarding spending limits.
The above Marketwatch article links to a twitter thread I posted that summarizes Infrastructure limitations in a nutshell.
See also these articles for much more analysis on Infrastructure
2018/02/16 Down the infrastructure rabbit hole
2017/01/30 Infrastructure – Ramping up to add $1 trillion
