1-30-17
How long would it take to accommodate adding $1 trillion of new infrastructure construction spending?
I read this in another recent article on the topic; “If passed, the ripple effect of an estimated $100 billion a year in new infrastructure construction would undoubtedly be felt throughout the industry.”
The article seems to imply the industry could absorb $100 billion in new infrastructure work and maintain that $100 billion added spending for 10 years. The infrastructure sector could not accommodate that massive amount of instantaneous growth. Let’s look at maximum historical rates of growth to understand why.
To really understand construction growth rates we need to look at all historical spending in constant dollars (inflation adjusted).All constant dollars in this analysis are converted to 2016$.The following spending historical data goes back to 1993. Jobs data goes back to 1970.
- Construction Industry total spending fastest rates of growth:
- Maximum growth one year, 2015, +$107 billion, in 2016$= $87 billion
- 2011 – 2015, 4 yrs, +$324 billion, in 2016$ = +$240 billion = $60bil/yr.
- 1995 to 1999, 4 yrs, +$200 billion, in 2016$ = +$200 billion = $50bil/yr.
- Infrastructure Sector spending fastest rates of growth:
- Maximum growth one year, 2007, +$40 billion, in 2016$= $36 billion
- 2005 – 2008, 3 yrs, +$87 billion, in 2016$ = +$52 billion = $17bil/yr.
- 1997 – 2001, 4 yrs, +$50 billion, in 2016$ = +$46 billion = $15bil/yr.
- Construction Industry Jobs fastest rates of growth:
- Maximum growth one year, 1999, 397,000 jobs
- 4 years from 1995 to 1999, average 317,000 jobs/year.
- 3 years from 2012 to 2015, average 266,000 jobs/year.
- Infrastructure Sector Jobs fastest rates of growth:
- Maximum growth one year, 2004, 65,000 jobs
- 3 years from 2003 to 2006, average 48,000 jobs/year
- 3 years from 2011 to 2014, average 26,000 jobs/year
The fastest one-year growth for the entire construction industry is $87 billion in 2015, but the fastest growth rate is never maintained for long. The period 2011-2015 is the highest average rate of growth at $60 billion/year. The entire industry has had jobs growth of more than 300,000/year only 6 times since 1970. 1995 to 1999 is the only period to average over 300,000 jobs/year longer than 2 years.
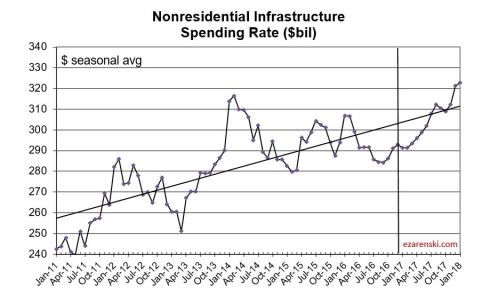
Infrastructure is only 25% of all construction work. The entire construction industry best growth rate ever achieved (in 2016$) absorbed $1 trillion in new spending over 5 years. Infrastructure has not absorbed $1 trillion newly added work in 25 years. The fastest one-year growth for the Infrastructure sector is $36 billion in 2007, but the highest average rate of growth is $17 billion/year. The current rate of growth since the recession is $10 billion/year.
The infrastructure sector has had jobs growth of more than 40,000/year only 3 times since 1993. Maximum jobs growth hit 65,000 in 2007. The best average jobs growth is 48,000 jobs/year and that has not occurred in the last 10 years. It’s the only period with average growth more than 26,000 jobs.
Let’s assume the fastest rates of growth can be duplicated once again. Let’s also assume that longer term growth will come closer to the long term average highs. So, infrastructure growth might reach $36 billion in a given year but could fall back to an average growth of $17 billion/year. Jobs could grow by 65,000/year but would probably average less than 48,000/year.
However, even with the addition of a new influx of infrastructure work, most of the other growth, which has been fairly constant for the last 25 years, is not going to go away. Since the recession, infrastructure has been increasing at $10 billion/year and jobs have been increasing 20,000/year. Assuming we maintain that level of normal infrastructure growth, then the remainder is what we might expect to accommodate in growth from new infrastructure stimulus.
If we could achieve maximum rates of growth we could increase infrastructure additionally through new stimulus by $26 billion/ year and increase jobs by 45,000/year.
If we could maintain long term best average rates of growth we could increase infrastructure through new stimulus by $7 billion/year and increase jobs by 28,000/year. Even if a portion of the normal growth goes away, it looks like the infrastructure sector could only accommodate adding about $10 billion/year in new stimulus work.
It must be noted that a large portion of infrastructure spending is private work, not publicly funded. Power is 90% private, 10% public. Highway is 100% public. Transportation is 30% private, 70% public. Sewage, Water and Conservation are 100% public. Communication is 100% private.
Fully 35% of all infrastructure work is private. Most of the huge increases in spending over the years are associated with the Power market. So this analysis counters any argument that publicly funded infrastructure can grow much faster. In fact, if only public works were taken into account, spending targets here would need to be reduced by 35% and the total duration to complete would be increased by 50%.
A cash flow schedule of all newly added work provided the plan needed to balance spending. All new work is assumed to take 4 years to complete. In the first year, $40 billion of new work starts, but only $10 billion gets spent. Spending flows at the rate of $10 billion/year for 4 years. New starts are added at a rate to continuously increase spending by $10 billion/year. By the 5th year we need to add $80 billion in new starts to get $20 billion in spending since all of year 1 work is now completed.
This table gives an indication of how cash flows. The full 13 year table is below.

I have assumed that inflation will add 4%/year to future spending. Five years from now the equivalent to adding $10 billion a year will be $12.2 billion a year. Due to inflation, we would spend $1 trillion to build the equivalent of $750 billion in today’s dollars. Increasing spending by the inflation adjusted equivalent of $10 billion per year, it would take 12 to 13 years to spend $1 trillion.

This scenario would push total infrastructure spending to the highest rates of long term growth on record. It’s not very likely growth like that could be sustained for very long. So, it’s possible total growth would fluctuate yet that we still keep our sights on achieving those long term growth rates. This allows for no economic downturn at any time in the next 10 years.
Another restraint to maximum growth rates is jobs. Infrastructure is only 25% of all construction. Maximum all construction jobs growth has exceeded 300,000/year a few times, but infrastructure jobs have increased by more than 40,000 only rarely and only once averaged over 40,000. While it takes about 5,000 to 6,000 workers to put-in-place $1 billion in construction, it takes only about 3,000 to 4,000 workers to put-in-place $1 billion of infrastructure. To reach maximum growth of $36 billion in infrastructure would require 110,000 to 140,000 new jobs per year, two to three times the long term growth. This analysis does not take into consideration any shortfall in jobs due to labor availability.
Setting spending growth to $10 billion/year results in 10 years of continuous record jobs and spending growth. Expectations of increasing infrastructure spending (not to be confused with starts) by $40 billion/year or $50 billion/year have not taken into consideration the maximum sustained growth rates in the industry. Talk of increasing infrastructure spending by $100 billion in a year is fantasizing.
added 2-2-17
In recent reading I came across a comment that both Educational and Health Care markets potentially could be included in Infrastructure funding. I take that to mean the public portion of those markets. Educational could be considered infrastructure and is 80% public ($70/$88bil). I would guess also Public Safety and Public Power could be included. Educational public spending is $70 billion/year. The others are $8 billion each. The short version of all the explanation above is that new infrastructure investment can grow a market at about half of the best total long term average growth of 10%/year. So these markets could absorb growth of about 5% or about $5 billion/year more.

More about Infrastructure written 3-6-17 Calls for Infrastructure Problematic
