Home » Productivity
Category Archives: Productivity
Construction Briefs Aug 2025
The biggest story in construction data right now is jobs.
Average construction jobs growth through July, last 25 years, excluding recessions, +130,000.
Average construction jobs growth through July, last 10 years, excluding recessions, +140,000.
2025 Construction Jobs growth through July, +21,000.
Not so surprising, as the Constant $ construction spending through July is down -5.7%, (compared to same months previous year), steepest decline since 2011, which was the end of the great recession. Constant $ (inflation adjusted) construction spending is now back to early 2022 level.
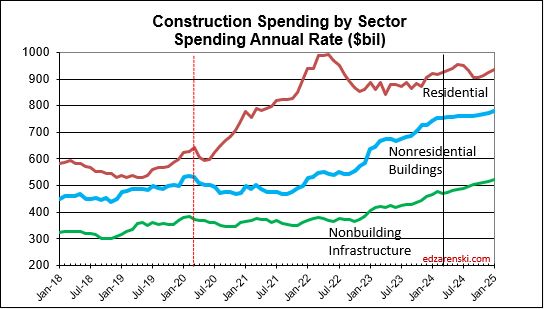
Construction Spending is down 5 of the last 6mo, now down a total -3.0% from Dec. Over that period spending is down most significantly in Residential, Manufacturing and Commercial w/o Warehouse. It’s up the most in Data Centers, Highway and Public Utilities. Overall, business is declining.


Construction Spending inflation adjusted is forecast to drop slightly every month for the rest of the year. Expect constant $ spending at year end down -6.3% from 2024. Uncertainty over tariffs and funding subsidies has slowed decision making on planning and moving new projects forward to construction. This is not an environment to expect jobs growth.
If jobs were to move at the same rate as business volume, with 2025 construction spending in constant$ expected to fall -6.3%, then jobs would be expected to fall -6.3%. That’s 500,000 jobs. The only times we’ve ever lost 500,000 jobs in a year was in both 2009 and 2010. In those years, after falling 17% in the previous 3 years, business volume dropped another 12% and 10% respectively.

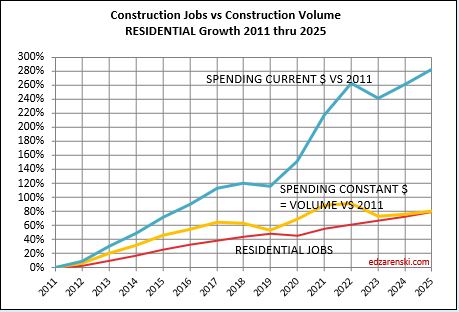
Residential construction jobs peaked last September and are now down 1% or 35,000 jobs since then. In Constant $, residential spending is down 10% since last September. Jobs never move at the same rate as spending. This has a significant impact on productivity.
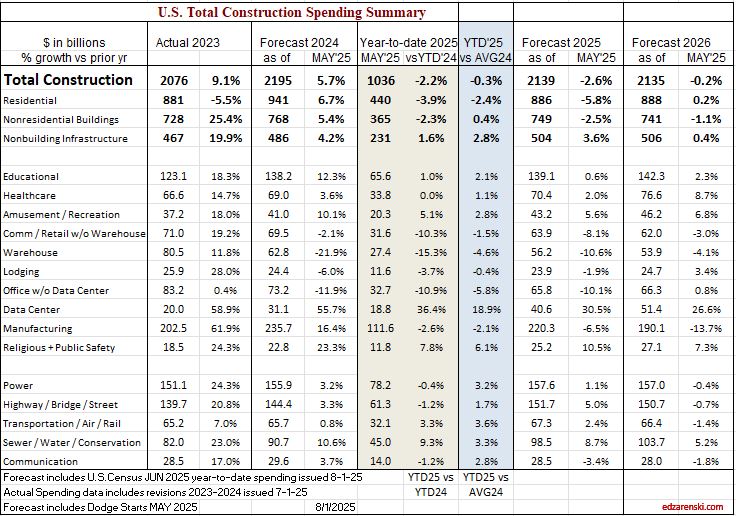
Data Centers are the bright spot in construction spending, up 17% since December and forecast to finish the year up 30%, an increase of +$10bil.

Biggest forecast declines in Current$ construction spending: Residential -5.8% (by far largest $ decline, -$55bil); Manufacturing – 6.5%, -$15bil; Warehouse -10%, -$7bil; Office (ex Data Centers) -10%, -$7bil; Comm Retail (ex Warehouse) -8%, -$6bil.
Manufacturing spending is now receding from an astronomical high. From 2019 through 2021 spending was averaging $80bil/yr. In 2024 it reached an average of $235bil, and peaked in Oct at $244bil. In June it was only $223bil and it’s expected forecast for 2025 is down -6.5% from 2024, but that is still a very high $220bil.

Construction Briefs June 2025
Construction Spending Explained
- New Starts + Existing Backlog generate Spending
- Spending = Revenue
- Revenue includes inflation which adds nothing to volume
- Revenue – Inflation = Business Volume
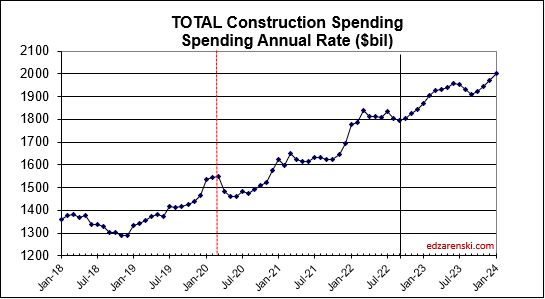
Construction spending fell slightly in April, down 0.4% from March. Spending has fallen slightly each of the last 3 months, but total spending is still at/near an all-time high with the seasonal rate at $2,200 billion. The forecast predicts spending will increase to 3% growth by year end.
Construction Forecast Update – Data Centers shows the largest % growth for 2025, forecast +33%. Manufacturing is still the largest $ contributor ($223bil/yr) to nonresidential bldgs total spending ($772bil/yr), but has fallen 6% in the last 5 months.
Peak manufacturing construction spending was posted from Sep thru Dec 2024. The avg of 1st 4mo of 2025 is down 4% from that peak. By Q4’25, avg spending will be down 10% from peak.
BTW, this is totally normal. We are beginning the tail end of an above normal huge influx of new manufacturing projects that started over the last 3 years, and the spending curve is beginning the downhill slope. Spending will continue to fall for the next 3yrs.
Data Center construction spending has not yet hit peak. Data Centers are continuing on a phenomenal streak of +45% growth in 2023 and +56% in 2024 and now 33% in 2025. The avg of 1st 4mo of 2025 is up 39% from same 4mo 2024. Spending will finish the year almost 20% higher than today. 2025 forecast +33% over 2024. Currently projecting peak spending end of 2027, or later.
Headwinds could slow new starts growth. Many economists predict current trade impacts will slow overall economic growth. That in turn could slow capital expenditures, which, in this case, is new construction starts.
Any capex pause could reduce all Data Center numbers. However, starts are up 400% since 2020 and could finish 2025 up 500%. Would take a lot of canceling or delaying to collapse these numbers. (This is going to first appear in construction starts, “firms pausing or delaying capex.” It’s already started with Data Center).
What’s propping up construction spending growth? Here’s the top growth markets.
- Market——1yr/%/$ growth ——3yr growth
- Educational 1yr/+8%/+$10bil +3yr/+30%/+$30bil
- Data Centers +56%/+$10bil +286%/+$18bil
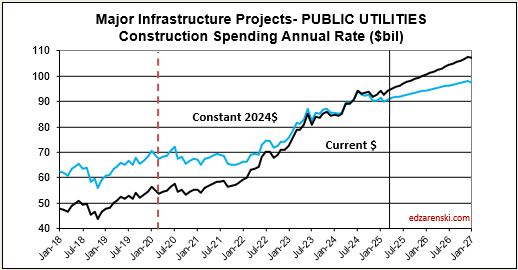
- Public Utilities +11%/+$9bil +58%/+$38bil
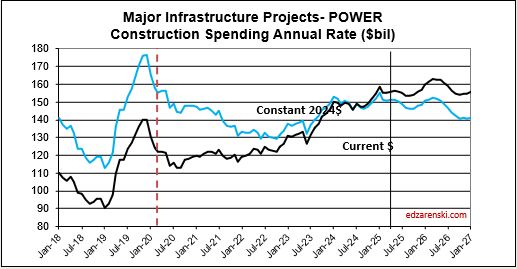
- Power +10%/+$14bil +24%/+$29bil
- Highway +4%/+$6bil +40%/+$40bil
Data Centers far and away takes the prize for highest % growth, but Data Centers is only 1.7% of all construction spending. Power is 7%, Highway is 6.6%, Educ is 6.3%, Pub Util is 4.4%
Manufacturing is notably absent from the above list, because after 3 outstanding years, Mnfg is no longer contributing growth. Mnfg spending is beginning to taper off. Mnfg is 9.3% of construction spending. The only market over the last year, or 2 or 3 years, with more $ spending than Manufacturing is Residential.
Mnfg 1yr/+20%/+$39bil 3yr/+284%/+$150bil
Mnfg 2025 forecast -10%/-$24bil


What’s holding spending growth back?


6-17-25 When May construction starts are reported later this month, I’m expecting an overall decline and a lower forecast. There are already reports of pauses in manufacturing facilities and data centers. Hiway and Public Utilities are probably immune from cuts but Power may see some reductions. Education and Healthcare are questions. Residential construction expected down slightly. Housing permits continued a downhill trend in April for the fourth month in a row. KB and Lennar report market pricing is down slightly. # of homes on the market is increasing.
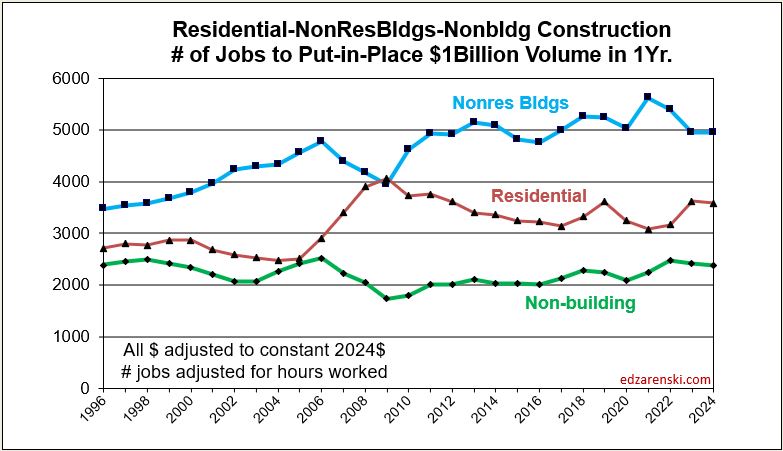
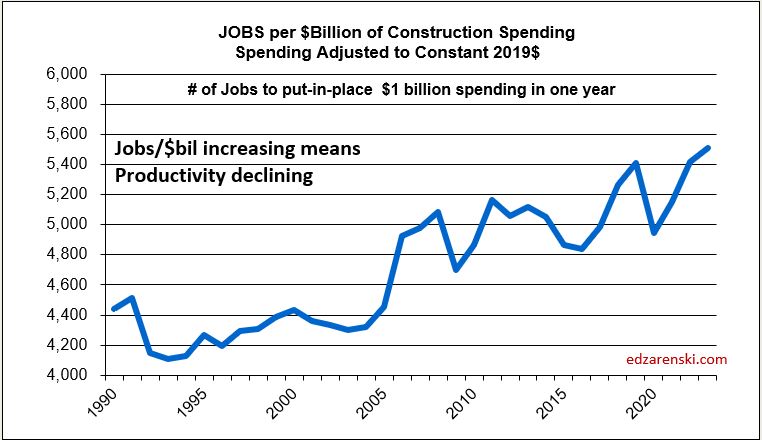
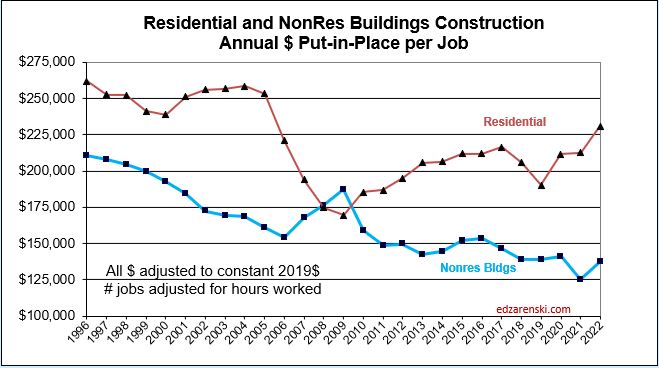
This next plot shows the number of workers required to put-in-place $1 billion of construction in 1 year. Except for Nonbldg Infra, which has remained relatively flat over time, it requires more jobs to put-in-place $1bil today than it did 10 years or 20 years ago. Total construction workforce (8,300,000) divided by # of billions$ put-in-place (2,200 billions$/yr) is the simplest way to show the decline in construction productivity. Results here broken out for major sectors.
Construction Jobs Total hours worked peaked in March, now down 0.4%. For May, jobs increased by 4,000 (<0.1%), but unemployment dropped from 5.6% to 3.5% (175,000). That would mean that 171,000 workers dropped out of the workforce.

Steel Tariffs 50%
50% of nonres bldgs are structural steel. Str Stl is 10% of total bldg final cost. Nonres bldgs construction spending = $770bil/yr., $385bil on SS nonres bldgs., $38.5bil on str stl
Struct Steel material is only 25% of steel total contract cost, so 38.5 x 25% = only $9.6 bil is mtrl used in SS nonres bldgs. So at 50% tariff = $4.8bil added cost to nonres bldgs total spending. (This assumes ALL steel increases in cost).
Above is structural steel only. When including all other steel used in a building, (rebar, studs, frames, etc), steel is 15% of total bldg cost. So added cost would be $7.7bil.
And that is just nonres bldgs. MF Rsdn uses a little steel, but Nonbldg markets, Power, Highway, Transport, Pub Util adds about another $5bil.
So, steel tariffs, IF ALL STEEL WERE TO INCREASE, adds inflation to total Nonres Bldgs and Nonbldg. Half of all Nonres Bldgs use structural steel, so inflation to SS bldgs is 4.8/385, or 1.25% on structural steel bldgs. If looking at the macro view, inflation over the nonres bldg sector, then the $4.8bil increase would be divided by the total nonres spending, or 4.8/770 = 0.625%. All other bldg steel, applied to all nonres bldgs, added another 2.9/770 = 0.4%
Nonbldg Infrastructure markets, if it is a SS building, add the same 1.25% + 0.4%. But Public Works and especially Bridge construction can add significantly more. If domestic producers also raise pricing to follow suit with tariffs, as expected, this is what happens to total Nonres inflation.
US imports 30% of steel it uses. 40% of all steel is used in construction. If 30% is balanced across all types of steel, then 30% of constr steel is imported. (It would take some concentrated effort to determine % imports for each of the individual steel uses.) IF ONLY IMPORTED STEEL WERE TO INCREASE and no domestic manufacturers raise prices, 30% of building steel increases in cost. That is not likely at all. But if so, tariffs would add only 0.4% to nonres bldgs and about 0.1% for all other steel.

Construction Data MAR Briefs 5-5-24
Updates to Forecast, spending, starts, inflation, jobs
SEE ALSO Construction Analytics Outlook 2024
A side note, before I begin with the economic data, sometime within the next few weeks, I expect by May 31st, this blog will record the 1,000,000 view. Nearly 500,000 people read on average 2.1 articles every visit. Inflation articles draw the most attention, with a read rate of about 1000 times a week on a slow week and 2,000 on a busy week. Thank you to all my visitors. Keep reading!
2024 construction spending will be measured to the avg of 2023, $1980 bil. The average Seasonally Adjusted Annual Rate (SAAR) for 2023 is the total spending for 2023, but is was lower in Jan and higher by Dec. By Dec the SAAR was already 6% higher than the average for 2023. So we began 2024 with Dec spending at a SAAR 6% above avg 2023.
As of MAR, the total SAAR is 8.1% above 2023. Rsdn is +5.4%, Nonres Bldgs +10.0%, Nonbldg +10.8%. If growth stalls at the current level for the rest of the year, meaning, if we were to end the year with the SAAR unchanged from today, then we would finish with these gains for 2024. The trend in most cases is up, so I expect end of year we will be a little higher than today.
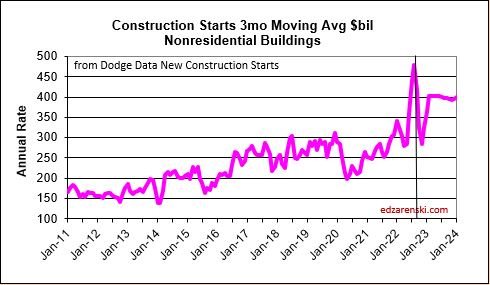
5-24-24 Construction Starts $. Even though Nov and Mar were low, the last 9 months of Nonresidential Bldgs new starts $ was by far the 2nd strongest period of new Nonres Bldgs starts on record, averaging an annual rate (SAAR) of $435 bil. Best since 2nd half 2022 (avg $490 bil.). The last 9 months of Residential $ starts (annual avg $395 bil.) was the best since 1st half 2022 (avg. $438 bil.).
2024 construction spending for Nonres Bldgs, as of MAR, measured to the 2023 avg, is now up +10.0% and trending up. We began 2024 with Nonres Bldgs Dec spending at a SAAR 6% above avg 2023. The American Institute of Architects (AIA) Consensus for Nonres Bldgs, published at the beginning of the year, averages +4% growth over 2023. Only one of the 10 forecasts for Nonres Bldgs spending in the AIA 2024 Consensus is still above the current reading. So, I think it’s safe to say, the AIA Consensus was low right from the very start.
The trend in Nonres Bldgs construction spending is up 18 of the last 19 months and continues up for the next 12 months. To fall to the AIA Consensus average of +4% for the year from the current SAAR, up +10.0%, the remaining 9 months of 2024 would need to fall from the current +10% to average only +2% higher than 2023. It may not be apparent, but that is a continuous decline of more than 1.5% every month for the next 9 months. That’s like falling off a cliff next month and not being able to get up. That’s unrealistic. Unless something sets off a deep recession similar to 2009, that will not happen.
At the beginning of 2007-2010, the first sign of recession for construction was a decline in 2007 of 25% in residential starts. Then in 2008 residential starts fell 40%. In 2009, both residential starts and nonresidential buildings starts fell 30%. Nonbuilding starts fell only 6%. By 2010 starts were increasing. But spending lags starts. Residential spending fell 60% from 2006 to 2009. Nonresidential buildings spending fell 33% from 2008 to 2010.
Although nonres bldgs starts fell 18% in 2020 and residential starts fell 11% in 2023, neither led to a devastating drop in spending as recovery occurred quickly. There is nothing in the current outlook to indicate recession, on any horizon. This forecast does not anticipate a recession.

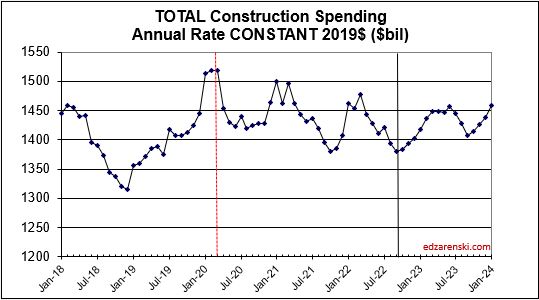
Since the end of 2019, (in Dec 2019 spending hit $1,464T) total construction spending as of MAR’24 is up 46%. After inflation, Volume is up only 6%. The real Volume of Business is spending minus inflation. More than 85% of the spending growth since Dec. 2019 is inflation. If current projections hold, the total business volume through year 2024 will have grown 10% since 2019. ALL business plan forecasts and labor demand should be based on this 10% growth. Inflation adds nothing to business volume.


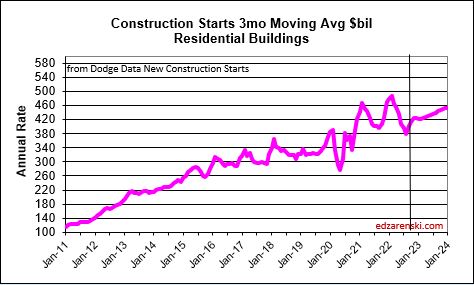
Over the last 9 months, residential new starts (as reported by Dodge) averaged the highest since the peak high in the 1st half of 2022. For Q1’2024, residential starts are 27% higher than Q1’2023. Currently, residential starts for 2024 are averaging 8% higher than the total in 2023. Residential spending peaked at an all-time high in Q2’22. Spending has been level or increasing the last few months at a rate 6.5% lower than the peak, but at a rate 55% higher than Dec 2019. Due to the short durations in residential building, fluctuations in starts are more quickly apparent in spending. Expect both nominal and real (inflation adjusted) spending to continue increasing thru the 1st half 2024, then drop back slightly in the 2nd half 2024. Spending is expected to increase 7% in 2024 over 2023. Volume after inflation should grow 3%.
Single Family spending YTD through Mar. is up 16% from Q1’2023. Single Family rate of spending through Mar. is up 11% over the average (total) spending in 2023. Multi-family spending for Q1’24 is up 6% from Q1’23 and is 2.5% lower than peak spending in Aug ’23, however it’s still up 1% over the avg spending in 2023. These are all nominal values, so real growth is lower. But residential inflation for 2023 was only 3%, so not much lower.


An avg spending curve for long-duration Non-bldg Infra is 15:30:30:20:5. The greatest spending impact does not show up until year two and three after the year in which the projects start. Example: If 2024 posts $100bil in new starts for Infrastructure, only $15bil of that gets put-in-place in 2024. $30bil would get put-in-place in 2025 and 2026.

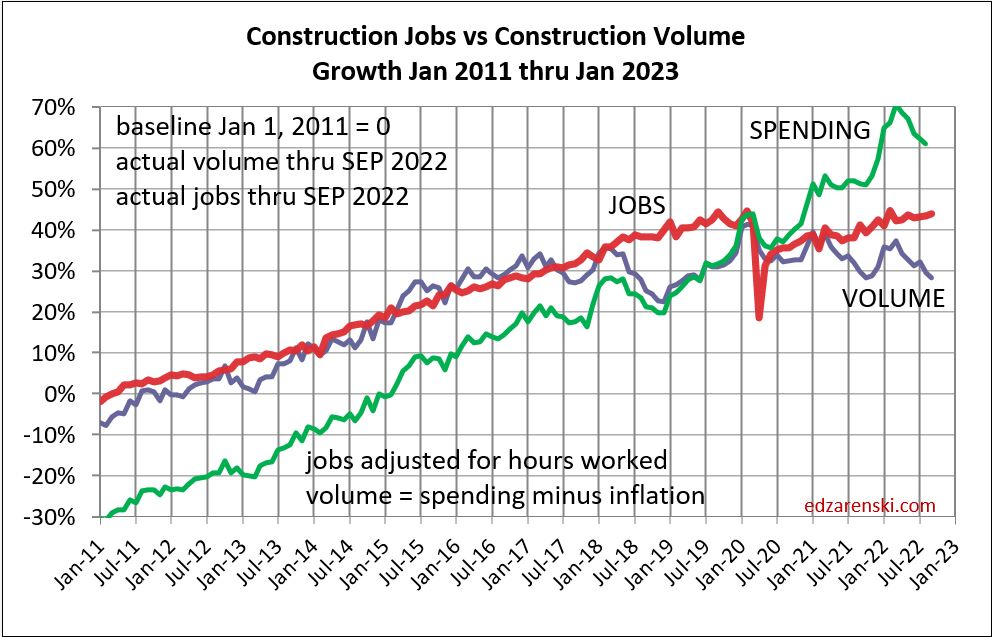
Plots below compare volume growth to jobs growth. Notice the slope of the increase in jobs is fairly constant, regardless of changes in volume growth.
In the past 18 months, Nonresidential Buildings construction spending increased 37%. Nonres Bldgs JOBS increased only 7%. Normally, this would be explained by inflation, but in this case after adjusting for inflation volume still increased 28%. 18 months, +28% volume, +7% jobs.
Jobs and volume of work should be moving together, evenly. The construction industry has been saying jobs shortages, and yet over an 18mo period, the nonresidential bldgs sector added 20% more volume of work than added jobs. Seems to me that would indicate that volume was absorbed by existing jobs. If there were a significant jobs shortage, either the existing crew would need to work overtime, hours worked would have increased, or the work would not have been put-in-place and would potentially have been delayed or postponed. Neither happened. The fact that the work was put-in-place would indicate that the existing workforce readily absorbed the excess workload.


Since 2016, TOTAL construction spending has increased 63%, but after inflation, business volume increased only 6%, or 1%/yr. From 2016 to 2023, jobs increased 2.5%/yr. When jobs are increasing at a greater rate than the volume of work, productivity is declining. That is shown on these plots when the jobs line is above the volume of work line. Volume and jobs should be moving together.
In 2024, construction volume may increase 6%. Don’t expect jobs to increase 6%.

Since 1980, the fastest rates of growth in construction jobs were 1983-85 avg 6.0%/yr. and 1994-99 at 5.4%/yr. All other plus years averaged +3.2%, with only six years above 4%.
Since 2000, (excluding negative yrs, all associated with recessions) construction jobs growth is 3.3%/yr. and average real volume growth is 3.4%. I would expect future jobs growth to remain within the historical averages, somewhere in the 3%-5% range.

Construction Spending – Volume – Jobs
12-3-22
This plot is not showing good performance. Volume and jobs should be moving directly in tandem. When inflation is very high, spending climbs rapidly. But most of the climb is just due to inflation. To find out what’s really going on we need to look at business volume. Take out the inflation $.
Business volume = Spending minus Inflation. Inflation adds nothing to business volume. Inflation adds only to the amount of revenue that changes hands.
In 2022, residential spending is up 16%. Sounds great, homebuilder’s revenues are up 16%. It’s great until you note that residential inflation for 2022 is 15%. Real residential business volume for 2022 increased only 1%.
Since Jan.2020 spending is up 20%. Revenues are up 20%. It’s pretty hard to not think you need additional staff to support 20% growth in revenues. But inflation is 30%. Take out the inflation dollars and we find that volume is DOWN 10%. Well, during that time, jobs increased 1 to 2%. And yet, business volume is down 10%. That’s a massive 11%-12% loss in productivity. With labor being about 35% of the total cost of a job, that’s added about 4% to total inflation.
I recently read an article that stated (attributed to Assoc. Bldrs. & Contractors) that the construction industry needs to add 1,000,000 jobs over the next two years. Here’s why that won’t happen:
1) The construction industry has never added more than 440,000 jobs in one year. It’s only gone over 400,000 four times in 50 years, the last time 2005, and never two years in a row. The most construction jobs added in a year since 2011 is 360,000 in 2014. The average growth rate from 2011 thru 2019, and now also in 2022, is 230,000 jobs per year. The most jobs added in any two consecutive years is just over 700,000 in 1998-99 and 2005-06. So, the construction industry may not have the capacity to grow 1,000,000 jobs even in two years.
2) Since the Pandemic, nonresidential construction volume is down 20%, but nonresidential jobs are down only 1.5%. Compared to 2019, nonresidential construction has an 18% business volume deficit. In other words, Nonres construction in 2022 now has 18% more jobs per volume of work put-in-place than it did in 2019. Total ALL construction business volume in that period is down 10% while jobs are up 1.5%.
3) Inflation is playing a key roll here. In 2022, construction spending is increasing $160 billion or 10%. But inflation is 13%. Real total construction business volume in 2022 is down 3%. Jobs are up. For 2023, spending is forecast to gain $80 billion, 4.6%, but after inflation volume will be down 1%. 2023 numbers are driven down by residential.
4) In 2023, nonresidential volume increases $35 to $40 billion. Residential volume drops $50 billion. It takes 4000 to 5000 jobs to put-in-place $1 billion of volume in one year. Nonbuilding and nonresidential buildings growth of $40 billion would need 160,000 to 200,000 new jobs. Some small amount of that will come from the drop in residential. But, go back and read #2 again.
Since Jan 2020, the construction industry as a whole has nearly +175,000 (+2%) more workers to put-in-place -$175 billion (-10%) LESS volume. That’s a huge loss to productivity that may take years to recover, if ever.


Construction Briefs Nov’22
Construction is Booming. Well, OK, construction is setting up to be booming in 2023-2024. New construction starts for Sept are down 19% from August and yet starts are still near the highest levels ever. Sept is 4th highest total starts ever, all four of the highest ever months of new starts are in 2022. July and Aug were the two highest months of new starts ever. Total growth in starts over 2021-2022 > Nonres Bldgs +50%, Nonbldg Infra +40%, Residential (all in ’21) +22%.
STARTS

Construction Spending will not be participating in a 2023 recession. Except, residential might. Residential starts in 2021 were up +21% to a really high new high. But starts are forecast flat in 2022 and 2023. Spending grew 44% in the last 2yrs, but inflation was 30% of that 44%. With zero growth in starts forecast for 22-23, spending struggles to keep up with inflation. Residential will post only an increase of 3% in 2023 spending, but midyear there is potential for 6 consecutive down months.
See also Construction Year-End Spending Forecast Dec’22
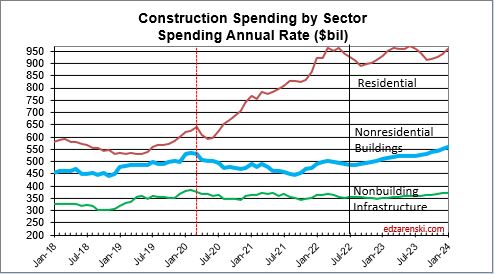
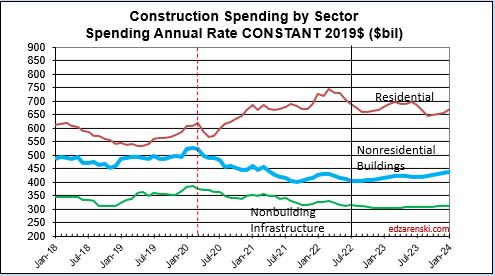
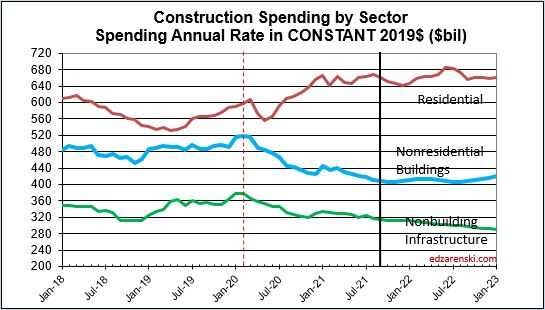
SPENDING BY SECTOR CURRENT $ AND INFLATION ADJUSTED CONSTANT $


Nonresidential Buildings new starts last 2yrs (2021-2022) are up 50%. Spending next 2yrs (23-24) is forecast up 21%.
Nonbldg starts 2022-23 are forecast up 38%. Spending 2023-24 forecast up 20%.
In 2023, it’s Nonresidential Buildings leading growth. In 2024, it will be Nonbuilding Infrastructure leading spending growth. Both are expected to grow more than the inflation index, so there will be real volume growth to report.
Residential construction (Dodge) starts since Jan 2021 have posted 17 out of 21 months of the highest residential starts ever posted. The 5 highest months ever are all in 2022.
Nonresidential Bldgs starts in Sept dropped 23% from August and yet still that was the 3rd highest month ever. July and August were 2nd and 1st.
Construction starts for Nonresidential Bldgs posted each of the last 4 (consecutive) months thru October higher than any months ever before. The avg of last 4 (consecutive) months is 33% higher than the avg of the best previous 4 mo ever (even non-consecutive). Growth in Manufacturing construction starts for 2022 far surpasses growth in any other market, up over 150% year-to-date.
Construction Spending Sept total up 0.2% from Aug. Aug & Jul were revised up 1.1% & 1.3%. Total spending YTD thru Sept’22 is up 11.4% from Sept’21. MAJOR movers; Mnfg up 16% since Jun. Jul & Aug were revised up 7.4% & 8.4%. Highway is up 9% since June. Jul & Aug were revised up by 4.0% & 4.4%.
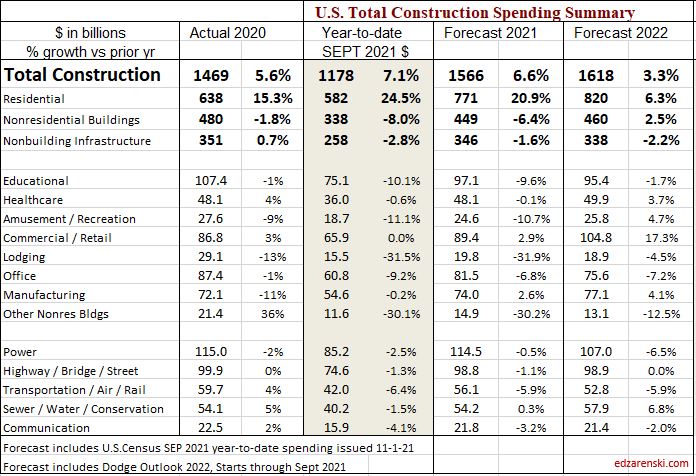
SPENDING FORECAST

Total construction spending for 2022 is on track to increase +11.1%. Residential +16.8%, Nonres Bldgs +9.5%, Nonbldg +0.5%.
Comm/Rtl +18% Mnfg +32% Power -8% Pub Utilities +14%.
Current and predicted Inflation SEE Construction Inflation at Year-End 2022
Inflation adjusted volume is spending minus inflation.
Total volume for 2022 falls 1%. Rsdn +3%, Nonres Bldgs -1%, Nonbldg -9%.
Total volume for 2023 is up 1%. Rsdn -3%, Nonres Bldgs +8%, Nonbldg +2%.
SPENDING TOTAL ALL $ CURRENT $ AND INFLATION ADJUSTED CONSTANT $
Overall Construction Spending is up 15% since the onset of the pandemic, but, after adjusting for 25% inflation, volume is down 10%. Residential jobs are near even on track with volume, but Nonres and Nonbldg have volume deficits of approx 20-25% vs jobs.
- Feb 2020 to Aug 2022
- Resdn spend +42%, vol +6.5%, jobs +7%
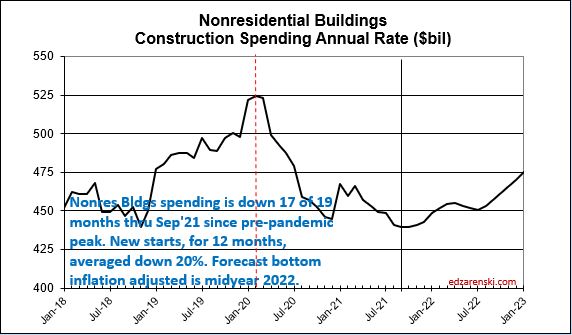
- Nonres Bldgs spend -8%, vol -24%, jobs -3%
- NonBldg spend -7.5%, vol -24%, jobs +1%
JOBS VS CONSTRUCTION VOLUME VS SPENDING (VOL = SPENDING MINUS INFLATION

Labor Shortage? Jobs should track volume, not spending growth. Vol = spending minus inflation. Volume is down while jobs are up. If the same production levels ($ put-in-place per worker) as 2019 were to be regained, theoretically, nonresidential volume would need to increase 20% with no increase in nonresidential jobs. I don’t expect that to occur, therefore, productivity will remain well below that of 2019.
LABOR PRODUCTIVITY

Over the next year or two, there could be several billion$ of construction spending to repair hurricane damaged homes in Florida. That spending will NOT be reported in Census spending reports. Renovations to repair natural disaster damage are not recorded in construction spending. Construction spending to replace homes entirely lost to damage IS reported in Census spending, but is reported as renovations/repair, not new SF or MF construction.
RESIDENTIAL SPENDING SF-MF-RENO CURRENT $ AND CONSTANT $


Construction Jobs and Inflation
Construction jobs through August 2022 increased to 1.1% above the pre-pandemic high in Q1’20. Factoring in hours worked, we find that is reduced slightly to show jobs x hours worked for August 2022 is 0.4% lower than the peak in Q1 2020. Most anyone would say jobs have returned to the pre-pandemic high.
Construction spending through July is 14.3% higher than the pre-pandemic high in Q1’20. BUT INFLATION through July is 23% higher than pre-pandemic Q1’20. Therefore real construction volume (spending minus inflation) is currently 7% BELOW the pre-pandemic high in Q1 2020.
Jobs are up, but volume is down.
So, when you read that jobs are back to pre-pandemic levels, maybe that’s not as great as you might think. Sure more people are back to work, but has the volume of work needed to support those jobs increased sufficiently?
Inflation hides a lot of reality. We now produce 7% less volume of work put-in-place with 1.1% more workers putting in 0.4% less hours than before. That’s a huge construction productivity loss, down 6.6% in the last 30 months. Where does that productivity loss show up in the data?
Here’s the plot of actual and forecast CONSTRUCTION SPENDING. Compare this to the next plot.
Here’s the plot of actual and forecast CONSTRUCTION SPENDING ADJUSTED FOR INLATION.
Notice, Residential volume is up 11% since Q1 2020, but nonresidential buildings volume is still down 23% and non-building volume is down 18%.
Let’s say construction labor is 35% of total construction cost. If wages go up by 5%, then total cost goes up by 5%x35% = 1.75%. Well, if productivity declines by 6.6%, labor cost goes UP by 6.6%x35% = 2.3%.
That’s the inflation cost. Here’s a look Behind the Headlines. These two plots show the number of jobs required to put-in-place $1 billion of volume (inflation adjusted spending) or the inverse, the amount of volume put-in-place by one job in one year.


It’s great that jobs are coming back, but don’t overlook the cost that has added to inflation. Don’t expect to see a lot of improvement over the next 12 months. In fact, if jobs continue to grow at the current rate (or any rate for that matter), this time next year the imbalance is worse.

Construction Economics in Pictures 11-5-21
These data reflect Sept’21 construction spending Put-in-Place, Jobs and hours worked thru Oct’21, Dodge Nov’21 New Starts Outlook 2022, Inflation factors thru Q3’21


Construction Inflation 2021
This post, originally written in Jan 2021, and updated several times, is viewed over 1,000 times a week.
>>> 2-1-23 SEE Construction Inflation 2023
2-11-22 SEE Construction Inflation 2022
See Feb 2022 note below and updated table at bottom of file.
10-15-21 update – Link to PPI data from Jul to Sep. Table PPI Inputs Sep21. Updated BCI plot.
As of Sept 2021, PPI for materials inputs to construction is up ytd 15% to 18%. For the 18 months since March 2020, the onset of Pandemic, the PPI for materials inputs to construction is up ytd 23%, but the PPI Buildings Cost Index for final cost to owner is up only 5% to 6%. (Part of this can be attributed to periodic PPI forecast updates).
As of 10-15-21, nonres bldgs inflation for 2021 is estimated at 4.6% and residential at 12.9%. Those increases are reflected in the tables and plots below. Both have been trending up.
11-10-21 From Sept to Oct materials price changes were normal, but Final Demand prices jumped what could be considered an entire year’s worth of increase in just one month. We’ve been watching the price pass thru increase slowly, until now. This is the single largest monthly increase in Final Demand pricing since the indices were started in 2006.
As of 11-10-21, nonres bldgs inflation for 2021 is estimated at 6.8% and residential at 15%. The 2022 forecast is estimated at 4.5% for nonres bldgs inflation and 7% for residential.
As of Jan 2022, not all nonresidential sources have updated their Q4 inflation index. A few are still reporting only 4% inflation for 2021, but several have moved up dramatically, now reflecting between +10% to +14%. My estimate for 2021 inflation has been changing, moving up again. Nonres bldgs inflation for 2021 is currently estimated at 8.7% and residential at 15%. Graphs in this post are not yet updated. The 2015-2023 table of indices has been updated 1-20-22.
2-10-22 Here’s a list of 2021 indices average annual change and date updated.
- +8.4% Construction Analytics Nonres Bldgs Dec
- +14.1% PPI Average Final Demand 5 Nonres Bldgs Dec 2021
- +11.4% PPI average Final Demand 4 Nonres Trades Dec
- +1.9% Turner Index Nonres Bldgs annual avg 2021 Q4 2021
- +4.84% Rider Levett Bucknall Nonres Bldgs annual avg 2021 Q4
- +12.6% Mortenson Nonres Bldgs annual avg thru Q3 2021
- +11.7% U S Census New SF Home annual avg 2021 Dec
- +7.4% I H S Power Plants and Pipelines Index annual avg 2021 Dec
- +7.1% BurRec Roads and Bridges annual avg 2021 Q4
- +6.0% FHWA Fed Hiway annual avg 2021 Q4
- +9.11% R S Means Nonres Bldgs Inputs annual avg 2021 Q4 2021
- +10.0% ENR Nonres Bldgs Inputs annual avg 2021 Dec
- +7.2% Ready Mix Concrete Inputs Dec
- +16.4% Lumber/Plywood Inputs Dec
- +46% Fabricated Steel Inputs Dec
- +39% Sheet Metal Inputs Dec
- +21% Gypsum Products Inputs Dec
- +9.6% Flat Glass Inputs Dec
- +23% Copper Products Inputs Dec
- +55% Aluminum Products Inputs Dec
The 2022 forecast is estimated at 4.5% for nonres bldgs inflation and 7% for residential.
Construction Spending Update 10-1-21
Construction Jobs Outlook 10-11-21 read the section on impact of inflation
Inflation – PPI data June-Sept 2021 some materials up 20%-40% but final cost up only 5%-6%
8-15-21 update – These links at top here point to most recent inflation data, to supplement this post. The latest construction spending forecast reflects inflation of 4-6% for nonresidential and 12-13% for residential. The latest tables and BCI plot, as of 8-15-21, are at the very bottom in this file. All 2021 indices have increased since my May 2021 Inflation Report. These tables have the latest.
Also See Construction Inflation Report May 2021 for downloadable report
1-25-21 What impacts should we expect on Construction Inflation in 2021?
In April 2020, and again in June 2020, I recommended adding a minimum 1% to normal long-term construction inflation (nonres longterm inflation = 3.75%), to use 4% to 5% for 2020 nonresidential buildings construction inflation. Some analysts were suggesting we would experience deflation. Deflation is not likely. Only twice in 50 years have we experienced construction cost deflation, 2009 and 2010. That was at a time when business volume was down 33% and jobs were down 30%. In 2020, volume dropped 8% from Feb to May and we’ve gained half that back by Dec. Jobs dropped 14%, 1,000,000+ jobs, in two months! Now volume is still down 4% and jobs are down 2% from Feb peak. We’ve gained back 850,000 jobs. But also, we’ve gained back more jobs then volume. That adds to inflation.
Volume drops another 5% in 2021, all nonresidential, and then another 3% in 2022. Jobs could drop overall 8%-10% for all of 2021-2022, 500,000 to 700,000 jobs.
Even though material input costs are up for 2020, nonresidential inflation in 2020 remained low, probably influenced by a reduction in margins due to the decline in new construction starts (-24%), which is a decline in new work to bid on.
Volume = spending minus inflation.
Residential business volume dropped 12% from the January 2020 peak to the May bottom, but has since recovered 22% and now stands at a post Great Recession high, 10% above one year ago. Although residential spending remains near this high level for the next year, volume after inflation begins to drop by midyear. For the year 2020, Residential Building Materials Inputs are up 6.2%. See PPI charts. Sharply higher lumber prices have added more than $17,000 to the price of an average new single-family home since mid-April ($24,000 as of 3-30-21). Residential inflation averaged 5.1% for 2020. (UPDATE 3-30-21 – Single Family home prices increased 11% since March 2020. Lumber cost is now 3x what it was in March 2020. These will both impact cost to build SFH).
10-15-21 – The U.S. Census Single-Family house Construction Index increased 6.7% from Feb 2020 to Feb 2021. Since February 2021 through August it is up another 8.5% for the last 6 months. https://www.census.gov/construction/nrs/pdf/price_uc.pdf
Nonresidential volume has been slowly declining and is now down 8.5% from one year ago. I had forecast by 3rd quarter 2021, nonresidential buildings volume would be down 15% lower than December 2020, or 25% below the Feb 2020 peak. It’s down 5.5% from Dec’20 and down 23% from the Feb’20 peak. This tracks right in line with the 24% decline in new construction starts in 2020. Most of the spending from those lost starts would have taken place in 2021, now showing up as a major decline in spending and work volume. Nonresidential inflation for 2020 dropped to 2.5%, the first time in 7 years below 4%. It’s expected to increase in 2021.
The Producer Price Index tables published by AGC for year-end 2020 https://www.agc.org/sites/default/files/PPI%20Tables%20202012.pdf shows input costs to nonresidential buildings up about 3.5% to 4.5% for 2020, but final costs of contractors and buildings up only 1% to 2%. This could be an indication that, although input costs are up, final costs are depressed due to lower margins, a result of fewer projects to bid on creating a tighter new work available environment which generally leads to a more competitive bidding environment. This could reverse in 2021 as the volume of work to bid on in most markets begins to increase.
As of Sept 2021, PPI for materials inputs to construction is up ytd 15% to 18%. For the 18 months since March 2020, the onset of Pandemic, the PPI for materials inputs to construction is up ytd 23%, but the PPI Buildings Cost Index for final cost to owner is up only 5% to 6%. Construction inflation is very different right now for subcontractors vs general contractor/CM.
11-10-21 From Sept to Oct materials price changes were normal, but Final Demand prices jumped in just one month what could be considered an entire year’s worth of increase. We’ve been watching the price pass thru increase slowly, until now. This is the single largest monthly increase in Final Demand pricing that I can remember. In part, the disparity between these two indices is a data collection issue in how Census gets this information. The Oct increase in the Final Demand index represents several months of growth, all reported at once. Final demand indices are just catching up.
This October 2021 increase is not yet reflected in any other building cost inflation index.

PPI data for Jun – Oct Updated 11-10-21
The Turner Construction 2020 Cost Index for nonresidential buildings averaged 1.8% higher than the avg for all of 2019. The Turner index appears to show the lowest gains in forecasts for 2021, up only 1.4% ytd though Q2. http://turnerconstruction.com/cost-index
The Rider Levitt Bucknall nonresidential buildings average index for 2020 increased 3.5%. Q3 2021 compared to Q3 2020 is up 5.5%. https://www.rlb.com/americas/
R.S.Means quarterly cost index of some materials for the 4th quarter 2020 compared to Q1: Ready-Mix Concrete -1.8%, Brick +10%, Steel Items -1% to -5%, Framing Lumber +32%, Plywood +8%, Roof Membrane +5%, Insulating Glass +12%, Drywall +3%, Metal Studs +23%, Plumbing Pipe and Fixtures +1%, Sheet Metal +20%. https://www.rsmeans.com/landing-pages/2020-rsmeans-cost-index

U.S. manufacturing output posts largest drop since 1946. Think of all the manufactured products that go into construction of a new building: Cement, steel, doors, frames, windows, roofing, siding, wallboard, lighting, heating systems, wire, plumbing fixtures, pipe, valves, cabinets, appliances, etc. We have yet to see if any of these will be in short supply leading to delays in completing new or restarted work.
There have been reports that scrap steel shortages may result in a steel cost increase. Scrap steel prices are up 27% in the last quarter and up 40% for the year 2020. Scrap is the #1 ingredient for new structural steel. The U.S. steel industry experienced the most severe downturn since 2008, as steelmakers cut back production to match a sharp collapse in demand and shed workers. Capacity Utilization dropped from 82% in January 2020 to 56% in April. In mid-August, CapU was up to 61%, still very low. As of January 23, 2021 CapU is up to 76%, well above April’s 56% but still below desired level. Steel manufacturing output is still down compared to pre-covid levels. Until production ramps back up to previous levels there may be shortages or longer lead times for delivery of steel products. In August 2021, CapU is back to 85%.
Steel Prices at mill in the U.S. are up 60% to 100% in the last 6 months. All prices are 50% to 75% higher than Feb 2020. http://steelbenchmarker.com/files/history.pdf . This is mill price of steel which is about 25% of the price of steel installed. What affect might a steel cost increase have on a building project? It will affect the cost of structural shapes, steel joists, reinforcing steel, metal deck, stairs and rails, metal panels, metal ceilings, wall studs, door frames, canopies, steel duct, steel pipe and conduit, pumps, cabinets and furniture, and I’m sure more. Assuming a typical structural steel building with some metal panel exterior, steel pan stairs, metal deck floors, steel doors and frames and steel studs in walls, then all steel material installed represents about 14% to 16% of total building cost. Structural Steel only, installed, is about 9% to 10% of total building cost, but applies to only 60% market share being steel buildings. The other 6% of total steel cost applies to all buildings. https://www.thefabricator.com/thefabricator/blog/metalsmaterials/steel-prices-reach-levels-not-seen-since-2008 At these prices, if fully passed down to the owner, this adds about 1.5%-2% to building cost inflation. With demand in decline for nonresidential buildings, I would expect to see all these steel price increases recede. Also, take note, as of January 2021, none of this steel price movement appears captured in the PPI data or RSMeans data.
Contractors have been saying they have difficulty acquiring the skilled labor they need. This has led to increased labor cost to secure needed skills. I expect the decline in nonresidential work volume in 2021 to result in as much as a decline of 250,000 nonresidential jobs in 2021. This results in labor available to fill other positions.
This SMACNA report quantifies that labor productivity has decreased 18% to meet COVID-19 protocols. https://www.constructiondive.com/news/study-finds-covid-19-protocols-led-to-a-7-loss-on-construction-projects/583143/ Labor is about 35% of project cost. Therefore, just this productivity loss would equate to -18% x 35% = 6.3% inflation. Even if, for all trades, the average lost time due to COVID-19 protocols is only half that, the added inflationary cost to projects is 3% above normal. But that may not remain constant over the entire duration of the project, so the net effect on project cost would be less.
Post Great Recession, 2011-2020, average nonresidential buildings inflation is 3.7%. In 2020 it dropped to 2.5%, but for the six years 2014-2019 it averaged 4.4%. Residential cost inflation for 2020 reached 5.1%. It has averaged over 5% for the last 8 years. The 30-year average inflation rate for nonresidential buildings is 3.75% and for residential it’s over 4%.
This survey of members by AGC https://www.agc.org/sites/default/files/2021_Outlook_National_1221_.pdf just published provides some insight into construction firms outlook for 2021.
Almost every construction market has a weaker spending outlook in 2021 than in 2020, because approximately 50% of spending in 2021 is generated from 2020 starts, and 2020 nonresidential starts are down 10% to 25%, several markets down 40%. Nonbuilding starts are down 15%, but will increase 10% in 2021.
Typically, when work volume decreases, the bidding environment gets more competitive. We can always expect some margin decline when there are fewer nonresidential projects to bid on, which typically results in sharper pencils. However, if materials shortages develop or productivity declines, that could cause inflation to increase. We can also expect cost increases due to material prices, labor cost, lost productivity, project time extensions or potential overtime to meet a fixed end-date.
Constant $ plot updated 10-14-21
Constant $ = Spending minus inflation = Volume

Many projects under construction had been halted for some period of time and many experienced at least short-term disruption. The delays may add either several weeks to perhaps a month or two to the overall schedule, in which case, not only does labor cost go up but also management cost goes up, or it could add overtime costs to meet a fixed end-date. Some of these project costs have yet to occur as most would be expected to add onto the end of the project.
Some projects that were put on hold (nonresidential buildings starts in 2020 dropped 24%) just prior to bidding in 2020 may now re-enter the bidding environment. The rate at which these projects come back on-line could impact the bidding environment. If several months worth of projects that delayed bidding last year all come onto the market at once, or at least all in a more compressed time span than they would have, the market could be flooded with work and bidding contractors now have more choice, can bid more projects than normal and could potentially raise margins in some bids. This would have an inflationary effect. Also, there can be difficulty in starting many projects at the same time, rather than more staggered starts. It burdens subcontractors and suppliers with too much of the same type of work all going on at the same time. This could exacerbate labor issues and could lead to project time extensions.
The hidden inflationary costs of bidding environment, project time extensions, potential overtime and lost productivity haven’t all yet appeared in the data. Some of these could still add to 2020 inflation. Also, the huge loss of new starts in 2020, which meant fewer projects to bid on in 2020, probably reduced margins in 2020. Nonresidential starts are projected to increase 4% in 2021, so that could lead to some recovery of margins, however, even with 4% growth in new starts, that comes after a 24% drop in 2020, so remains still 20% below 2019. Total volume of work is declining and new projects available out to bid is still depressed, so pressure on margins still exists.
update 4-15-21 Although materials cost inflation will be higher, I expect non-residential buildings inflation final cost in 2021 to range between 3.5% to 4.0%, with potential to be held lower. Subcontractor costs, such as for steel or lumber, could range much higher due to huge material cost increases. All the downward pressure on nonresidential inflation is on margins. There is currently 20% less nonres bldgs work to bid on than in Q1 2020.
updated 3-30-21 Expect 2021 residential inflation of 6% to 8% with potential to push slightly higher.
See Construction Inflation Index Tables for indices related to Nonbuilding Infrastructure work and for more links to sources.
(10-15-21 The tables and plot below include updated residential costs and updated nonresidential inputs).

The tables below, from 2011 to 2020 and from 2015 thru 2023, updates 2020 data and includes Q3 PPI data thru Sept and provides 2021-2023 forecast. The three sectors, highlighted, are plotted above.
NOTE, these tables are based on 2019=100.

The following table shows 2021 updated as of 10-15-21 reflecting 4.6% inflation for nonresidential buildings and 13% for residential.
As of 10-14-21, nonres bldgs inflation is estimated at 4.6% and residential at 12.9%. Those increases since August are reflected in these tables.
11-10-21 From Sept to Oct materials price changes were normal, but Final Demand prices jumped what could be considered an entire year’s worth of increase in just one month. We’ve been watching the price pass thru increase slowly, until now. This is the single largest monthly increase in Final Demand pricing that I can remember. Prior to this I expected future cost increases to add on slowly. This changes the entire outlook.
11-10-21 Construction Analytics and PPI Data have been updated for 2021, 2022 and 2023. Other firms forecasts will be updated when they post, so there may be differences. For example CA 2021 index for nonres bldgs now reflects a +6.5% annual increase. Turner Q3 2021 is still indicating just +3%.
11-10-21 Nonres bldgs inflation for 2021 is estimated at 6.8% and residential at 15%. The 2022 forecast is estimated at 4.5% for nonres bldgs inflation and 7% for residential. Increases to CA and PPI since Sept are reflected in this table.
As of Jan 2022, not all nonresidential sources have updated their Q4 inflation index. A few are still reporting only 4% inflation for 2021, but several have moved up dramatically, now reflecting between +10% to +14%. My estimate for 2021 inflation has been changing, moving up again. Nonres bldgs inflation for 2021 is currently estimated at 8.7% and residential at 15%. Graphs in this post are not yet updated. The 2022 forecast is estimated at 4.5% for nonres bldgs inflation and 7% for residential.
The 2015-2023 table of indices has been updated 2-10-22. However, there is still some potential for 2021 data to move higher.

How to use an index: Indexes are used to adjust costs over time for the affects of inflation. To move cost from some point in time to some other point in time, divide Index for year you want to move to by Index for year you want to move cost from. Example : What is cost inflation for a building with a midpoint in 2021, for a similar nonresidential building whose midpoint of construction was 2016? Divide Index for 2021 by index for 2016 = 108.2/87.0 = 1.24. Cost of building with midpoint in 2016 x 1.24 = cost of same building with midpoint in 2021. Costs should be moved from/to midpoint of construction. Indices posted here are at middle of year and can be interpolated between to get any other point in time.
All forward forecast values, whenever not available, are estimated by Construction Analytics.
Also See Construction Inflation Report May 2021
Also See Construction Inflation Index Tables the post for links to dozens of other indices

To Support Construction Jobs, We Need Volume
11-2-19
12-6-19 plots updated to include Nov jobs and Oct spending.
Construction Spending IS NOT Construction Volume.
I read an analyst report this week that stated construction jobs growth isn’t keeping pace with construction volume growth. The reference appeared to be to construction spending. That fails to apply inflation to convert construction spending to construction volume, so compares apples to oranges. Spending must be adjusted for inflation to get real volume growth. Jobs MUST be compared to volume.
For over two years now, construction volume growth has not supported construction jobs growth we’ve seen. I expected jobs growth to slow down. I’ve been saying this for over a year. This sure looks like it.
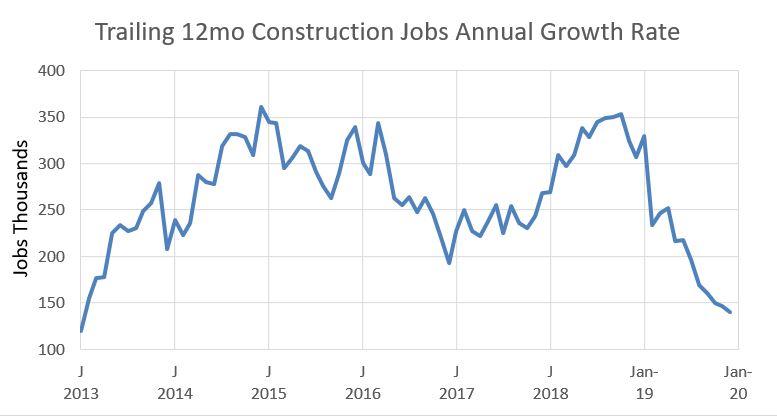
For 2018 jobs growth averaged over 300k. Since January 2019 the rate of jobs growth has dropped from 300k to 150k.
Current projected new starts data IS NOT supporting construction volume growth for the next 2 yrs. Growth of 3%/yr in non-building infrastructure will be offset by declines in residential buildings and flat nonresidential buildings. Therefore, there is no real volume support for jobs growth.
This plot adjusts construction spending by taking out inflation to get real construction volume growth. Last year of real volume growth was 2016. Yet jobs continue to climb. This can’t continue. The plot above shows it has slowed.

Construction jobs growth has slowed considerably over last 2Q, as expected. While construction jobs are up about +150k in last year, jobs (through Nov) increased only +48k in the last 7 months. I’m expecting this trend to continue. In fact, I wouldn’t be the least bit surprised to see in the near future some months when construction jobs decline. The fact is, construction volume simply does not support jobs growth.
Total construction volume, spending after accounting for inflation, has been down for 5 of the last 6 quarters. Volume peaked from Q1 2017 to Q1 2018, but the last year of real volume growth was 2016. Volume is flat or down while jobs continue to rise. This can only mean contractors will be at risk of being top-heavy jobs if a downturn comes.
Caution is advised if putting emphasis on construction JOLTS, which has been climbing to new highs. From mid-2006 to mid-2007, JOLTS reached near the then all-time high. But construction volume, starting in mid-2006, was already on the downward slope. Volume peaked in early 2006 and fell 10% by mid-2007. Construction did not begin shedding jobs until late 2006, but mid-2007, job losses were well underway. Within 12 months, more than 500,000 jobs were gone. Within 18 months, construction jobs were down 1.5 million.
Construction spending annual rate will increase by 3% in the next 12 months, but volume in constant $ after inflation will remain flat. In Q42020-Q12021 spending slows to less than inflation, so volume begins a modest decline. Growth of 3%/yr in non-building infrastructure will be offset by declines in residential buildings and flat nonresidential buildings. Jobs will continue to grow and spread the imbalance even more.
The construction jobs slow down has been in the cards for a long time. With all the talk of skilled labor shortages, there’s been little discussion of the unsustainable excess jobs growth. Maybe it’s about time to change the conversation.
Construction JOLTS – What’s wrong with this picture?
7-10-18
In the 24 months from May 2016 to May 2018, Construction Volume went up 3.0%. Jobs went UP by 8%, 500,000 jobs. Spending in that 24 month span increased by just over 12%, but inflation for that period across all construction averaged 9%, hence real volume increased only 3%. That’s a $35 billion increase in volume, enough new work to support 175,000 to 210,000 new construction jobs.
JOLTS (Job Openings and Labor Turnover Survey) job openings went up from 2.4% to 3.0%, up 50,000 openings. Jobs growth exceeded volume growth by more than double and yet job openings went up!
Not only did jobs growth of near 8% far exceed that needed to support the growth in new work, but also, because jobs growth was so strong, it should have reduced job openings.
What’s wrong with this picture?

Pretty obvious the numbers just don’t add up. First, since construction spending is always later revised up, in recent years by 2%, let’s be generous and assume spending will get revised up by 2%, and let’s keep inflation the same. That would result in a 5% increase in volume or closer to $60 billion in volume. That would support 300,000 to 360,000 new jobs, a need still well below the actual growth in jobs of 500,000.
No matter how we look at it, even generously supposing spending will later increase by 2%, jobs have increased greater than volume of work.
Companies predict job openings based on positions they need to fill within 30 days. But, what if their judgement of positions they need to fill is determined based on what they anticipate from increases in revenue, without taking inflation into consideration. Since revenue also includes inflation, which adds nothing to business volume, that would overestimate the need for new jobs. We’ve seen this before, in the last expansion.
2003-2006 construction spending increased by 35%, the most rapid increase in spending in over 30 years. But construction inflation during that four year period totaled over 30%, the most for four consecutive years dating back to 1978-1981. After adjusting for inflation real volume in 2003-2006 was up by less than 5%. Considering how high spending was and how much it felt like growth, there was surprisingly little. That did not hold back jobs expansion.
Construction firms added 15% to jobs, or 1,000,000 jobs during this period, more than 3x the actual need. Job Openings in the JOLTS report increased 100%+, from 100,000 to over 200,000. Firms hired far more than needed and kept increasing the report of job openings, even though they had already hired far more than required. In 2006, housing starts dropped 15%, residential spending dropped 25%, but residential jobs still increased by 6%. From 2003 to 2006, spending on nonresidential buildings increased by 20%, all of it inflation. Volume remained stagnant these four years, however jobs increased by 10%.
Clearly the increases in jobs during this period correlate more with spending than real inflation adjusted volume growth. This four-year period registered the largest productivity decline in over 30 years because the rate of jobs growth was much faster than volume growth.
For 2018-2019-2020, construction spending is currently forecast to increase 6.7%, 3.0% and 4.2%. But after adjusting for inflation, real construction volume is predicted to increase only in 2018 by about 2%. For 2019-2020 volume declines or remains flat.
An argument could be made that JOLTS openings is dependent on firms outlook for growth in the near future. For that, let’s look at predicted volume growth in 2nd half 2018 and in 1st half 2019. It is predicted spending will increase 1.5% in the 2nd half vs 1st half 2018. But adjusted for inflation, volume will decline by 1%. Likewise, for the 1st half 2019, although spending will increase, inflation will outpace spending and real volume will decline 1%. There is nothing in past data or forecast that would support an increase in forecast job openings.
See also What Jobs Shortage? 7-6-18 for related info.
Could it be that some firms are anticipating job needs based on spending, not on volume? Could it be that these firms are not adjusting revenues for inflation to get volume before using the data to prepare a business plan? This is not entirely anecdotal. In several presentations I’ve given over the years I’ve asked the audience, How many of you plan your business needs on your revenue? In a show of hands at a presentation to NHAGC, a large portion of the audience raised their hand.
If your construction company revenues are up 6% in a year when inflation is 5%, then your net volume is up only 1%. Your company jobs growth required is only 1%.
You cannot ignore the impact of inflation when forecasting jobs need.
