Construction Spending Actual through August 2021
Total Construction Spending compared to same period 2020 is now up 7.0% year-to-date (ytd). Residential spending continues to perform better than forecast and is now up 25.8% ytd. Nonresidential Buildings is now down -8.7% and Nonbuilding Infrastructure is down -3.8%, both improved in the last two months.
The single largest impact to the change in this forecast from last month is Residential. Spending continues to perform better than cash flow predicted from starts would indicate. For August, I expected residential spending to drop 1% compared to July, but it increased 0.4%. Also, it increased from an upwardly revised July. In this August spending report, residential spending was revised upwards in both June and July by 1% each month. That pushes the total up for my forecast for the year.
Highway also posted large upward revisions, +3% to June and +2% to July, but these revisions combined represent only $515 million. The Residential revisions alone total $2.2 billion, more than double the revisions to all other markets combined, including Highway.
Year-to-date through August, while residential is up 25.8%, all but one single nonresidential market is down. 15 of 16 nonresidential markets are down -8.7% for nonresidential buildings and -3.8% for nonbuilding infrastructure. Only Sewage/Waste Water is up 3.6% ytd., but that’s only 2% of all nonresidential construction. It’s half of the $ in the table item Sewer / Water / Conservation.
By year end I expect residential spending to finish up 20%, nonresidential buildings to finish down 7% and nonbuilding to finish down 3%.
Construction starts are slowly leading the way to recovery, with remarkable strength in residential, but construction spending, which is dependent mostly on starts from previous years (nonres bldgs starts in 2020 down -20%), will remain depressed for nonresidential construction well into 2022. New nonresidential starts could double from the current rate of growth and it still wouldn’t be enough to turn 2021 nonresidential spending positive.
Residential starts gained only +3% in 2019, increased +6% in 2020 and are forecast up +9% in 2021 and +7% in 2022. Residential spending surprisingly increased +15% in 2020 to $638 billion and is forecast up +20% to $767 billion in 2021, but only +4% in 2022. Both residential starts and spending are at all-time highs. That is driving total spending to new highs.
Nonresidential Bldgs starts fell -4% in 2019, -21% in 2020 and are now forecast up +8% in both 2021 and 2022. New starts for 2021 are still -20% below the peak in 2018. Most of the fall off in starts in 2020 would have produced peak spending in 2021. Nonresidential Bldgs spending fell only -2% in 2020 but is expected to fall -7% in 2021 and -2% in 2022.
Comparing combined 2020 and 2021 starts, the only markets to show positive growth over 2019 are Commercial/Retail, +5% (due to warehouses) and Healthcare, +7% (due to hospitals). The average growth in starts of all other nonresidential buildings markets for 2020 x 2021 combined is still 35% lower than 2019. Public Bldgs increased in 2020 but fell back in 2021.
My forecast, ever since August 2020, has been showing a decline in nonresidential buildings spending on a long downward trend through 2021 and into 2022. That forecast was then and still is now correct. The nonresidential building spending plot below shows that spending has declined in 16 of the last 18 months. Spending hits a bottom in 2022.
Nonbuilding starts were up 3% in 2019, fell -15% in 2020 and forecast indicates +6% growth in both 2021 and 2022. Nonbuilding starts are 10% lower than 2019. Nonbuilding spending gained only +1% in 2020, but the forecast is down -3% for 2021 and is expected to drop -5% in 2022. Like nonresidential buildings, the large drop in 2020 starts would have had peak spending well out at the midpoints of those projects, many of which would have been in 2021 or 2022.
For more on construction starts SEE New Construction Starts as of Aug’21

Behind the Headlines
An anomaly in the data is the Manufacturing spending data versus expectations. In 2020, Dodge posted a 57% drop in new starts for Manufacturing. Since many of these type projects have long time spans to completion and peak spending is near the midpoint of a project schedule, most of the drop in spending from that huge loss of new starts would normally occur in years following the starts. I predicted the drop would occur in 2021 and 2022, expecting it would produce a 20% decline in spending in 2021. But year-to-date Manufacturing spending is down only 1%. It did produce an 11% decline in 2020 spending, but that is not the extent of the total loss. This puts into question either my forecast of when the drop would occur or percent decline in starts reported. You can’t have a drop of 57% in starts activity and get only a 1% decline in spending the following year. Based on spending in 2020 and 2021 ytd, my forecast model is indicating there may be a variance in 2020 starts data % of market captured.
Part of the difficulty with the manufacturing data arises from the fact that history shows only approximately $20bil/yr to $30bil/yr is captured in the new starts data reported and yet spending has been in the range of $70bil/yr to $80bil/yr. That means only about 25% to 35% of the total market activity is being captured in the starts data. But from this we need to predict 100% of the future spending. This % of total market captured in the starts data fluctuates up and down. So the difficulty is predicting actually how much of the market is captured, and that varies. The question is this: How much of the change in the starts data reflects an expected change in future market activity versus how much of the change in starts reported represents an unidentified variance in % of market captured. A variance in % of market captured in the data may not indicate a change in future market activity (spending). Since project schedules can be anywhere from less than 20 months to more than 4 years, any given year of actual spending could have some portion of that spending generated by project starts from the previous 4 or more years. It takes several years of actual spending to identify the differences in these two parts of the question. Only future data will help resolve this question.
Another set of data to question is residential starts. Currently, for 8 months through August, starts are up 18% over 2020. Starts began to climb in July 2020 and posted a very strong final 5 months of 2020. This year average starts to date is at all-time highs. But Dodge, in the 3Q21 Outlook, forecast 2021 residential starts up about 9%. In order for that to happen, for the remaining 4 months residential starts would need to drop 20% from the current average rate, 10% below the most recent month. That seems a bit unrealistic. That would set the monthly rate back to a point lower than anything experienced since the pandemic lows in Apr-May-Jun last year. It seems to me residential starts will finish quite a bit higher than that. I’m carrying 15% growth for the year in my forecast.
Recovery
Recovery in both nonresidential buildings and nonbuilding backlog begins to build in a few markets in 2021. Even though starts growth in % is greater than spending growth in %, overall spending in nonresidential buildings and non-buildings in dollars, not %, is exceeding new starts. Therefore both will begin 2022 with lower backlog than 2021. Total all nonresidential 2021 starting backlog dropped -9% from 2020. Starting backlog to begin 2022 will be down another -5%. Based on forecast growth in new starts, backlog increases 4% for 2023.
Aside from residential, recovery to the levels of revenue (spending) recorded in Q1 2020 or earlier won’t show up before 2024.
The following table shows ytd through August $ and forecast for 2021/2022. Almost every nonresidential market is down ytd and down compared to the average in Q1 2020 before Pandemic Recession.

Impact of Pandemic Slowdown
The impact of reduced starts in 2020 is showing up in the 2021 year-to-date results. Total Nonresidential Buildings starts were down -20% from April 2020 through March 2021 compared to pre-pandemic high in Q1 2020. Nonres Bldgs starts improved from Apr-Jul 2021 and for those 4 months managed to equal the pre-pandemic high. However, the 2021 average year-to-date through August is still 14% lower than the pre-pandemic high. Nonbuilding Infrastructure starts returned to pre-pandemic high several months ago, but have since slowed.
Due to the large drop in new nonresidential buildings starts from Apr 2020, that continued at a level down -20% until March 2021, some markets will be affected by a downward trend in spending for two to three years.
The greatest downward impact from a -20%, year-long loss of starts in nonresidential spending will be felt throughout 2021 and into 2022.

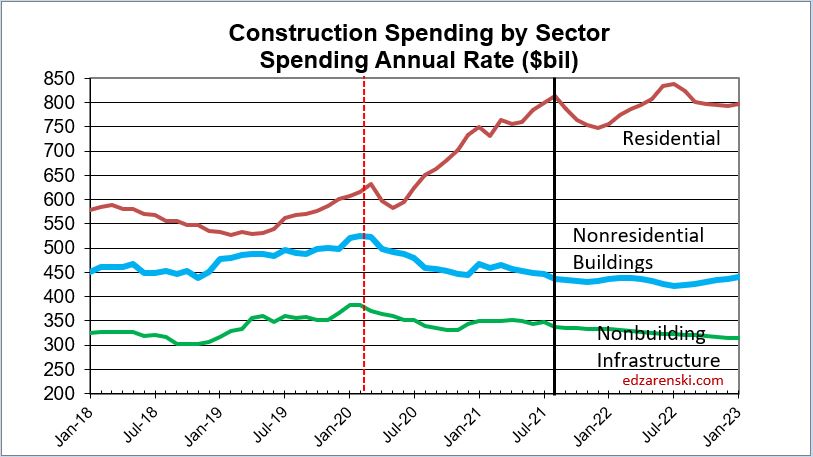
Construction Analytics has been describing this situation and provided plots showing what would occur in nonresidential buildings spending since August 2020. A review of the historical forecasts will show those forecasts mostly correct. The plot below, Construction Spending by Sector, shows the current forecast and actual data through August 2021. The explanation and the plotted data have been similar since last year.
Over the next 9 months, every sector will post more down months (in spending) than up months, although the declines will be most noticeable in nonresidential buildings. The plot line for Nonresidential Buildings may not look like much is going on, but in a minute you will see the magnitude of that downward sloping line.
Overall performance forecast by sector has changed very little since May of this year.
While most markets recover to positive new starts growth in 2021, spending growth lags, showing the downward trend in 2021 as a result of lost starts in 2020.
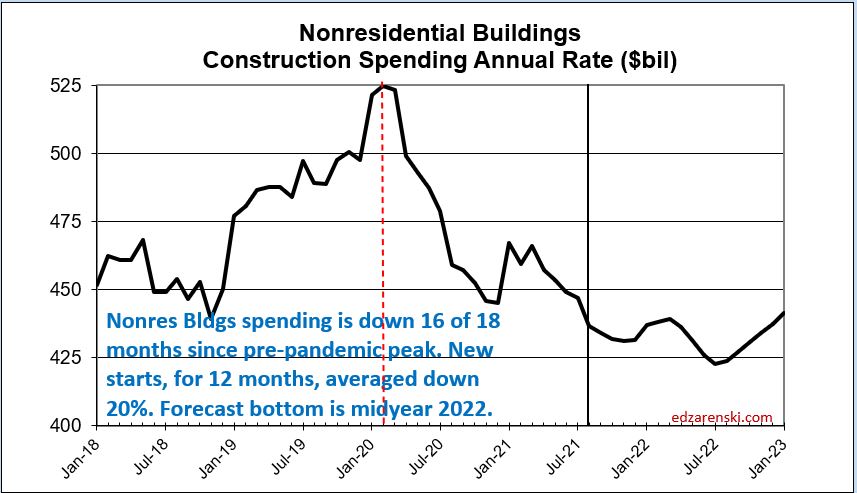
This next plot changes the scale so the nonresidential buildings spending data can be visualized much easier. This is the exact same data as in the Construction Spending by Sector plot above. The scale change helps to visualize the dramatic decline in nonresidential buildings spending. From Apr through Dec 2020, nonresidential buildings spending fell at a rate of 1.75%/month. Jan 2021 and Mar 2021 are the only up months since Feb 2020. From Apr 2021 through Aug 2021, the rate of spending fell at 1.25%/month. Currently, the annual rate of spending is 17% below the pre-pandemic peak. By midyear 2022, the annual rate of spending will be -20% lower than the pre-pandemic peak. It could take two to three years after that to recover to the pre-pandemic level of spending.
A typical batch of new nonresidential construction starts within a year gets spent over a cash flow schedule similar to 20/50/30, that is, 20% of all starts in the calendar year gets spent in the year started, 50% in the next year and 30% in years following. Total nonresidential buildings starts in 2020 were down -20% ($90 bil in spending) and nonbuilding starts were down -10% ($35bil). Under normal conditions, we know how much of that $125 bil would have occurred in 2020, 2021 and 2022. That’s a loss of spending this year, and that loss remains a steeply downward slope as long as starts remain depressed. Nonresidential buildings starts, depressed for 13 months, posted starts indicating recovery beginning in April this year.
Infrastructure
Let’s assume INFRASTRUCTURE BILL new starts begin in Jan 2022, and let’s also assume $100 billion worth of work gets awarded in 2022. That’s $100 billion of starts in 2022. Only a maximum of 20% (the 1st year portion of the cash flow 20/50/30) gets spent in the 1st year. Therefore, even if $100 billion in new infrastructure starts begin in 2022, only 20% of that or only $20 billion would get spent in 2022. So, there will be very little impact on total 2022 construction spending as a result.
That changes dramatically for the second year. For 2023 we get 50% of the spending from 2021 starts and 20% from 2022 starts, so $70 billion in spending, growth of $50 billion.. That’s already more than the industry can handle.
Total Public Infrastructure and Public Institutional, the total public work pool for which infrastructure investment is a potential, represents a total LESS THAN $350 BILLION annually, less than 25% of all annual construction. Average growth is $12 billion/year. Looking back to 1993, this subset has never exceeded $35 billion in growth in a single year. If we award (start) $100 billion in new work each year for the next 5 years, we would cap out the growth rate for spending in this subset of work, with no room for any additional new starts from any other sources. The work would be completed after 8 years.

Forecasting Reliability
All the forecast spending in the data above is developed from monthly cash flow of new starts. This plot shows the history of the cash flow forecast (the light colored line) to the actual spending growth (the darker line). The cash flow forecast has been predicting the drop in nonres bldgs spending since last year. Although actual spending is somewhat more uneven, the forecast accurately predicts the direction spending is headed.

2021 Midyear Forecasts
Here’s how my (Construction Analytics) midyear spending forecast compared to various firms’ data published in the AIA Midyear Forecasts and how we all compare to the current August year-to-date spending. The year-to-date (ytd) performance provides insight into expected final 2021 performance. For example, the year-to-date Educational spending is -10.6% with 8 months of spending recorded. You can see in the table, one firm had forecast that educational will finish up 3.5% for the year. (Not shown here, but the AIA Consensus for Educ. is -2.1%). With 8 months of actual ytd data and only 4 months remaining (estimate to complete or etc), we can tell what would be needed in the remaining 4 months to get to any particular estimate.
To finish the year up +3.5%, for the next 4 months Educational spending would need to average +32% year-over-year (yoy) growth per month over last year to swing from currently down -10.6% to up +3.5% . Well, Educational spending is down 16% from the 2020 high, has been averaging down 11% yoy for the last 7 months, has fallen 7 of the last 8 months and is down mo/mo an average of 1.5%/mo for the last 6 months. With this performance over the past year, the probability is not likely at all that Educational construction spending is going to flip from a negative yoy -10.6% to an avg of +32%/mo for the remaining 4 months to finish the year up +3.5%. (To meet the AIA Consensus for Educ., the final 4 months would need to swing to +15%/mo). While there are some good estimates, there are many more examples like this in the AIA forecasts.
In 2020, more of Construction Analytics midyear forecasts by market were closer to the final actual than any other firm reporting in the AIA Midyear Outlook. Here’s the 2021 midyear forecasts compared to the current August year-to-date. Every forecast in the AIA Midyear 2021 report predicts 2022 nonresidential buildings spending will increase. See my spending forecast table above in this report where I’ve projected many nonresidential market down in 2022.

