The most recent BLS jobs report was released Oct 8, 2021. I expected construction jobs to decline. For the last 4 months, volume of work has been flat at 2% below the 1st quarter. My forecast indicated no support for jobs growth, but jobs increased.
11-5-21 update Construction jobs report for October added 44k jobs, but The Story once again is in hours worked. Hours dropped 3.5% this month from 40.1 to 38.7. Even though jobs increased by 44k (+0.7%), actual total workforce hours worked dropped 2.8%. See plot at bottom of report that shows Oct jobs vs volume.
Construction added 22,000 jobs in September. Jobs have increased only 4 out of 9 months this year. Since a large increase of 93,000 in March, construction has gained only 6,000 jobs. For all of 2021, jobs are up by 47,000. But after a brief increase in the 1st quarter 2021, volume of work is down, now down 2% since Q1 2021, only 1% above the lowest point since the onset of the pandemic and 6% below the pre-pandemic level.
In March and April of 2020 we lost 1.1 million jobs. But every month in 2020 after that we gained back jobs, all of that driven by large gains in residential work. There was no recovery in any nonresidential work in 2020. In fact, all nonresidential work continued to decline throughout the year. How much support did we get for jobs growth?
Inflation Does Not Support Jobs
We cannot overlook the affect of inflation. As of 10-14-21, nonres bldgs inflation for 2021 is estimated at 4.6% and residential inflation is estimated at 12.9%.
Inflation adds to total spending but adds nothing to total work volume. Construction spending minus inflation (Volume) is what supports jobs. Spending is always reported in Current $, the value of the dollar at that time. Spending minus inflation is Constant $. Constant $ = Volume. Most of the increase in residential construction spending in these past two years is INFLATION. Nonresidential spending and volume are both down. There is no meaningful increase in total construction volume to support jobs growth.

Spending versus Volume through August 2021 since February 2020:
Residential spending is up +32%. After adjusting for inflation the real change in volume is up only +14%. Most of the 14% increase in volume occurred in 2020. Since Dec 2020, residential volume is up only 3.5%.
Nonresidential Buildings spending is down -17%. After adjusting for inflation, the real change in volume is down -22% (down 17% in 2020 and 5% ytd in 2021).
Nonbuilding Infrastructure spending is down -12%. After inflation, the real change in volume is down -19% (down 13.5% in 2020 and 5.5% ytd in 2021).
Residential jobs are up only 3%, but volume is up 14%. This is where the greatest need is currently.
Nonres Bldgs jobs are down 6.5%. Volume is down 22%. There is a considerable excess in jobs.
Nonbldg Infra jobs are down 5.5%. Volume is down 19%. There is a considerable excess in jobs.
Total ALL JOBS are down only 2.6%. Total Volume is down 6%. This means productivity is down.
Jobs Imbalances
The need identified in residential, and likewise the excess identified in nonresidential are not as extreme as both seem. There are a large number of jobs classified as nonresidential that actually perform residential work. Any large firm, and all it’s employees, if primary work is on nonresidential buildings, is classified nonresidential for the purpose of the jobs count. Workers are always classified by the primary classification of the firm they work for, not by the type of building they work on. However, the buildings they work on are always classified as to building type. This often occurs in large primarily nonresidential trades such as concrete, structural steel and HVAC, when working on multifamily high-rise buildings. These crossover jobs are not separable from the major classification. Therefore, most often, nonresidential jobs are overstated by workers involved in residential work and residential jobs are understated because some work is performed by firms whose primary classification in nonresidential.
(A separate issue arises from the fact that residential construction employs the largest percentage of immigrant workers, about 40% of the residential workforce, predominantly in southern states. Pew Research provided a study documenting that about 14% of all construction is performed by immigrant workers and about half of all immigrant workers are unauthorized. It is fair to suggest some portion of these residential workers are not being captured in the BLS Jobs survey, contributing to the above noted imbalances in residential jobs versus volume of work. For more information, use the search function in this blog for “Pew Research”).
Hours Worked
In the September BLS report, hours worked per week jumped to 40.0 hours form 38.8 in August. That’s an increase of 3%, an equivalent to adding 225,000 jobs. The recent increase in hours worked could also be equivalent to 40% of the residential workforce working a six-day week versus five days.
Comparisons of hours worked show a little deeper look into the jobs situation. Compared to the average monthly hours worked in the pre-pandemic 12 month period Mar 2019 to Feb 2020, which was a 13-year high: April 2020 was down 16%; Apr-May 2020 average was down 12%; Mar thru Dec 2020 average monthly hours worked was down 5.2%; 2021 year-to-date average monthly hours worked is down only 1.4%.
Now in September 2021 average monthly hours worked is within 0.5% of the peak in Feb 2020, now 1% higher than the 13-year high average in 2019. Keep in mind, current construction volume is still down 6% from Feb 2020.
The increase in total hours worked could have several different explanations: it may be a response to meet current residential demand or to rush to completion jobs that were delayed due to the pandemic; Contractors may add hours if they can’t find enough workers with the needed skills; Contractors may be adopting an approach to meet current work demands by increasing hours rather than adding jobs. Using that last approach would allow contractors to reduce hours, rather than reduce jobs, if future volume of work were to decline. There does not seem to be any increase on the horizon in nonresidential demand. Nonresidential volume has been decreasing 1% to 1.5% per month in 16 of the last 18 months. All sectors are forecast to experience volume declines for the next 6 to 12 months.
11-5-21 update Construction jobs report for October added 44k jobs, but The Story once again is in hours worked. Hours dropped 3.5% this month from 40.1 to 38.7. Even though jobs increased by 44k (+0.7%), actual total workforce hours worked dropped 2.8%. See plot at bottom of report that shows Oct jobs vs volume.
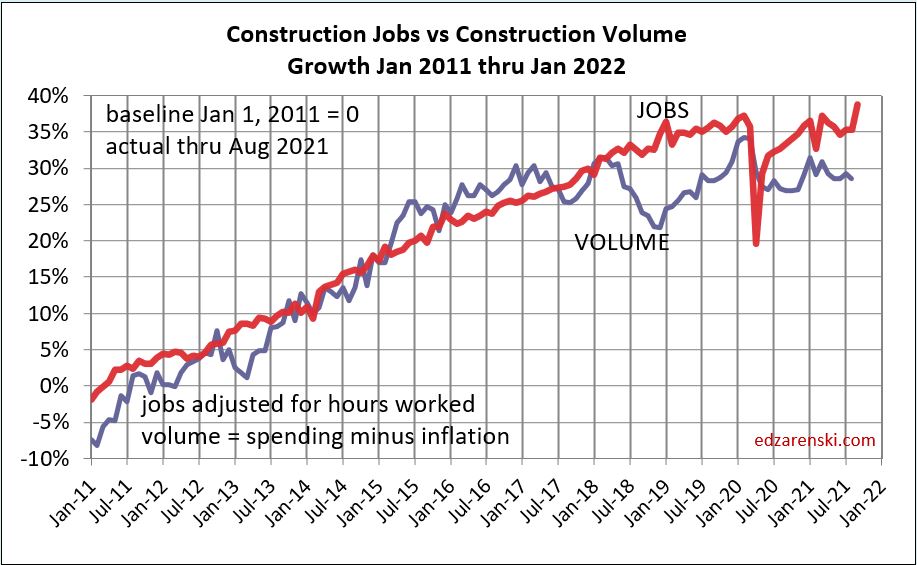
Productivity
Whenever there is insufficient growth in the volume of work to support growth in jobs or total hours worked, productivity is declining. The following plots shows volume of work (spending adjusted for inflation) plotted against jobs adjusted for hours worked. From 2011 through Jan 2018, although there are bumps in the plot, the two moved pretty closely in tandem. A big volume decline in 2018 did not result in a similar jobs decline but volume came back very close to jobs by Jan 2020. Contractors may not respond to an immediate drop in volume by cutting jobs if they anticipate a pickup in volume on the horizon. Since Feb 2020, jobs have recovered to growth, but volume has fallen and is still not in recovery mode. The next 12 to 18 months show volume struggles to recover. Jobs will be affected but contractors may not respond in like fashion.
Spending Forecast / Volume Forecast / Jobs Forecast
For the full spending forecast see Construction Spending Update 10-1-21
Construction spending is on track to increase 5.8% in 2021 over 2020. But after taking out inflation, spending minus inflation, or volume, in 2021 will be down 2.5%. Total spending increases $87 billion over 2020, but after inflation volume will actually be down $32 billion. Residential spending increases $130 billion (+20%), but after 13% inflation residential volume increases only $49 billion. Nonresidential Buildings spending decreases $34 billion but after adjusting for 4.5%+ inflation real nonresidential buildings volume falls $52 billion. Non-building Infrastructure spending decreases only $9 billion but after adjusting for 7%+ inflation real non-building volume falls $30 billion.
All sectors are forecast to decline over the next 6 to 12 months. Residential has already captured large gains this year. Forecast declines are due to moderate ups and downs in when and how strong new starts were posted. Nonresidential construction volume growth is falling due to a huge amount of nonresidential buildings starts (-22%) and to a lesser extent non-building infrastructure starts (-15%) that disappeared from April 2020 through April 2021. The affect of those lost starts, which would have had peak spending from mid-2021 to mid 2022, is such that the volume of work will continue to decline throughout 2021 and well into 2022.
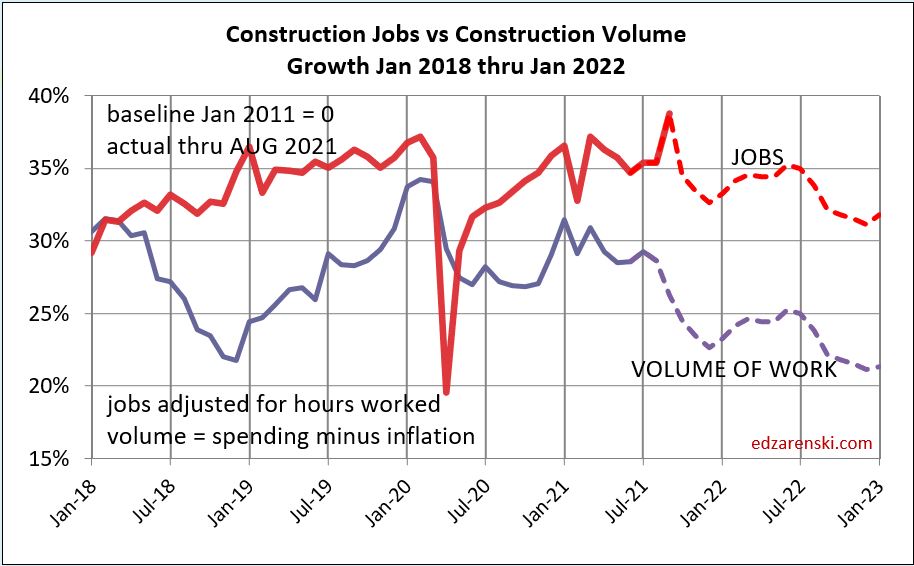
Since Feb 2020, total construction volume has recovered to a point that is down 6%, but jobs have increased back to a level that is down only 2.6%. Jobs are increasing at a rate that is closer to the growth in construction spending, which includes inflation and is substantially greater than the rate of growth of construction volume.
Although jobs should follow growth or declines in volume, as the plot above from 2011 through 2017 shows, things don’t always go as the forecast predicts. If jobs growth follows more closely to volume growth, which it should, this time next year construction could be down another 200,000 jobs.
11-5-21 updated plot below to include Sept spending report and Oct jobs report
11-5-21 update Construction jobs report for October added 44k jobs, but hours worked dropped 3.5% this month from 40.1 to 38.7. Even though jobs increased by 44k (+0.7%), actual total workforce hours worked dropped 2.8%. Plot shows Oct jobs vs Sep volume.

