Home » Forecast
Category Archives: Forecast
Construction Briefs May 2026
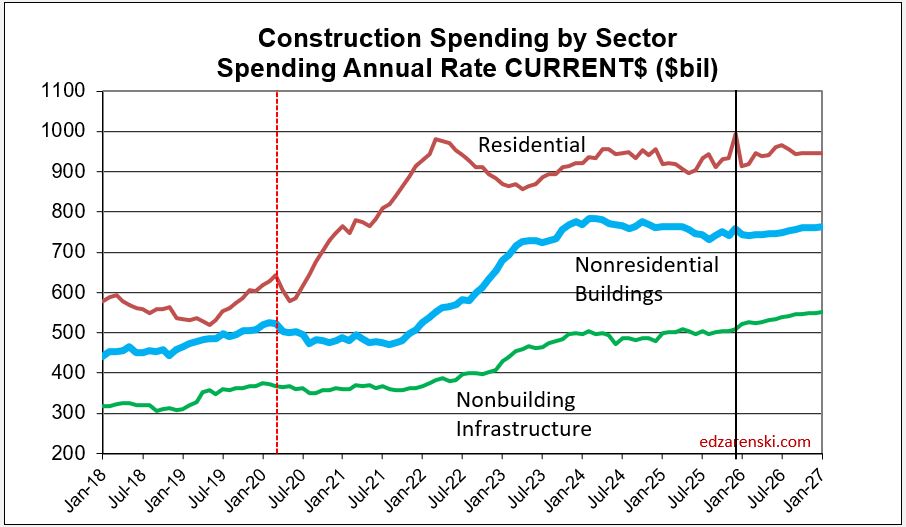
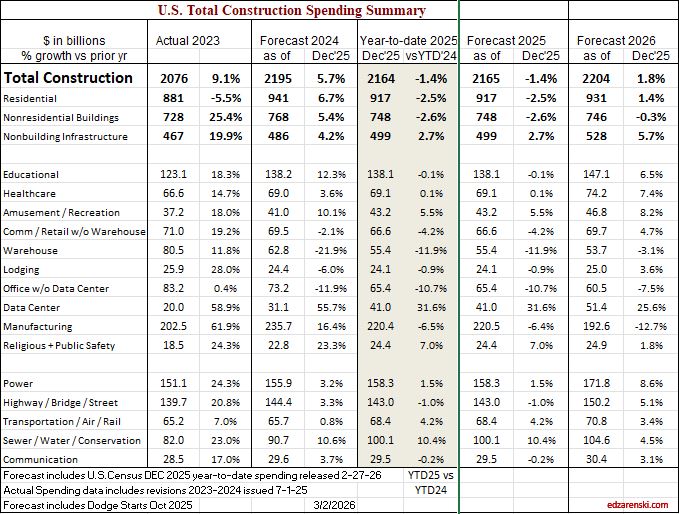
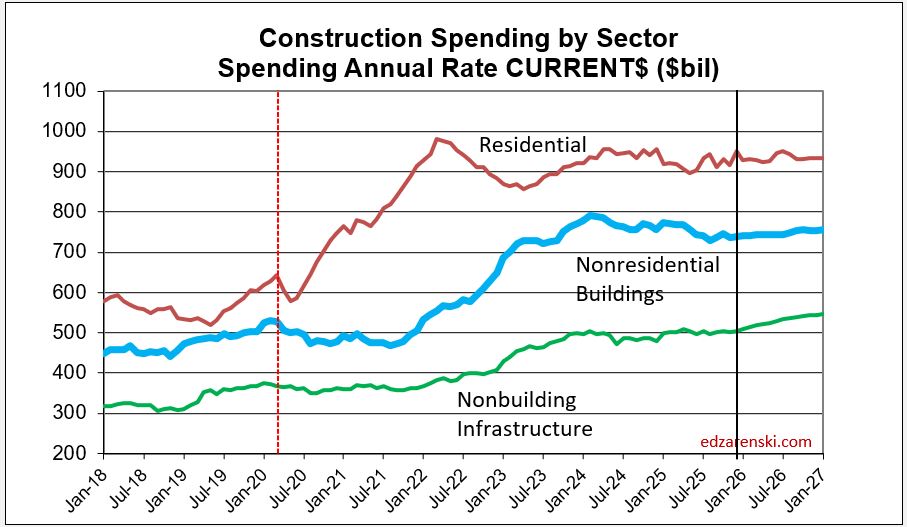
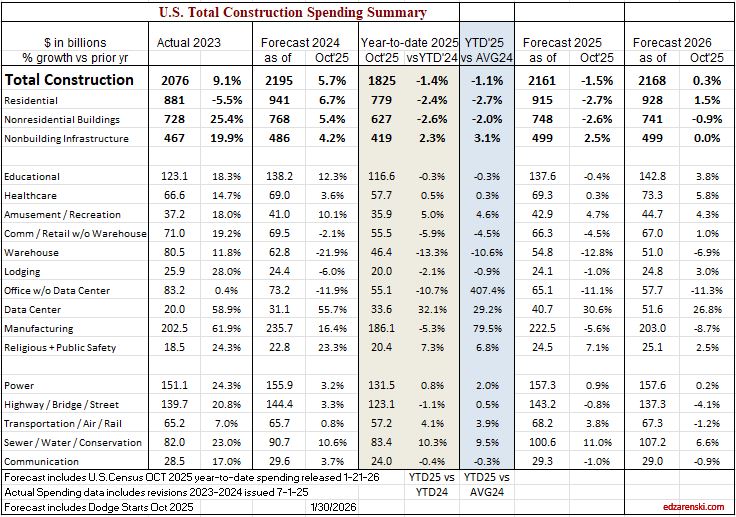
Construction Spending is now in for Jan, Feb and Mar. Spending is up 0.3% year-to-date (YTD) from 2025, but still 0.1% below the annual average 2025. The revised forecast for 2026 total construction spending is $2.225 trillion, expected to finish up 2.5% from 2025.
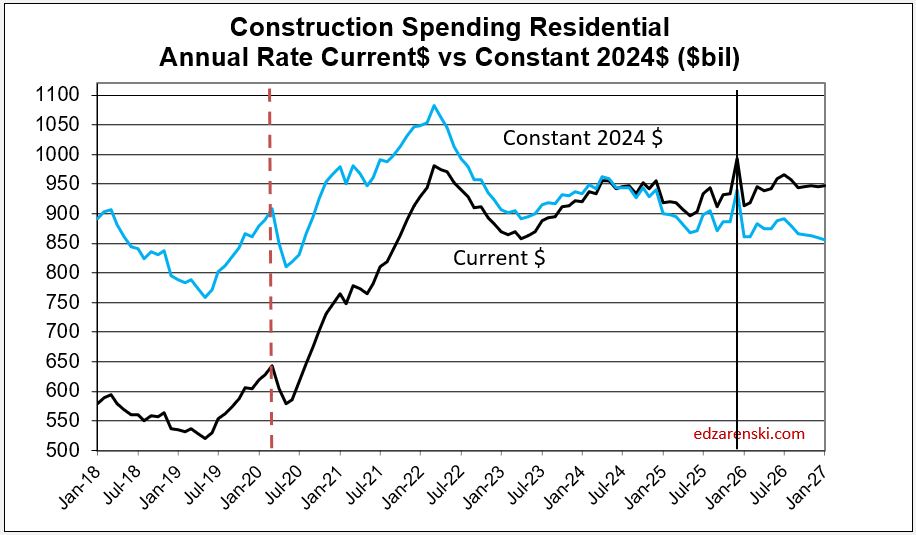
Forecast spending has increased slightly, almost entirely due to a March increase 3% above forecast for Single Family Residential. Residential renovations also added a sizable increase in March. Overall residential spending YTD thru March is 0.8% above Jan-Mar 2025, but it is still 1.6% below the annual average in 2025. The 2nd half of 2025 was much stronger than the 1st half, raising the 2025 average. Residential spending in 2026 is stronger midyear and is forecast to finish up 2.1% from 2025. However, after inflation, that is still a decline of 2%.
Nonresidential Bldgs spending is down 3.1% YTD from 2025 and down 3.4% from the annual average 2025. But spending improves throughout 2026 and is expected to wipe away any deficit and finish 2026 just equal to 2025. Keep in mind, with 4% inflation, that means real nonres bldgs construction volume declines in 2026, for the 2nd consecutive year. In fact, real nonres bldgs volume is currently down 10% from 2024.
Non-building Infrastructure spending is currently up 5% YTD and is forecast to finish 2026 up 7% from 2025. Strong gains in Power and Highway carry infrastructure to a positive forecast.
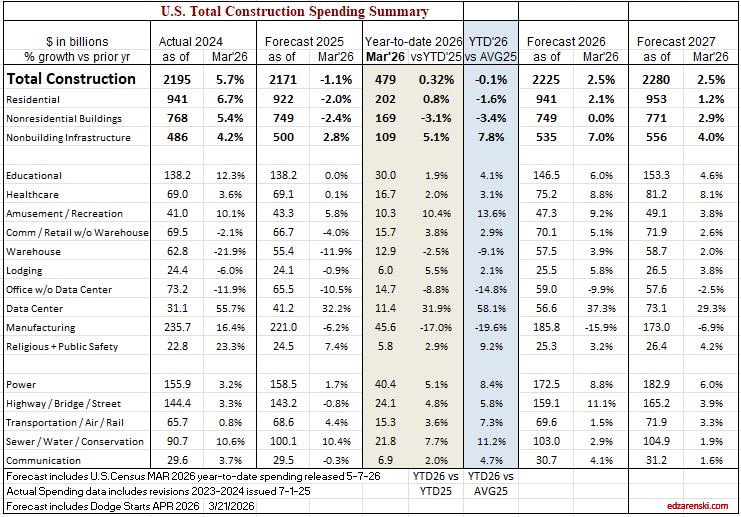
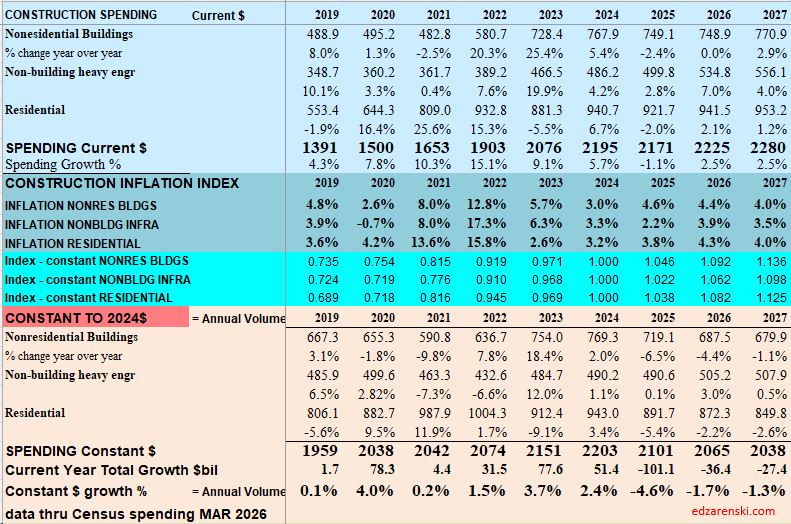
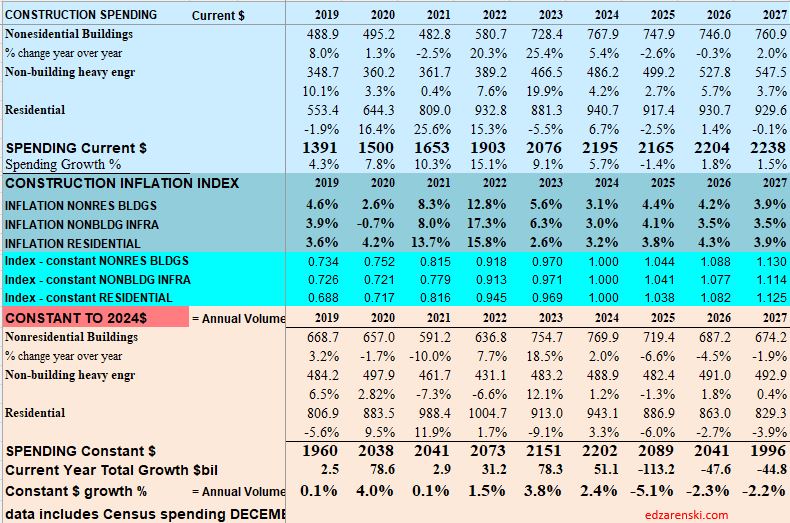
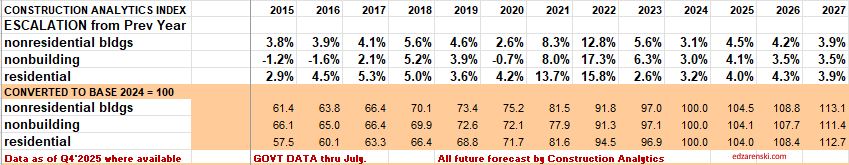
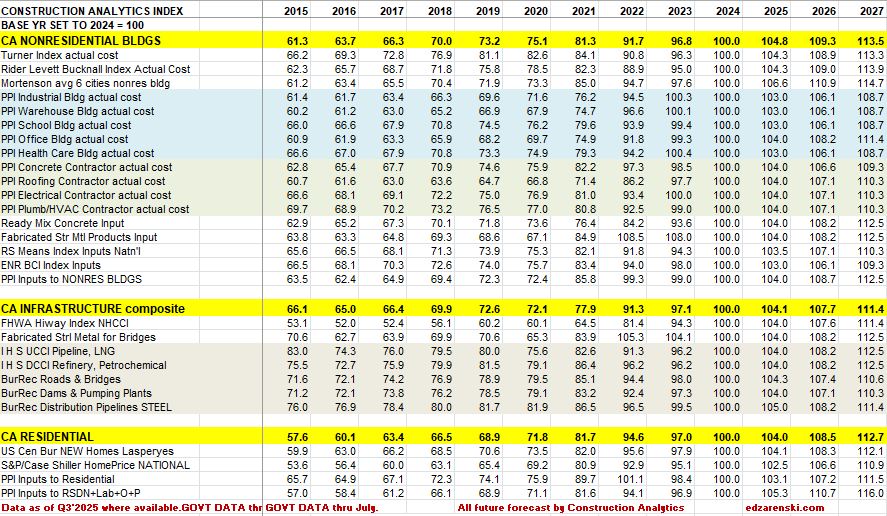
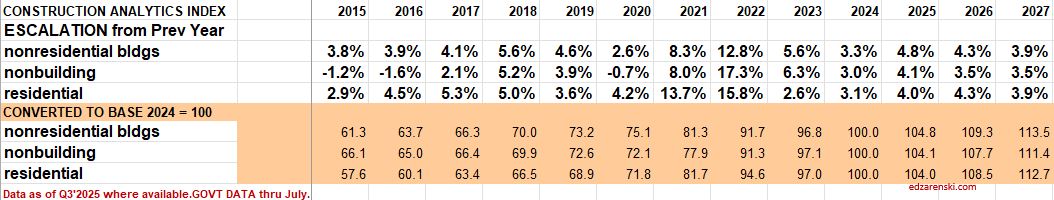
Notice in the table below, I carry inflation at about 4% in 2026. Actual inflation values are all final cost and are a composite of eight different sources, so the inflation carried in these reports will never be the highest or lowest. Predicted inflation reverts to historical averages with some influence of current conditions.
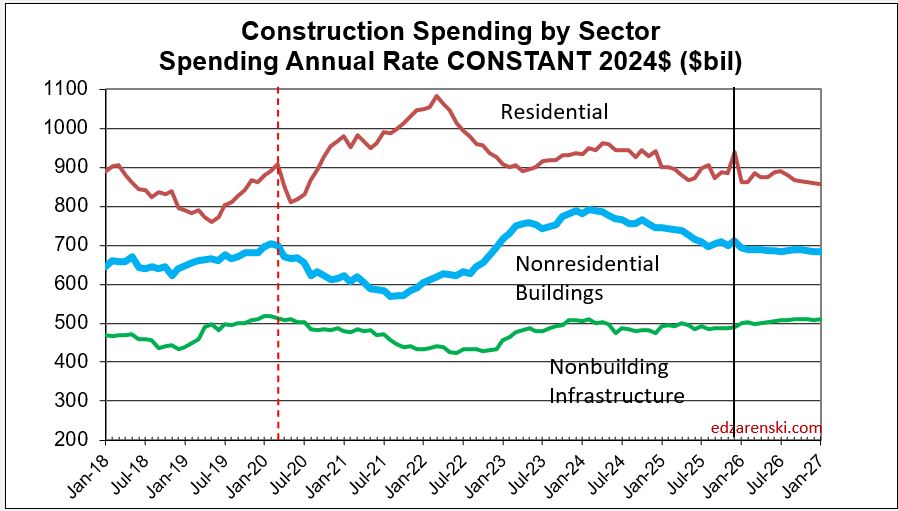
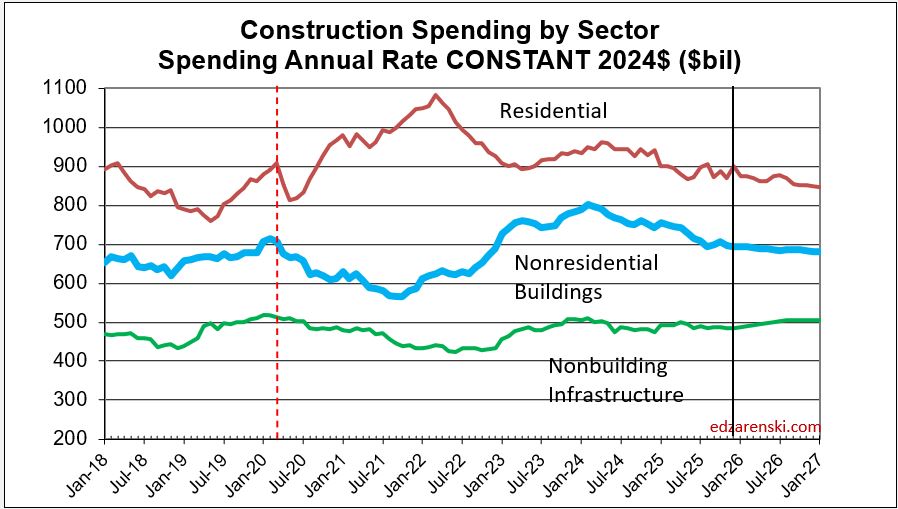
Taking 4% out of all the spending numbers above gives the Constant$ results or actual volume of business conducted. For 2025 business volume declined 4.6%. For 2026 it’s expected to decline about 1.7%. Only Non-bldg Infrastructure has posted real volume of business gains in 2025 and 2026. Spending is up, but volume of business is down.
Constant $ for all tables and plots in this report is inflation adjusted to mid 2024.
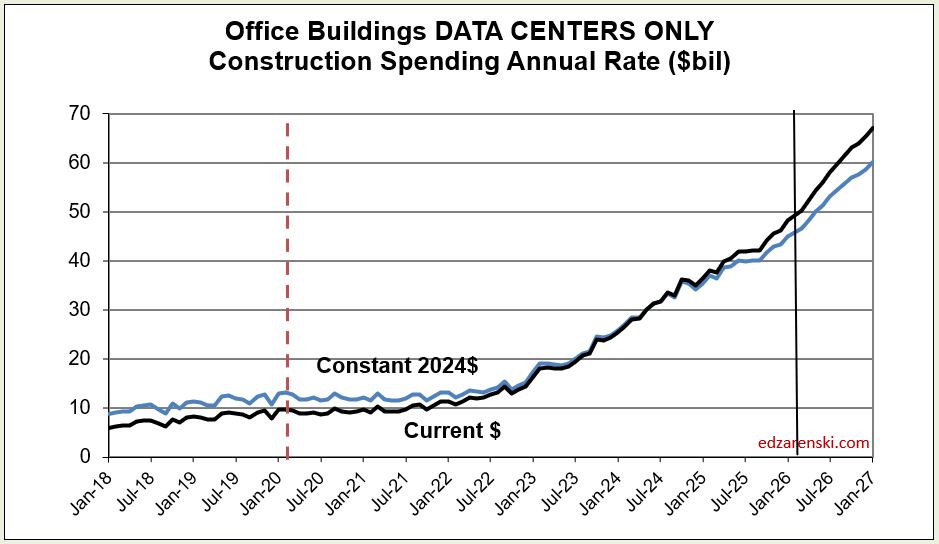
The rate of growth in construction spending for Data Centers averaged 3%+/mo for 36 months. Then for the last 6mo of 2025 it dropped back to <2%/mo. For 1st 3mo of 2026 it’s avg 2.8%/mo. Forecast avg for 2026 is 2.9%/mo.
As of March, DC spending is up 9% since Dec, up 22% from the Avg 2025.
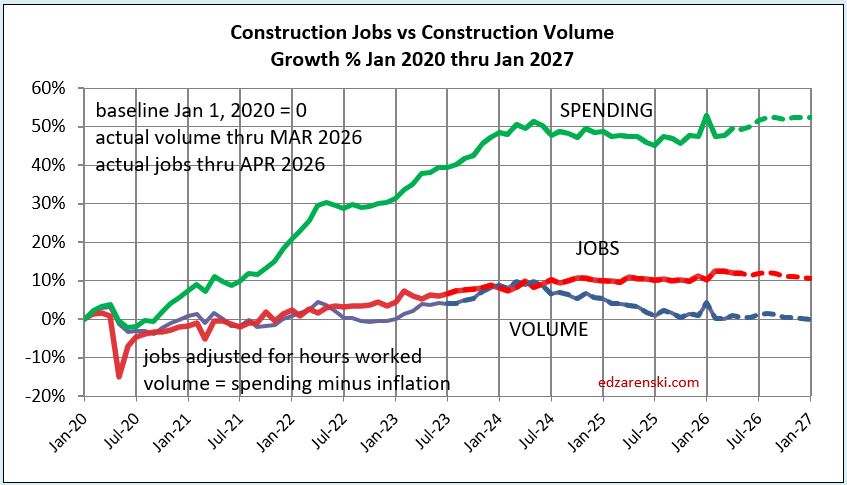
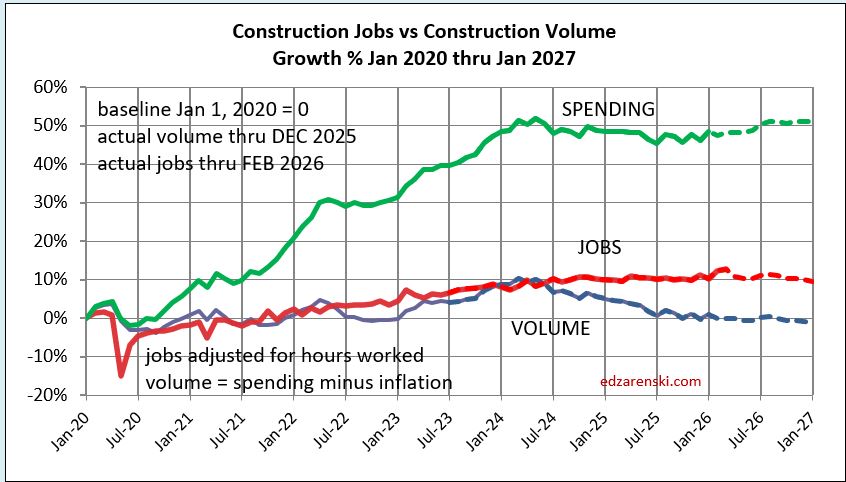
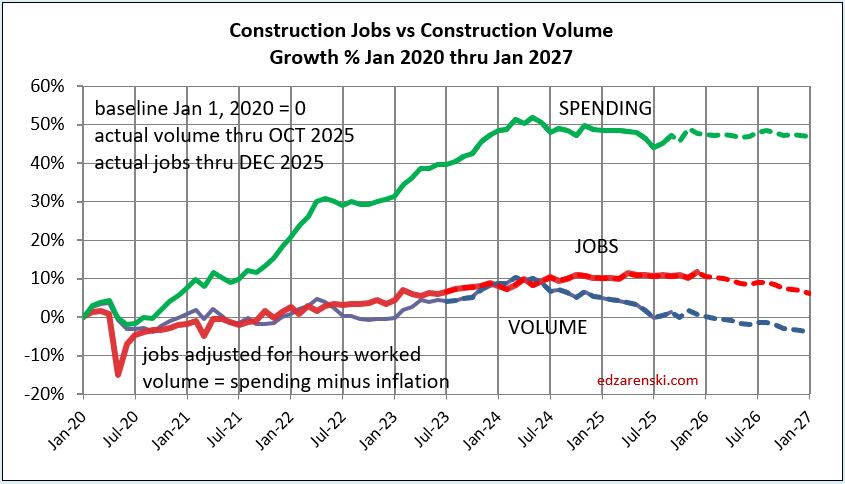
Construction Spending for Jan, Feb and Mar is up 0.3% year-to-date (YTD) from 2025. After adjusting for inflation Constant$ volume is down 1% for the 1st 3 months 2026 vs 2025. Jobs thru April are up 1.5% YTD from 2025.
Although there may be a couple months in 2026 when construction jobs do increase, we should not expect overall construction jobs growth in 2026. We are in the 2nd yr of a constant$ volume decline. If jobs do increase, (jobs up-volume down) we are experiencing a productivity decline.
This plot shows the last time jobs and volume were in sync was Q2-2024.
Construction Analytics Outlook 2026
First pass at forecast 2026, includes first Census report of final 2025 spending. 2025 will be revised several times in the coming months, Dec and Nov are still subject to revision. All of this is behind what would be normal schedule due to shutdowns. Then all of 2025 will be revised, often a more significant revision, with the release of May data on July 1. However, this represents my initial Outlook for 2026 spending. More to soon follow on jobs and inflation.
SPENDING
Tracking spending throughout the year:
There are several months during the year when spending is remarkably consistent. For instance, over a period of 25 years, June and July have averaged 9.1% and 9.2% of actual annual spending, with a high/low range variation of less than +/- 0.25%. August and September have the highest rates of annual spending, but with slightly higher rates of variation. January and February have the lowest share of annual spending with the highest rates of variation. May, June, July and August have the lowest rates of variation from average across 25 years. Using subsets of months with the lowest variation in annual spending is a way to check forecasts during the year.
If we add up the total NSA (Not Seasonally Adjusted) Construction $ spent in AMJJAS (Apr thru Sep) and divide by the statistical average spending for those 6 months, 23 out of 25 times the result is within less than +/-0.75% of the final total annual spending. So once we have September data we have a subset that usually predicts the final spending outcome for the year within less than 1%. If we add up the total (NSA) Construction $ spent in MJJA (May thru Aug) and divide by the statistical average spending in those 4 months, 24 out of 25 times the result will be within less than +/-1.25% of total annual spending. Both of these subsets of data, for the last three years, predicted final annual spending within less than +/-0.5%.
My forecasts as of July and again as of August data in 2025 were both within less than 1% of the reported final annual spending through December data. My forecasts for Nonresidential Buildings, since June data, have been within +/-0.5% of final 2025 spending.
INFLATION
Notice in the table below, I carry inflation at about 4% in 2025 and similar in 2026. Actual inflation values are a composite of eight different sources, so the inflation carried in these reports will never be the highest or lowest. Predicted inflation reverts to historical averages with some influence of current conditions. Taking 4% out of all the spending numbers above gives the Constant$ results or actual volume of business conducted. For 2025 business volume declined 5.1%. For 2026 it’s expected to decline about 2.3%.
An increase in gasoline/diesel prices results in an increase on every single material item used in construction. If it’s not delivery charges, it’s heavy onsite machinery operation to install. Fuel surcharges are not uncommon in construction contracts. It could also be in fuel needed to manufacture products. The current world situation may/will have adverse effects on future construction inflation.
Constant $ adjusts all spending for inflation to represent dollars spent at the same point in time. Throughout these analyses, Constant $ are adjusted to midyear 2024. Constant $ is a measure of the change in business volume.
Inflation increases revenues but adds nothing to business volume. If your construction business revenue increased less than 5.1% in 2025, your total revenues did not even keep up with inflation. Your real business growth fell in 2025.
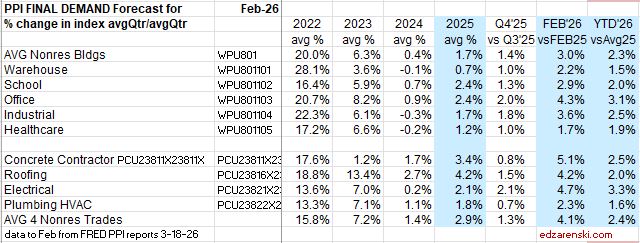
PPI
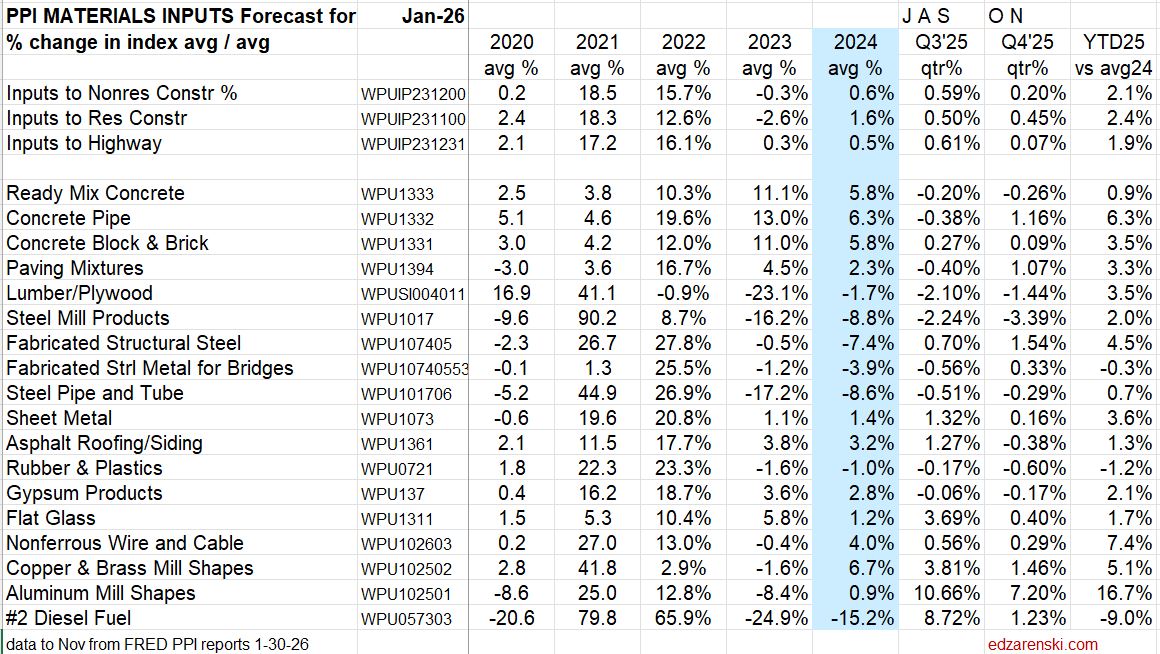
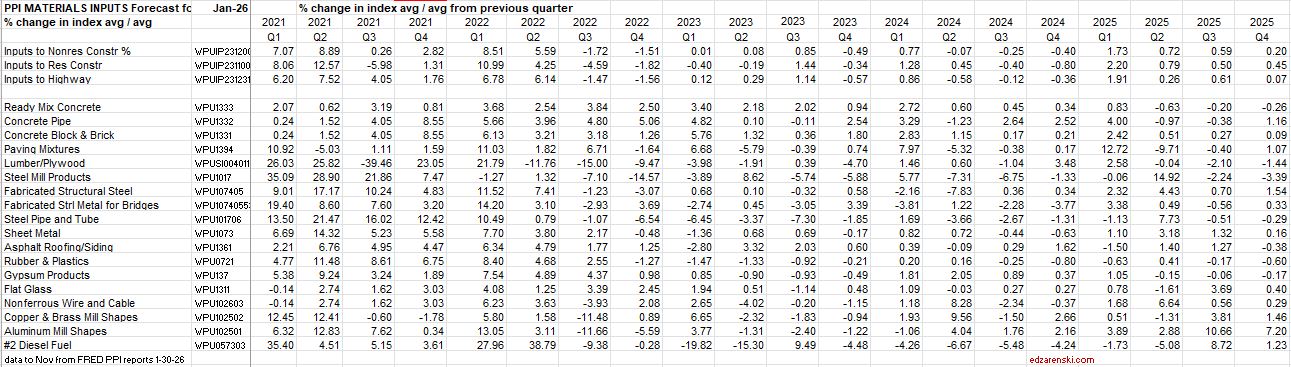
Data through February for individual Producer Price Index items. PPI items do not reflect imports, so tariffs would not be reflected in these numbers. Also current world oil situation would not yet be captured in values through February. I would expect to see numerous line items and total inputs increase in future months.
Cost of Inputs YTD thru Feb is showing the fastest rate of inflation recorded since 2022.
Construction PPI
largest gain in last month Deisel +20%, but still down -11% from average 2025
largest gains over last 6mo Aluminum +43%, Copper +21%, Steel +9%, Paving +9%
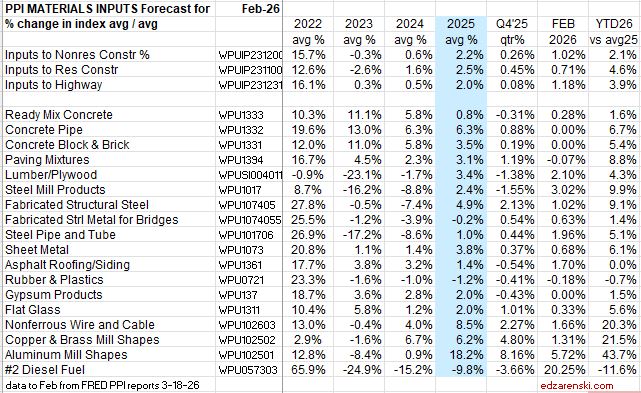
Almost all 2025 final cost inflation was added in Q4 2025, and in every case YTD’26 inflation has increased since Q4.
JOBS
Construction jobs from Dec24 to Dec25 fell by 4,000. But the better comparison, Avg’25 vs the Avg’24, increased by 58,000. However, spending was indicating a decline in jobs. Current $ spending in 2025 declined -1.4% or $30bil. After inflation, or Constant$ spending, declined -5.2%. That would indicate a decline of 400,000 jobs, but jobs seldom fall at the same rate as spending.
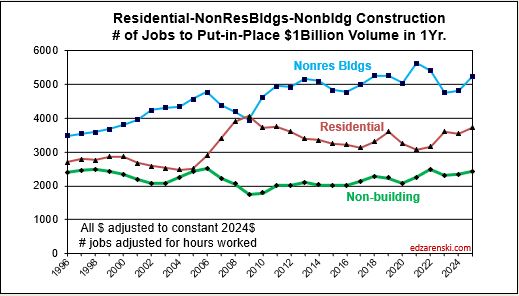
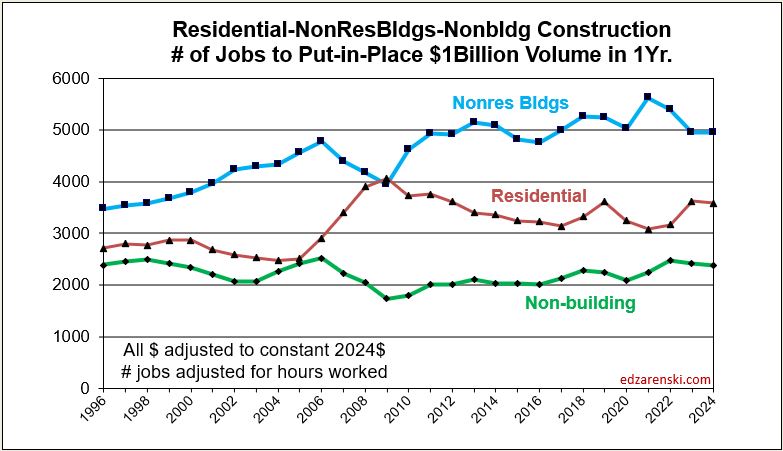
The inverse of $ put-in-place per job (the plot above) is # of jobs to put-in-place a given amount. The plot below does that for $1 billion worth of construction volume. For every billion$ of volume Nonres Bldgs, it takes about 5,000 jobs one year to put-in-place. For residential it’s only about 3,700 jobs. Both vary from year to year. For Nonbldg infrastructure jobs it takes only about 2,500 jobs to put-in-place $1billion in one year.
Although Current$ spending in 2026 is expected to increase slightly, Constant$ spending after inflation is projected to fall about 2.5%, indicating a decline of 200,000 jobs. Once again, don’t expect jobs to fall at the same rate as spending, so don’t expect a decline of 200,000 jobs, but I don’t expect even slow jobs growth like we see in 2025.
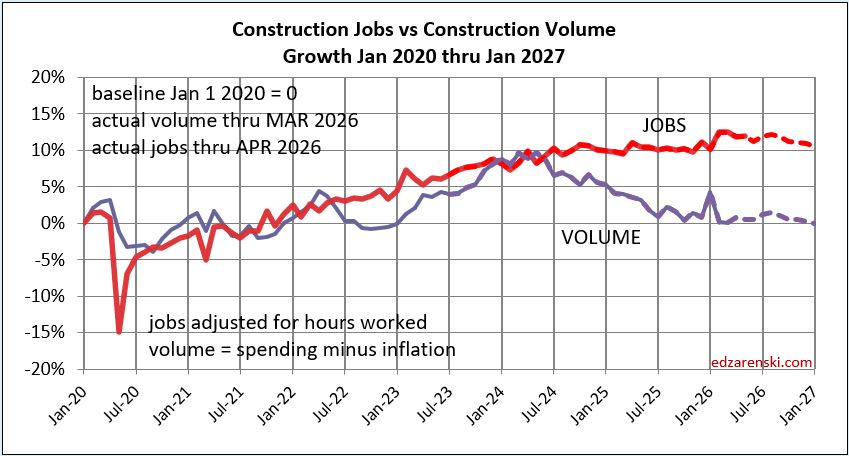
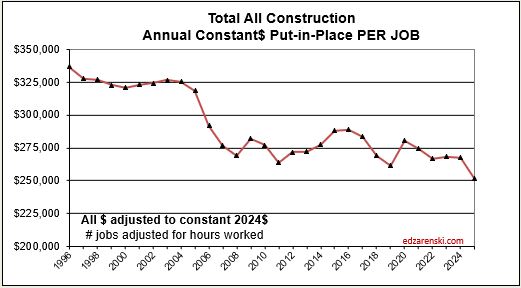
When Constant$ spending (volume) declines more than jobs, that indicates a decline in productivity. It’s safe to say that construction productivity is at its lowest point in over 30 years, and by the looks of the following plot, probably the lowest ever.
Construction Volume (spending minus inflation) has been decreasing since May 2024. Every increase in jobs since then results in a reduction in productivity. With current volume, construction could stand to lose 100k jobs to get back to May’24 productivity. That is NOT expected in the next 3yrs.
YTD through Feb. 2026, construction jobs are up 46,000 over Jan-Feb 2025. That’s kind of a hard to believe number, since construction Constant$ spending, or real construction volume, is forecast down 1.5% or $2.5bil (NSA not seasonally adjusted) over the same two month period. That would have us suspect a loss of 10,000 jobs. Even more astonishing is that workforce hours worked over the same 2 month period ’26 vs ’25 increased 2.5% or the equivalent of +200,000 jobs.
In 2022, 2023 and 2024, jobs increased in 35 out of 36 months. Construction volume fell in 14 out of those 36 months, but average volume increased all three years. We added 680,000. Total 3yr annual average volume increased 8%. In 2025 plus Jan-Feb 2026, construction jobs declined in 9 out of 14 months. Volume has fallen in 10 out those 14 months.
Jobs are down 0.6% since Dec 2024. Volume fell 5.1% in 2025 and is forecast to fall 2.3% in 2026. Currently there is no growth in volume to support jobs growth.
January 2026 posted the largest construction jobs increase (+48,000) in 4 years. There has been no consistent increase in volume to support jobs growth since the 1st half of 2024.
Unemployment and productivity includes only jobs counted in the official U.S. Census Bureau of Labor Statistics (BLS) jobs report. There is a large, unaccounted for shadow workforce in construction. By some accounts, 40% or more of the construction workforce in California and Texas are immigrant workers. Immigrants may comprise between 14% and 22% of the total construction workforce. It is not clear how many within that total may or may not be included in the U.S. Census BLS jobs report. However, the totals are significant enough that they would alter some of the results commonly reported.
MARKETS
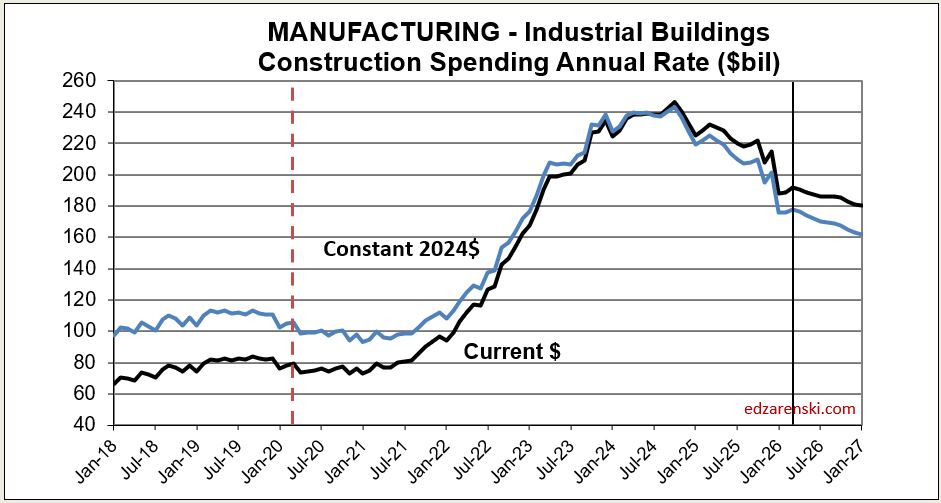
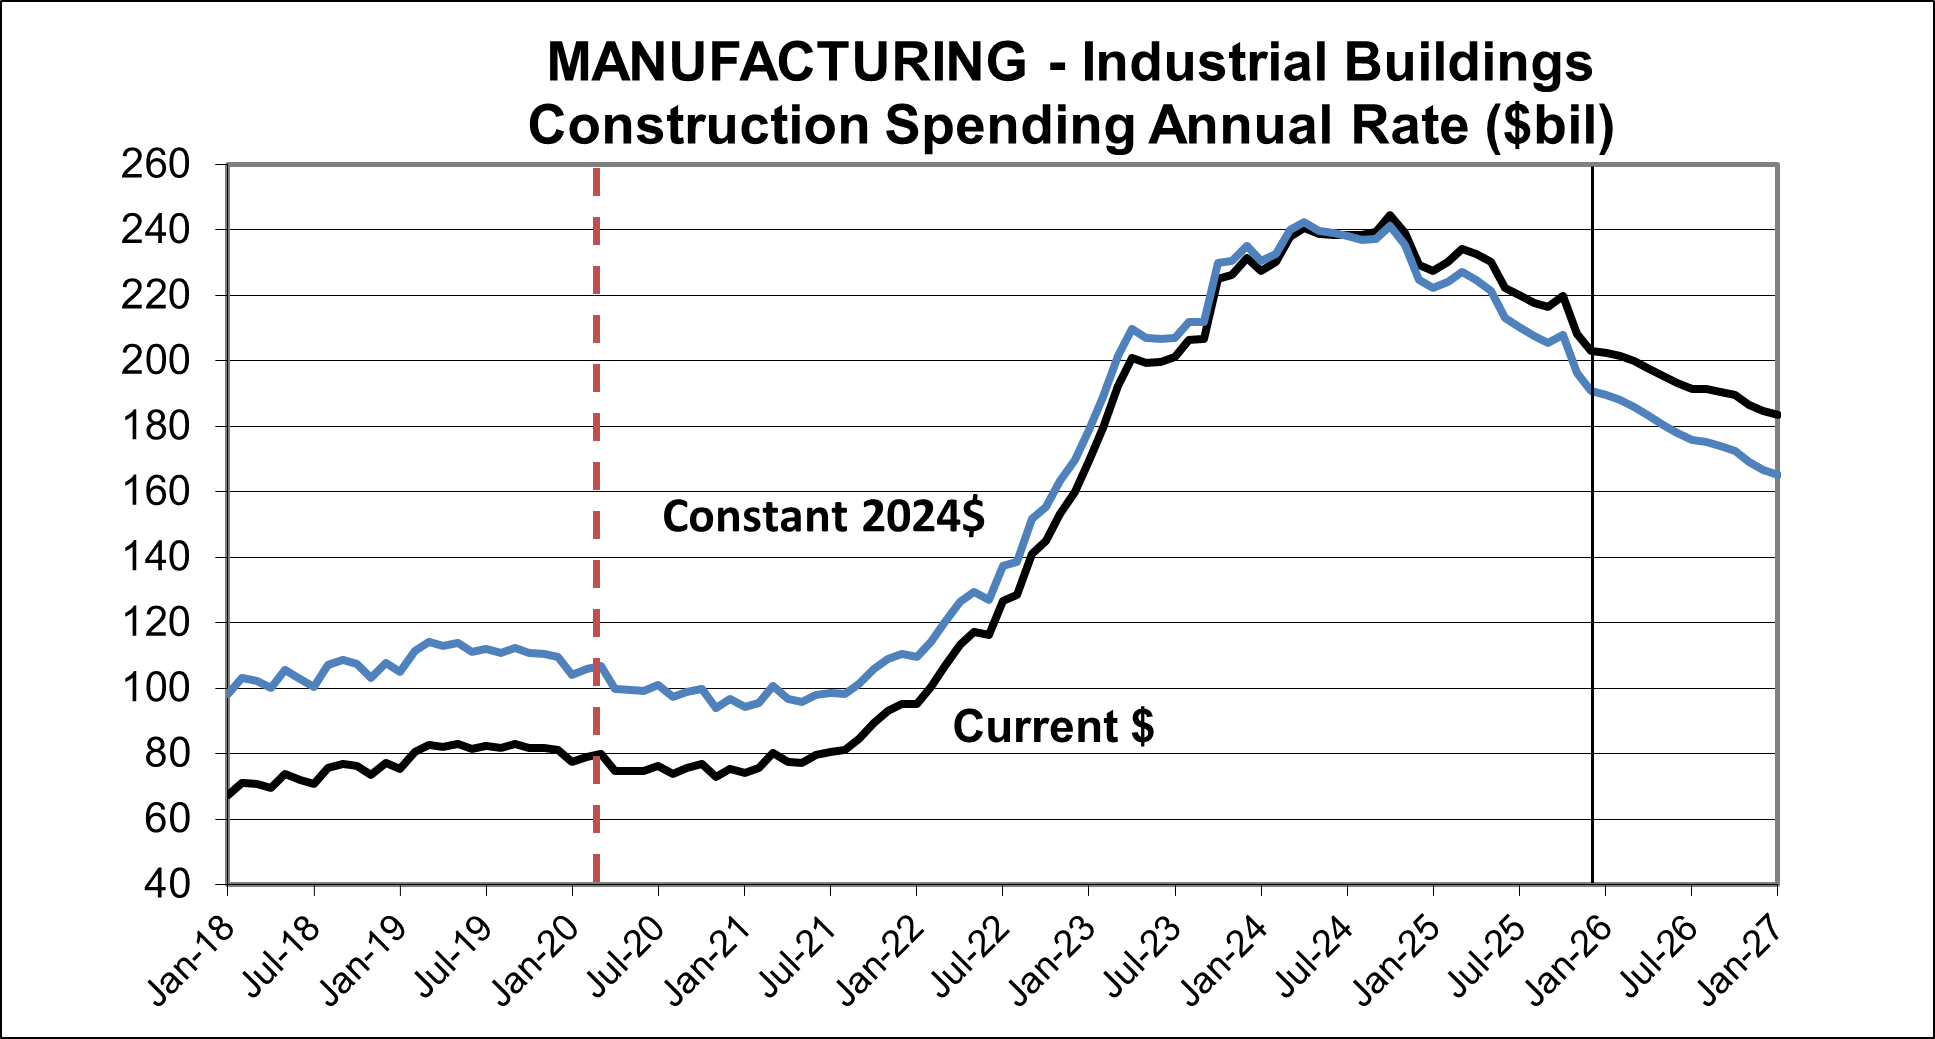
Manufacturing starts peaked in early 2023, now down 25%. Starts will fall another 10% in 2026. The spending decline in Manufacturing is expected and was predicted in 2024. With peak new starts in 2023, and peak spending from those starts expected at the midpoint of project activity, a year to perhaps 18 months later, it is not unexpected to see the falloff from peak spending. Spending was forecast to fall in 11 of 12 months in 2025. It fell in 9 months for a net decline of -6.5% for the year. It has increased only once since March 2025. Spending started the year 2026 already down -8% from the avg 2025. Spending is forecast to fall in 11 months in 2026 for a net decline of -12%. Spending continues to decline into 2027.
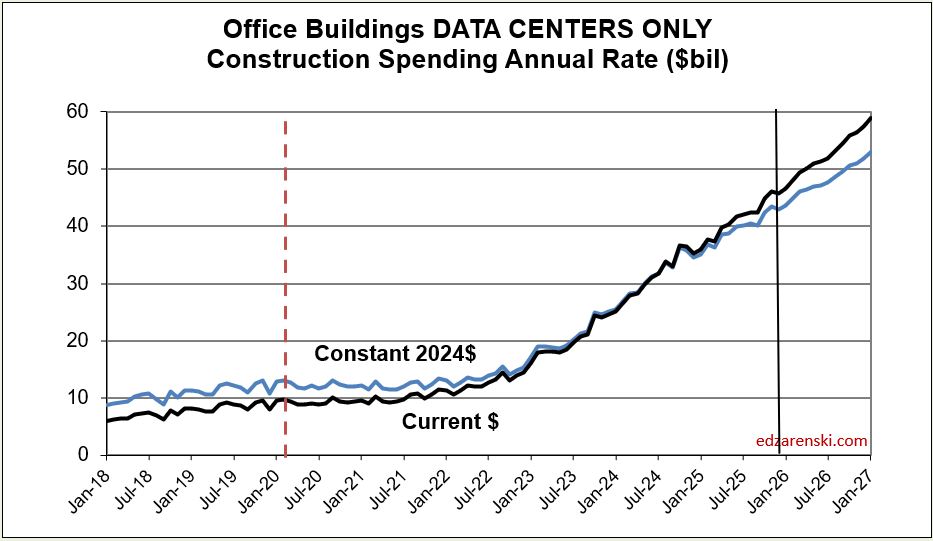
Data Center new starts have been increasing $10bil/year for the last three years contributing to rapid spending growth. Starts are expected to increase the next few years. But recent events may lead to cancelation or delay of some future projects. 25 data center projects were canceled in 2025 amidst surging local opposition — 4X as many as in 2024. Spending started 2026 already up 12% from the avg 2025. Growth is expected to hold around 20% to 25%/year the next two years.
Then we have articles like this: “The largest data center in the world is scheduled to be built in Ohio, total cost $40 billion.” Now, all of that cost must not be construction of the data center. Some must be computer equipment. But, just to put that in perspective, if $25 billion of that is building construction cost, it would take a daily average of 15000 workers 8 years to build a $25bil building cost data center complex. That’s 6% of the entire construction workforce in Ohio. And that is daily average for 8 years. Buildings start out slow and come to a peak of construction activity. That means the project could starts off with 1,000 workers onsite and could peak at 30,000. And it will require 1/3 of Ohio’s entire statewide power grid capacity. That one project represents about 5% of the entire national construction forecast for data centers over the next 8 years. When we look at how much labor it takes and how much is available, and how long it takes to build a building, this seems highly unlikely. This will most probably be phased construction over a long period.
Of course, the overall project schedule could be shortened by working 24/7, but not nearly by as much as you would think. Construction Overtime – A Common Miscalculation and Overtime Isn’t Always What It Seems – Lost Productivity Construction
( Personal opinion – Data Center growth will be restricted by difficulty to ramp up power generation and transmission. This in turn will slow construction spending growth in the data center market).
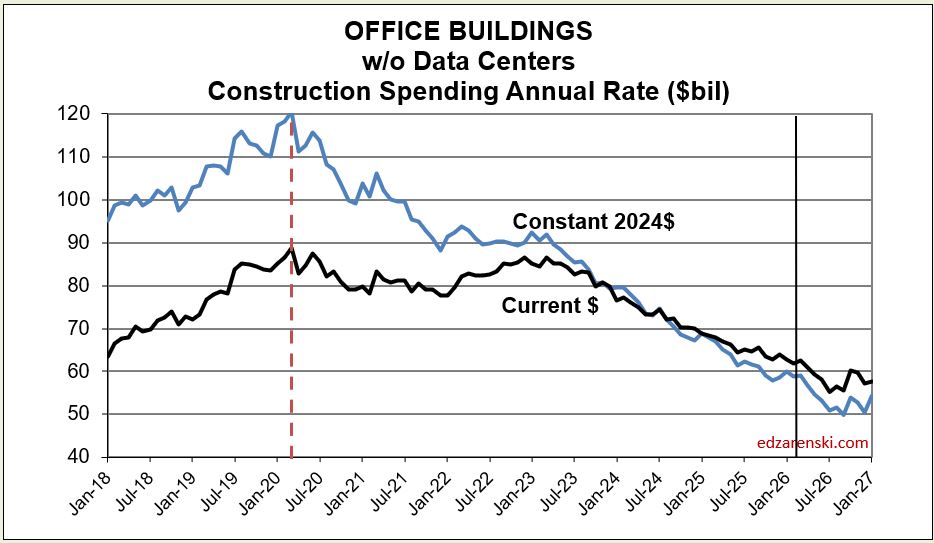
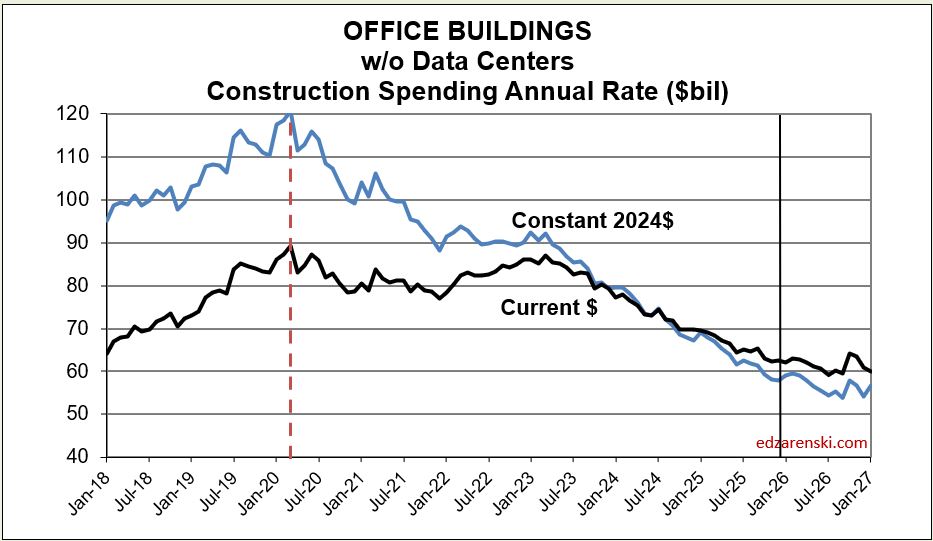
Without Data Centers, Office spending is doing poorly. Spending in Current$ peaked in early 2020 then again in early 2023. Spending is now down 30% from the 2023 peak and is predicted to decline 7% in 2026, then remain flat in 2027. Spending started 2026 already down 5% from the avg 2025.
Census reports construction spending for Offices SAAR at $109bil., but that includes Data Centers. Data Centers currently are 43% of the Office category. While Office is declining, DC are increasing since 2023 by $10bil/yr.
Data Centers construction spending is at an all-time high SAAR $46bil, climbing at a rate of 1 1/2% to 2%/mo.
Offices w/o DC are now at an SAAR of $62bil, down 30% from the 2020 peak, falling at 5%-10%/yr.
In constant$ (inflation adjusted) office w/o DC are down 50% from 2020 peak.
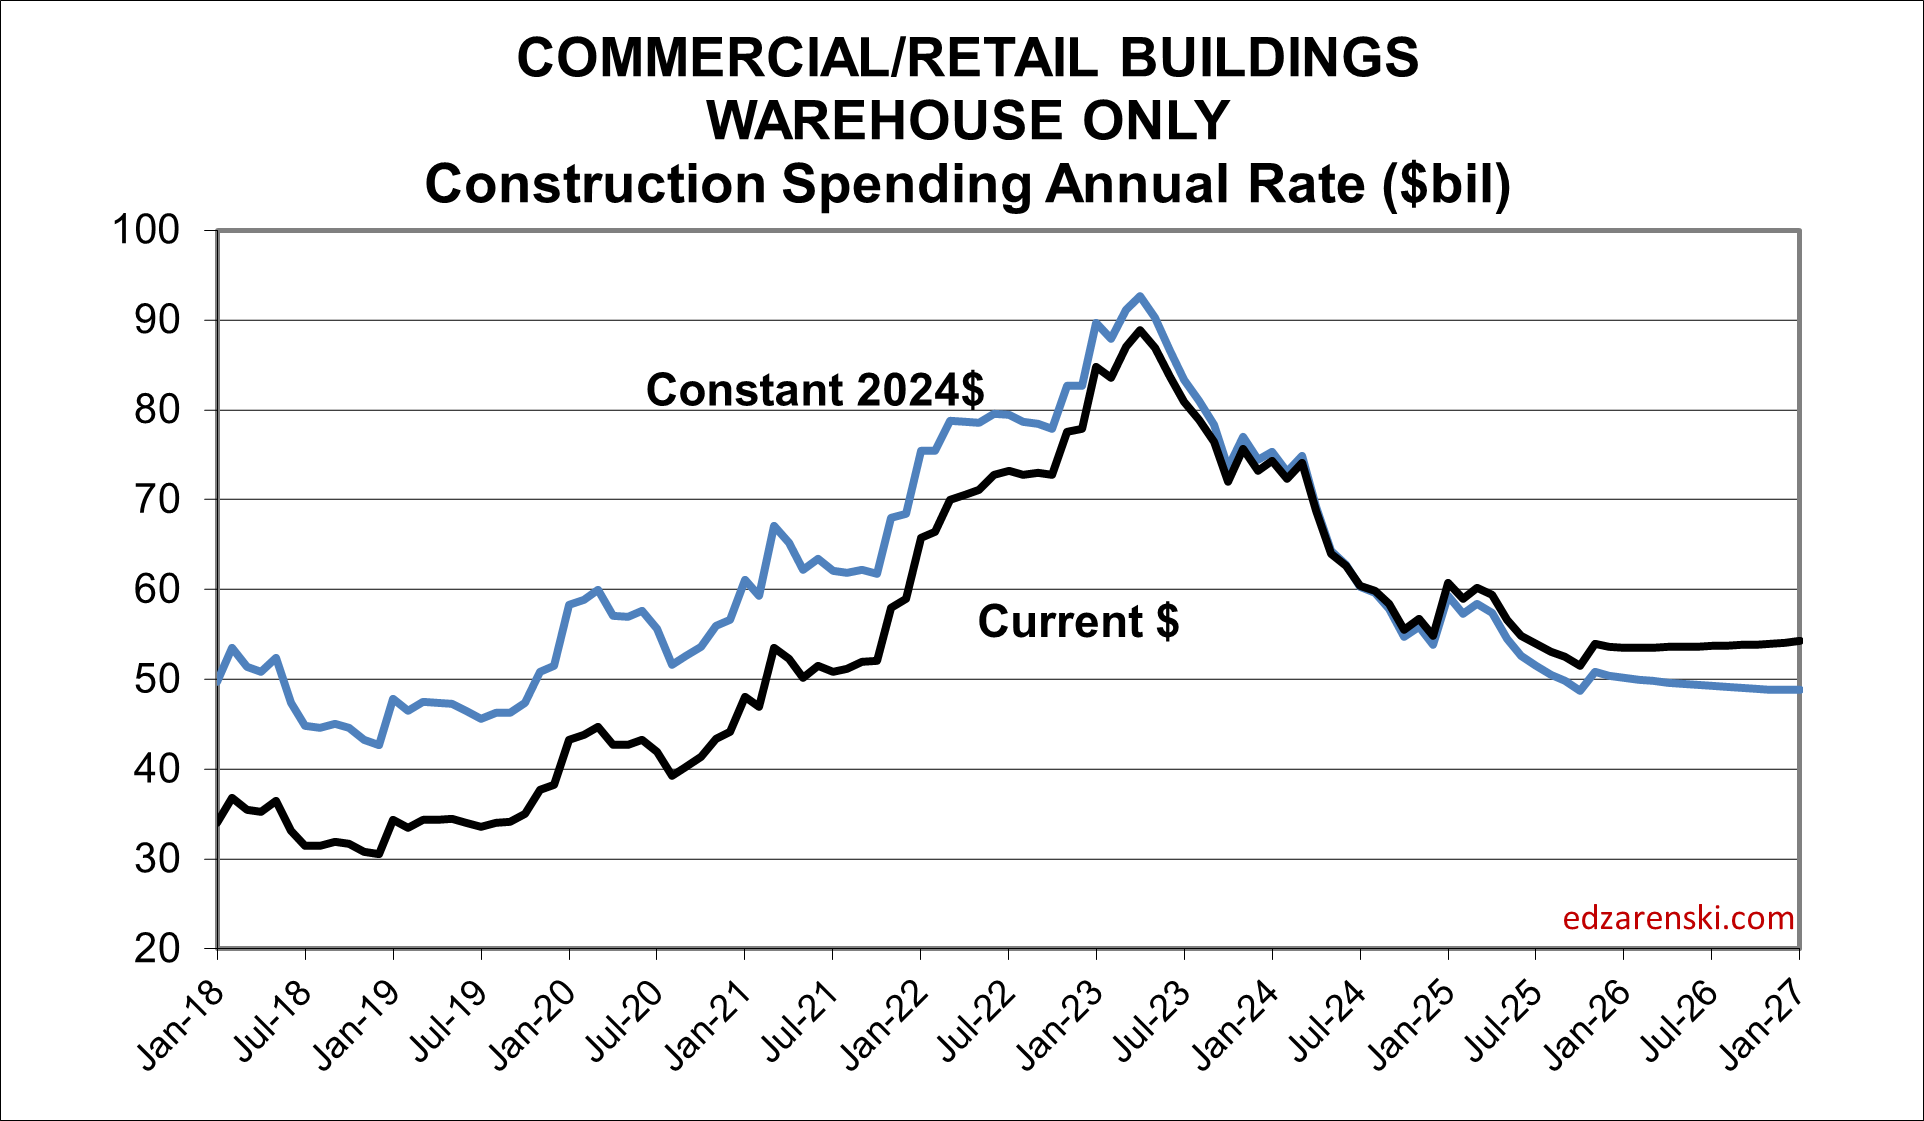
Warehouse starts peaked in 2022 and since have fallen 25%. Spending is down 35% from 2023 peak and may remain near this level through 2027.
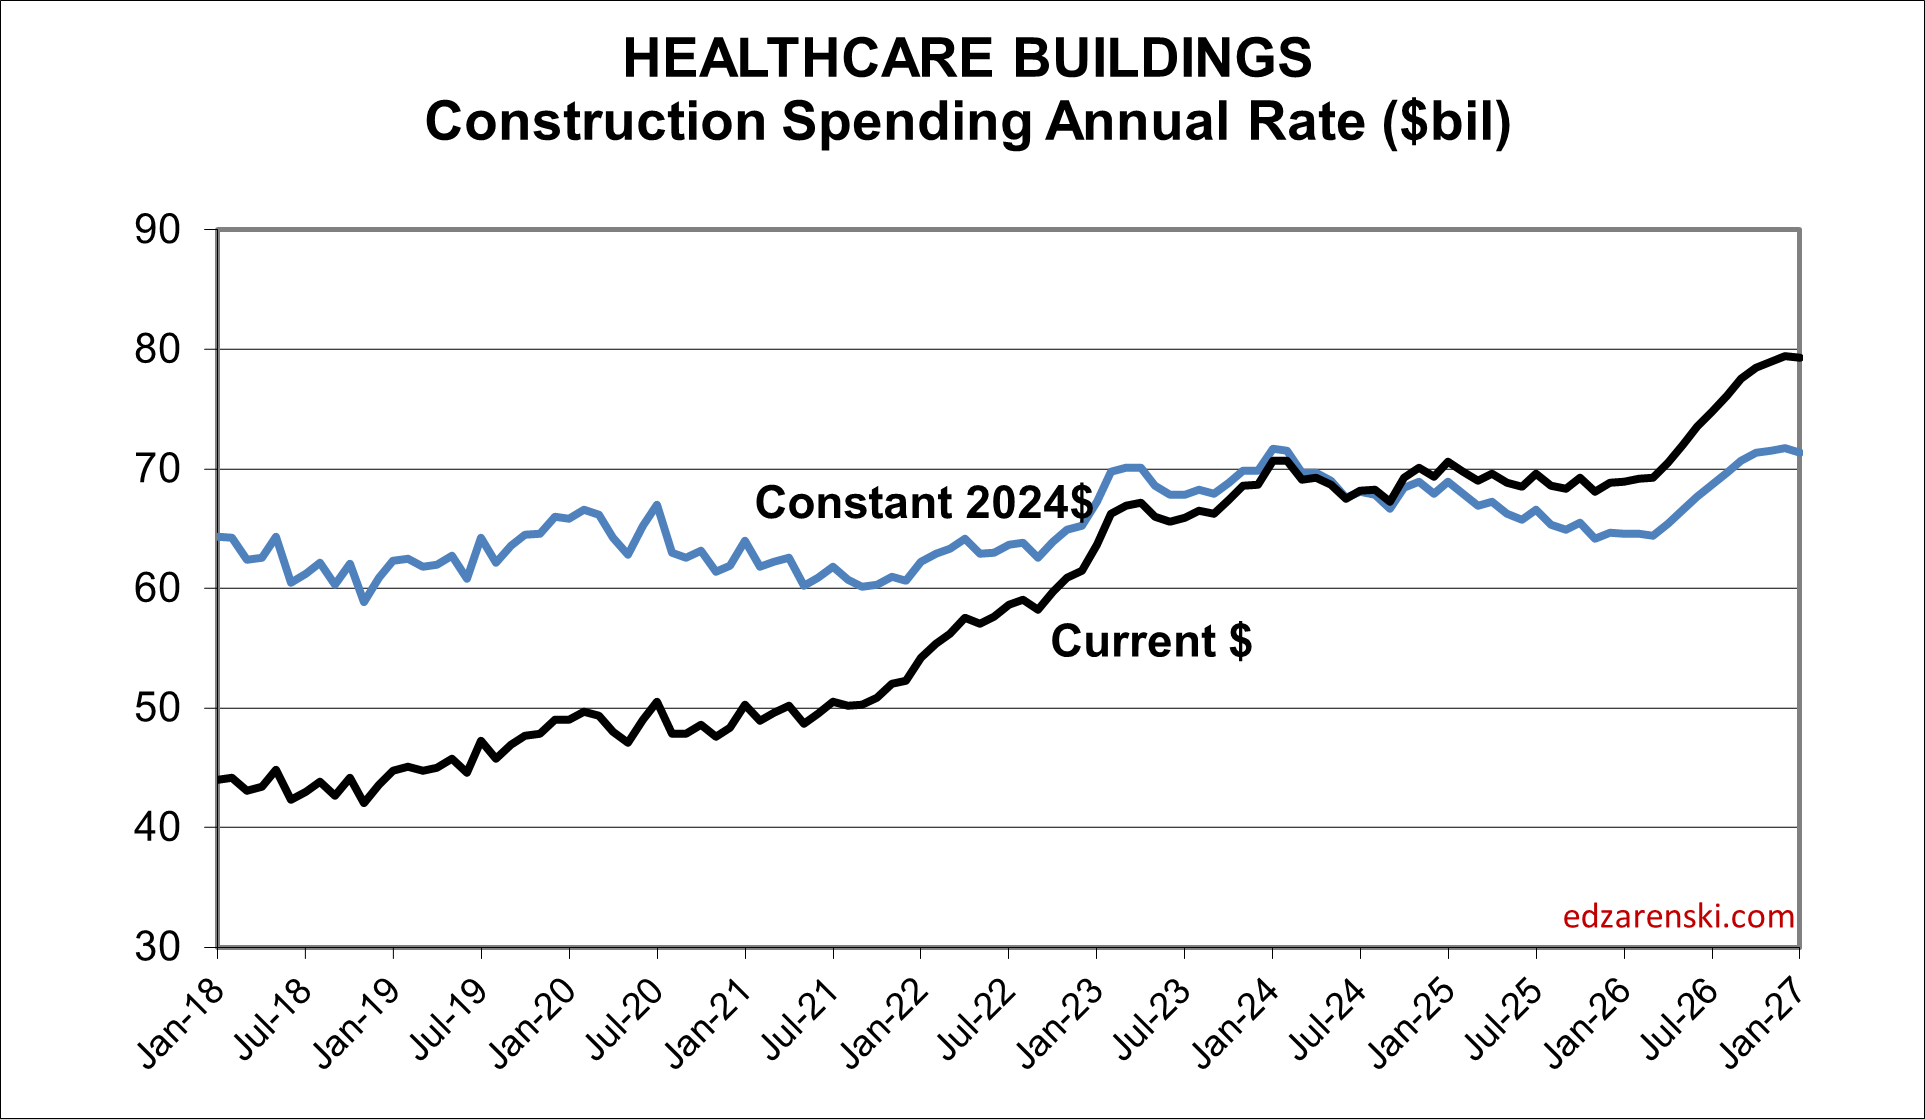
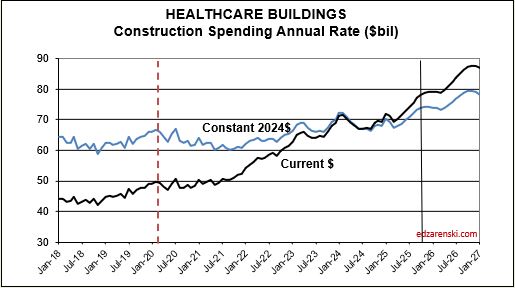
Healthcare spending is a bright light among the nonresidential markets. My forecast predicts a 7% increase in 2026 and a 12% increase in 2027.
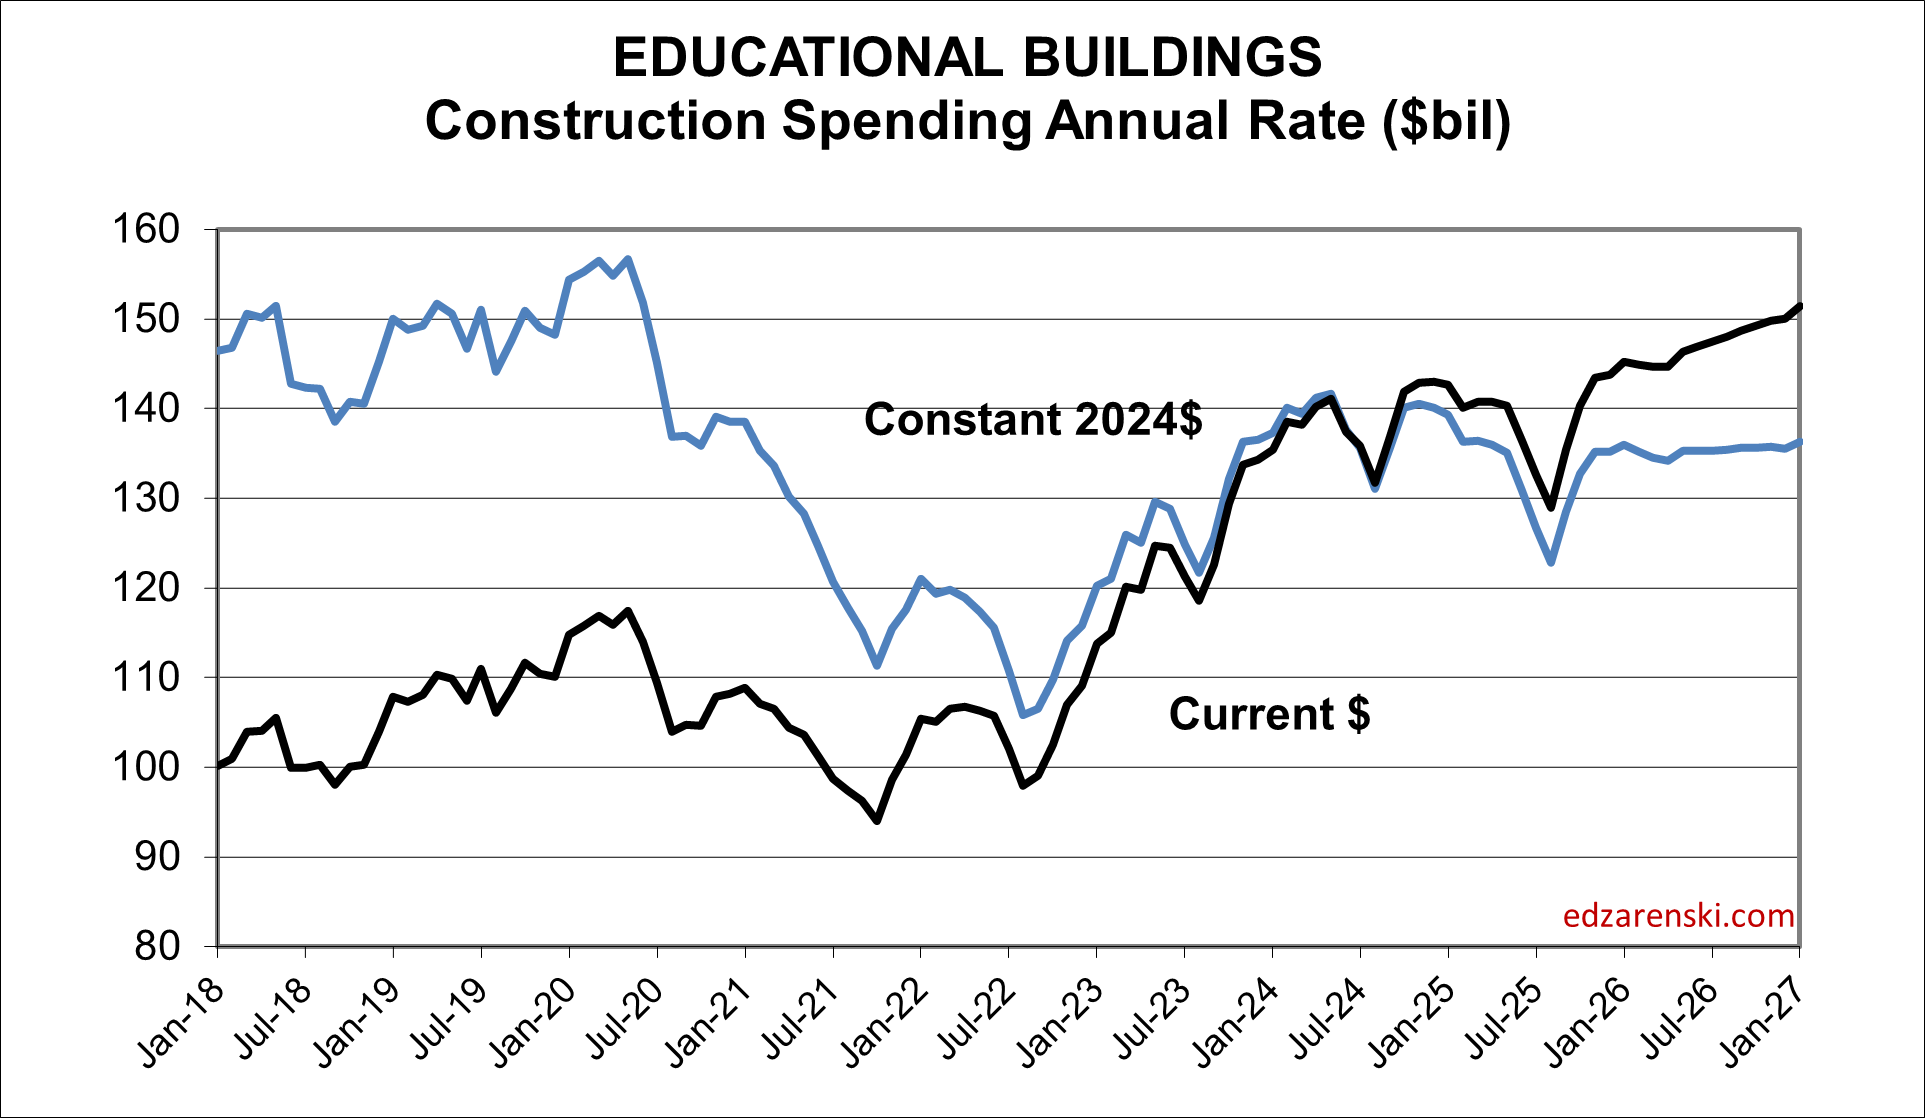
Educational spending advances in both 2026 and 2027, but not quite at the same rate as Healthcare, and certainly not near the rate of Data Centers. Spending started 2026 already up nearly 5% from the avg 2025. The trend in spending has been increasing since midyear 2025. Growth is expected to reach 6% in 2026 then slow to 3%-4%/year the next two years.
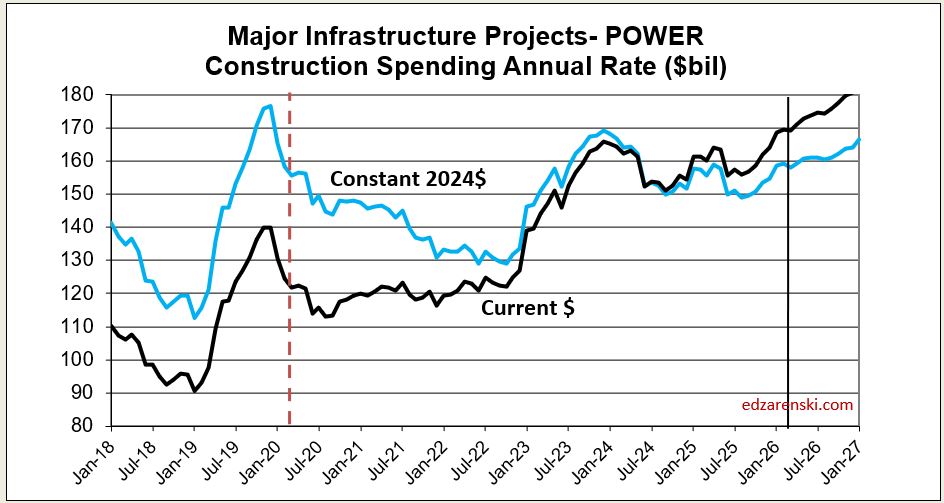
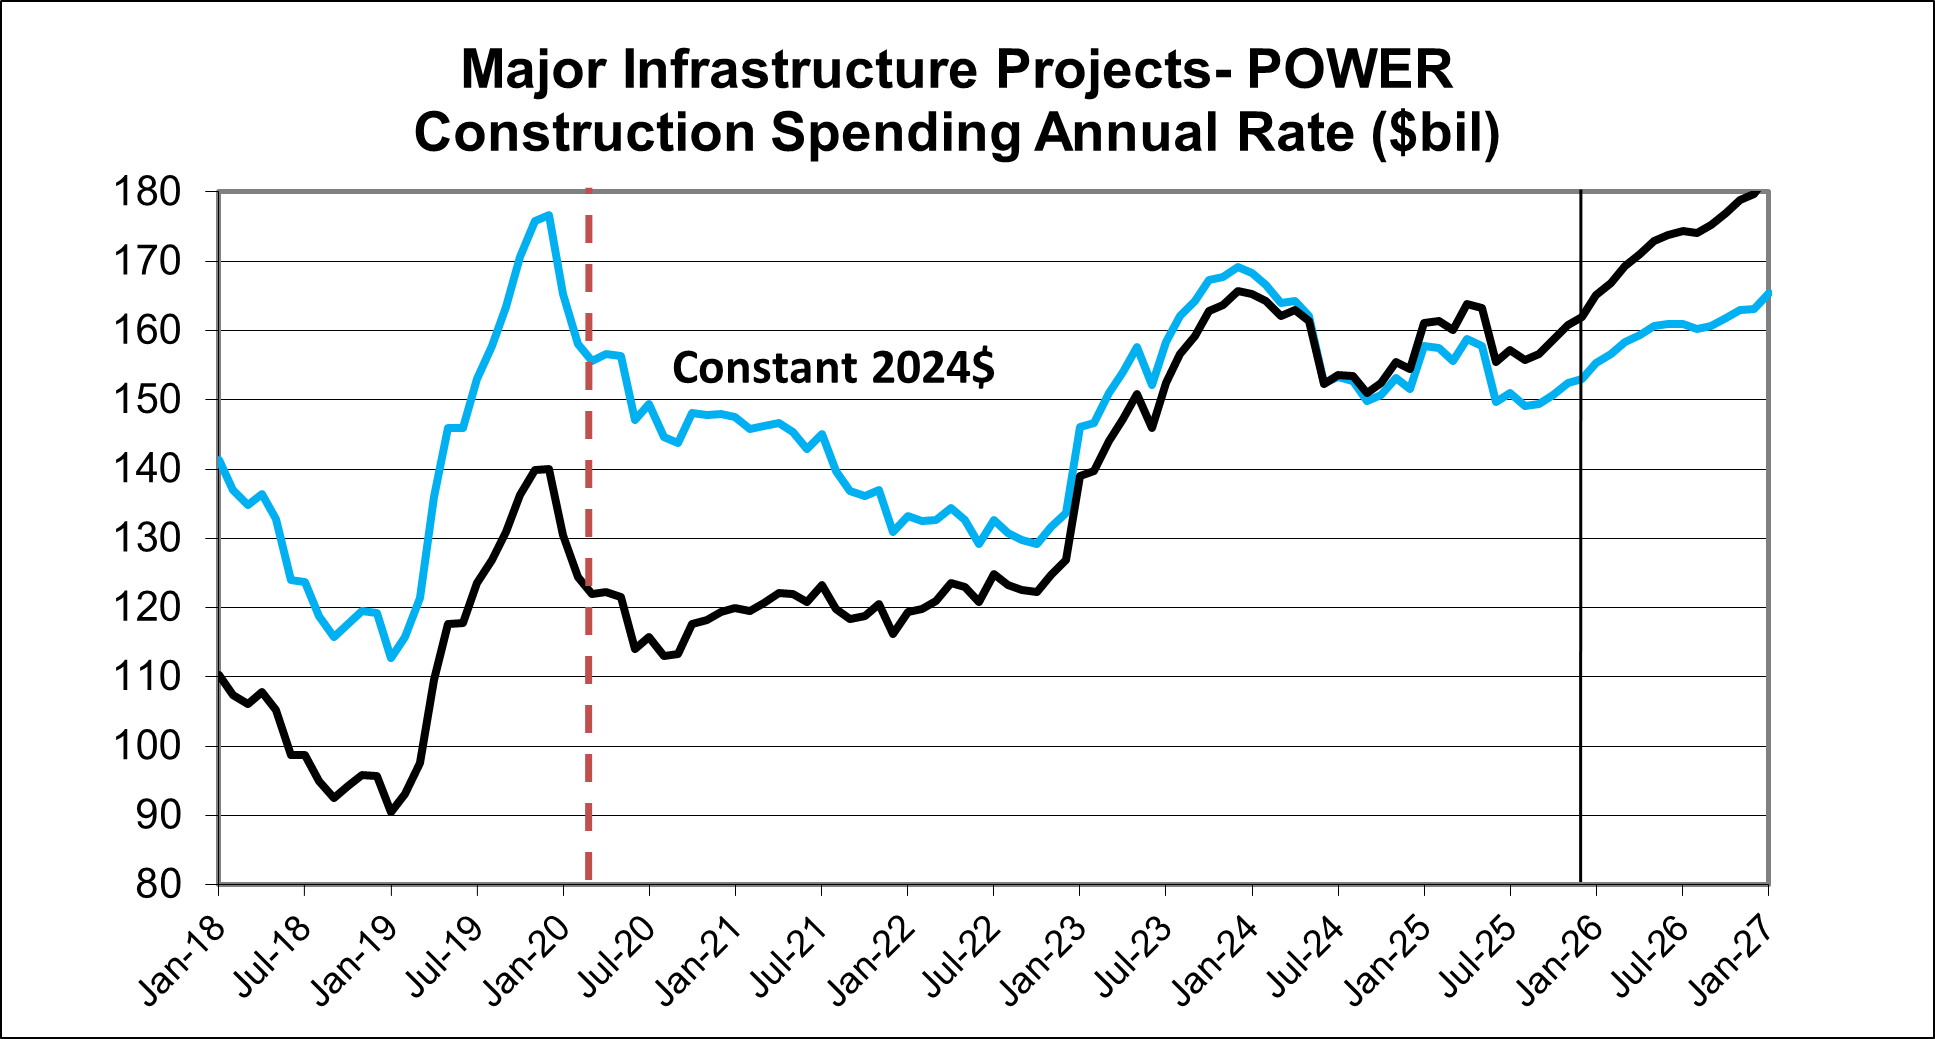
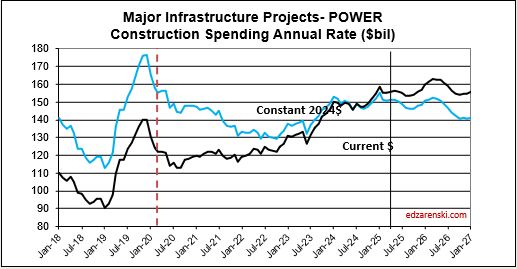
Power is difficult to forecast. Although I have spending increasing 8% in 2026, gains may be somewhat dependant on power supplies to new data centers. If data centers fail to advance as rapidly as expected, power spending may slow as well.
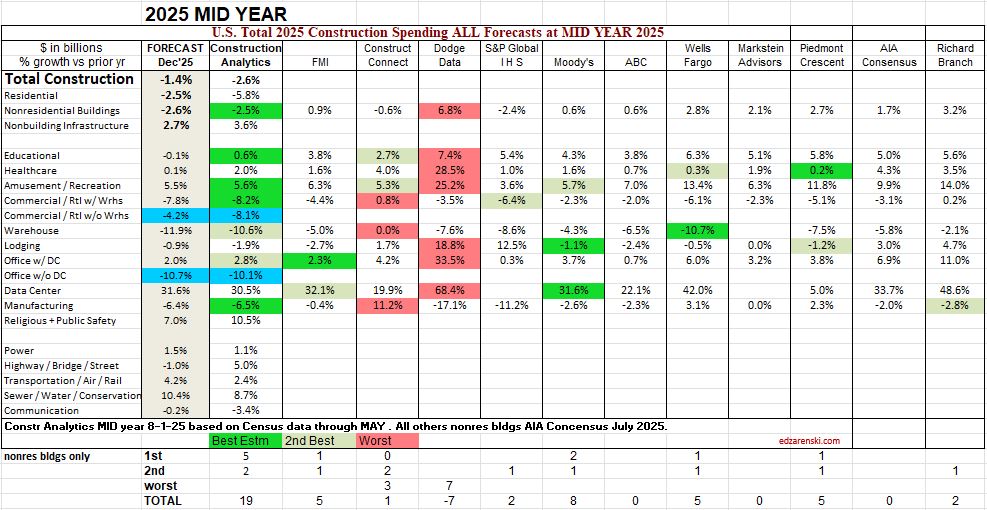
My Midyear’25 Forecast Compared to AIA Consensus
This is a simple list compiled of the percent growth forecast by each firm at Mid year 2025, then compared to the final outcome at year end. It’s a “How’d we do? comparison. The column titled Forecast’25 is the year-to-date spending through Dec. reported by Census 2-28-26, or in essence, the 1st look at final spending for 2025, the number all forecasters are trying to predict. There will still be minor revisions to this number.
To get an idea of how each firm’s forecast compares, I scored 3 points for closest forecast to actual, 2 points for 2nd closest and minus 1 point for worst forecast. Only Nonresidential Bldgs is counted here. We always see the forecasts published. We seldom, if ever, see the final outcome published.
You can search this website (search for the word Compared) for the outcome results for the last 6 years. Construction Analytics, by far, has proven to post the best forecasts. Not always, but more often than any others, particularly in the Midyear forecast where Construction Analytics, out of six years, has three of the best and two of the 2nd best forecasts.
AIA Consensus did not report Commercial/Retail w/o Warehouse, nor Office w/o Data Center. Construction Analytics did not report Comm/Rtl w/Warehouse nor Office w/Data Center, but those values were available in the file data and are shown here for comparison. The two items highlighted in blue are not used in the score.
Construction Briefs Jan 2026 Data Update 2-2-26
We are still not where we should be with actual data due to government data delays caused by the shutdown. Recent releases bring BLS jobs data up to Dec, PPI data through Nov and Construction Spending data through October. Here’s a collection of tables and plots reflecting some of that data through the end of January.
Construction Spending Value Put in Place
The November 2025 release, originally scheduled for January 2, 2026, and the December 2025 release, originally scheduled for February 2, 2026, for the Monthly Construction Spending report have been rescheduled for release on February 27, 2026.
There’s is an unusually large decline in residential construction spending in Sept data, almost entirely attributed to renovation work. A closer look at the data shows it may be that Aug and Oct reno data seem out-of-sync and those may be overstated. All 2025 data still open to Jul 1 revision.
25 data center projects were canceled in 2025 amidst surging local opposition — 4X as many as in 2024.
( Personal opinion – Data Center growth will be restricted by difficulty to ramp up power generation and transmission. This in turn will slow construction spending growth in this market).
Construction Jobs increased 1.1% in 2025. Spending (actual thru Oct) fell 1.5% in 2025. But inflation ate up 4% of spending. So real volume of construction activity fell 5.3%. Therefore, productivity fell 6.4%.
Also, if your construction business revenue increased less than 5.3% in 2025, your real business growth fell in 2025.
Jobs 2025 Nonres Bldgs +1.6%, Nonbldg +2.4%, Residential -0.6%

Construction Spending – Volume – Jobs
Construction Jobs avg 2025 increased only 88k from avg 2024. Slowest jobs growth since 2011 (ex 2020). Jobs 2025 up 1.1% over 2024. Jobs have been flat (or +/- slight) since Feb.
Residential jobs down 0.6%, but rsdn spending ytd thru Aug down 3.7% from Q4’24. After adjusting for inflation rsdn volume ytd is down 6%. Nonres Bldgs jobs up 1.6%. Nonres Bldgs volume down 3%. Nonbldg jobs up 2.4%. Nonbldg volume up 1.5%.
Environment for construction jobs looking difficult. Volume of work (spending minus inflation) available is declining all through 2026. Biggest declines by far, Manufacturing and SF Rsdn.
In the 10 months period Jan-Oct’25, construction volume declined by 4%. In the same period, construction jobs increased by 0.5%. And yet some economists are saying that job openings and hires indicate a labor shortage. Jobs should follow the amount of business volume.
Don’t expect construction to add jobs in 2026. While spending may be near flat, inflation data for 2026 has volume projected to fall 3.7%.
Construction Productivity
Construction spending constant $$ (volume) for 2025 is down 5.3% compared to start 2025 or same month 2024. I’m forecasting a decline of 3.7% in 2026. A 3.7% drop in volume could be a loss of 300,000 Jobs. Companies usually don’t cut # of jobs indicated by falling business volume. More jobs remain than volume. Productivity ($ pip per job) declines.
In 2026 real construction volume after inflation is expected down -3.7%. If we keep all current jobs, then volume put-in-place per job is lower, a decline in productivity of 3.7%. If we want to maintain the current level of productivity, we would need to lose 3.7% (300k) jobs. Unless the volume of work increases, I’d expect productivity to fall in 2026.
Volume of work is spending minus inflation. When jobs growth exceeds volume growth, productivity is declining. Volume has been declining for last 2 years and is expected to continue declining in 2026.
Inflation Index and Producer Price Index
If you track company revenues as business growth, without adjusting your business plan for inflation, you’re tracking register receipts, not business volume. Here’s a simple example to understand the difference in revenues (spending) vs volume. If a basket of apples 2yrs ago cost $25, but today the same basket cost $35, receipts increased 40%, but business volume has not changed.


Construction Briefs NOV 2025
After some delayed data released recently, we now have August Construction Spending and Sept Jobs.
In the past 12mo, Rsdn construction jobs fell 46k (-1.4%). Nonres Bldgs jobs increased 59k (+1.6%) and Nonbldg jobs increased 24k (+2.1%). Rsdn spending is down 5% (-$39bil) Nonres Bldgs is down 3.4% (-$25bil) Nonbldg is up 3.1% (+$15bil) Expect total spending in 2025 down 2.1%, jobs UP 1%
Construction Spending Forecast Total spending varies less than 1% from current through 2026 Jobs YTD up 16k. Only times job growth that slow was 2020 or recessions. 2011 through 2024, even with losses in 2020, avg jobs growth was 200k/yr. Don’t expect job openings (see JOLTS) in near future.
Environment for construction jobs looking difficult. Constant $ spending in 2026 is down just less than 1%. But Volume of work (spending minus inflation) available is down just over 4% and is declining all through 2026. Biggest declines by far, Manufacturing and SF Rsdn.

The decline in Manufacturing construction spending is due to having passed the peak in the scheduled project timelines for the large volume of mega-projects that started in 2021-22-23-24. (I wrote about it in more detail in Nov’24 in the article linked.) Peak spending is typically just past the midpoint of project construction. From Apr 2024 to Nov 2024, Mnfg spending averaged $240bil., the highest rate of spending on record. In 2025 it started the year at a rate of $$230bil but will end the year at $210bil. By the end of 2026 the rate of spending drops to $190bil.
The Manufacturing Spending Taper

My forecast has not changed much overall in the last few months. Residential has gained in revisions added to June and July and Aug posted a very strong 1.3% gain.


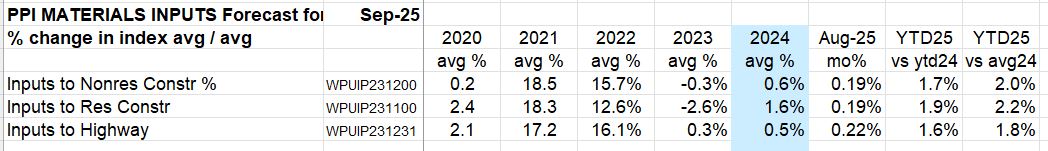
We will wait a little longer before we see any meaningful changes in construction materials input costs. September data (released 11-26-25) reported here. Also remember, PPI does not track imports, only domestic producers. Therefore, any implied increase in PPI being related to tariffs would be a domestic reaction to an import tariff. We can expect that.
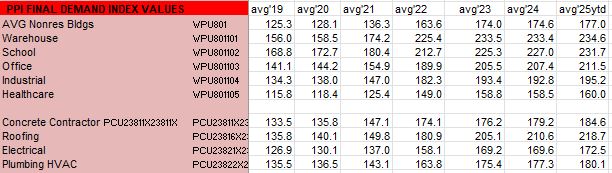
INPUTS thru Sept up ~2% from avg2024. Final Demand for Nonres Bldgs is up 1.2% ytd vs avg 2024. However, Oct is the revision month for Q3 Final Demand data, so Final Demand data not finalized for Q3.

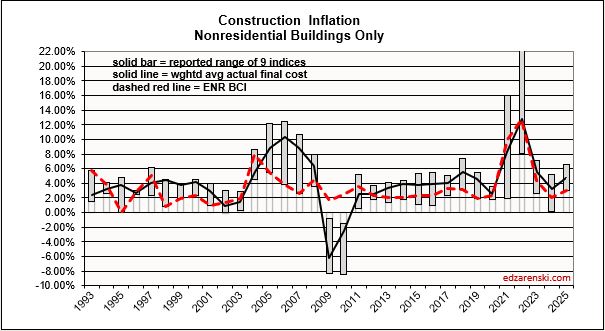
Construction Inflation 2025 Update Nov
Please refer to Construction Inflation & PPI 2025 updated 10-17-25 for extended discussion of inflation, how and when to apply, historical indices, PPI Data and Tables. Also see Construction Briefs Sept 2025 for August PPI data. No PPI data has been updated since Aug data issued in Sept.
We are still missing a lot of information. It was expected that much of the tariff costs would show up in Q3, or even Q4, so these costs are more likely to go up than down. But we can’t see those changes in cost. However, there are no shortage of reports of cost pressures. It’s much more than just tariffs.
Turner Nonres Bldgs Index is up 3.5% ytd for Q3, up 1.1%-1.2% each quarter.
Rider Levitt Bucknall Nonres Bldg Index for Q3 is up 3.3%, up 1.0%-1.1% each quarter.
Mortenson Nonres Bldgs Index is up 6.3% for 9 months.
Census New Single Family Home Index is up 3.9% YTD for 8 months thru Aug.
RS Means Nonres Bldgs Index is up 3.4% for 9 months, w/o margins.
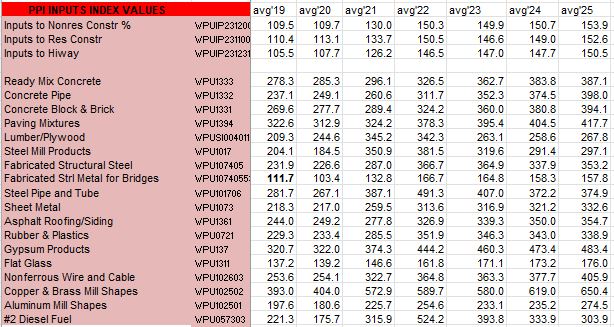
The Producer Price Index for construction materials shows these items up greater than 4% ytd as of Aug: Concrete pipe, Paving Mixtures, Lumber/Plywood, all copper and aluminum wire and shapes.
30-year average inflation rate for residential and nonresidential buildings is 4.1%. But when excluding deflation in recession years 2008-2010, for nonresidential buildings the long-term average is 4.7% and for residential it’s 4.9%.
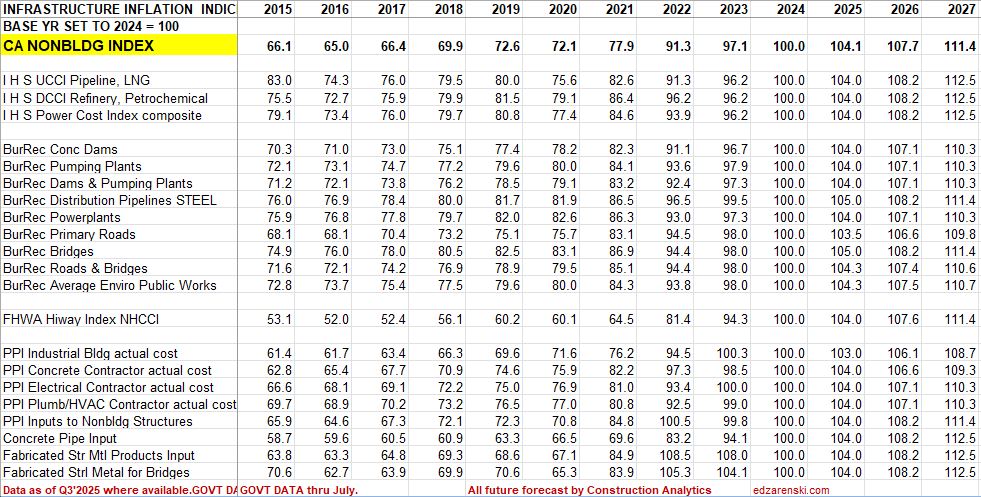
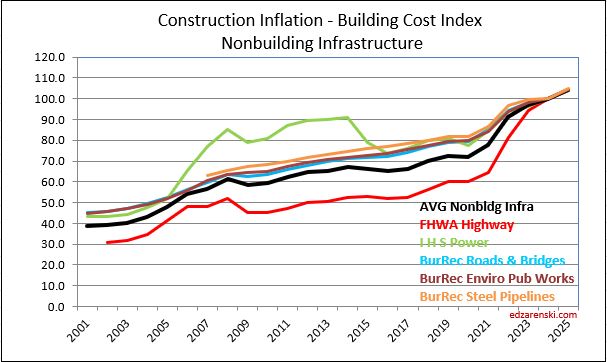
For Non-bldg Infrastructure the 30-year average is 3.6%. When excluding deflation in the recession years 2008-2010, Non-bldg long-term average inflation is 3.9%.
All of these long term averages went up in recent years because, instead of including 1991-1994 at 2%/yr, we are now including 2021-2024 at 7%-8%/yr. All long term and short term inflation rates went up.
Since 2011, Nonres Bldgs inflation is 4.8%, Residential is 5.4% and Non-bldg is 4.3%.
The forecast values carried in the following tables reflect trades and firms currently posted Q3 inflation trackers, using an assumption that rates tend to follow the current pattern and with no reasoning to assume a Q3/Q4 price decline.


Forecasting in a Shutdown
10-7-25 It sure doesn’t help forecasters when we can’t get fresh data. So how can we forecast when there is no current data forthcoming?
One of the data sets that my forecasting models are set to calculate is annual forecast on smaller sets of data within the year. For example: The Total Spending SAAR average for the months of AMJJAS (Apr thru Sept) when extended for a full 12 months, predicts the annual spending within +/- 1%. This calculation has been within this 1% limit 22 times in 24 years (think Drake Maye accuracy here). The other 2 years were off by 1.1% and 2.2% (in 2020). And unfortunately, we don’t have August or September data.
The last actual data we have is July. For Nonresidential Bldgs, the average predicted from AMJJ (Apr thru July) predicted the annual total Nonres Bldgs spending within 1.8% 13 out of the last 14 years (2011 to 2024), with one year being 2.6%. The average of those 14 years is less than 1% off from the actual.
This is not a simple average. Each month produces a different share of annual spending. For ex: Based on 20-year averages, January and February each produce only about 7% of annual Nonres Bldgs spending while June and July produce each about 9% of annual spending. When a small set of data is used, the spending in each of those months is compared to the 20-yr average for those months and projected out to get 100% or a full 12 months of spending.
The small data set of AMJJ, when used to predict 2025 Nonres Bldgs spending, forecasts +/- 0.9% or $730bil to $756bil. The average predicts spending on Nonres Bldgs will hit $743bil. My current forecast, which includes actual data thru July and forecast to year end, predicts spending will hit $749bil.
Residential spending, based on small data set is between $882bil and $920bil., with the average predicting $901bil. My current forecast with all actual data from Jan thru July and forecast thru year end is $892bil.
The best small data set predictor is having data for AMJJAS. This predicts total spending will come in between $2109bil and $2149bil, with the average for the year at $2133bil. My current forecast predicts spending for 2025 will total $2140bil.
Generally, I look at these small data set calculations to insure I haven’t made some kind of blunder in my forecast. In this case, the small data set gives some comfort level that the annual forecast, although based on only 7 months of actual data, may not be very far off from what to expect at year end.
Construction Briefs June 2025
Construction Spending Explained
- New Starts + Existing Backlog generate Spending
- Spending = Revenue
- Revenue includes inflation which adds nothing to volume
- Revenue – Inflation = Business Volume
Construction spending fell slightly in April, down 0.4% from March. Spending has fallen slightly each of the last 3 months, but total spending is still at/near an all-time high with the seasonal rate at $2,200 billion. The forecast predicts spending will increase to 3% growth by year end.
Construction Forecast Update – Data Centers shows the largest % growth for 2025, forecast +33%. Manufacturing is still the largest $ contributor ($223bil/yr) to nonresidential bldgs total spending ($772bil/yr), but has fallen 6% in the last 5 months.
Peak manufacturing construction spending was posted from Sep thru Dec 2024. The avg of 1st 4mo of 2025 is down 4% from that peak. By Q4’25, avg spending will be down 10% from peak.
BTW, this is totally normal. We are beginning the tail end of an above normal huge influx of new manufacturing projects that started over the last 3 years, and the spending curve is beginning the downhill slope. Spending will continue to fall for the next 3yrs.
Data Center construction spending has not yet hit peak. Data Centers are continuing on a phenomenal streak of +45% growth in 2023 and +56% in 2024 and now 33% in 2025. The avg of 1st 4mo of 2025 is up 39% from same 4mo 2024. Spending will finish the year almost 20% higher than today. 2025 forecast +33% over 2024. Currently projecting peak spending end of 2027, or later.
Headwinds could slow new starts growth. Many economists predict current trade impacts will slow overall economic growth. That in turn could slow capital expenditures, which, in this case, is new construction starts.
Any capex pause could reduce all Data Center numbers. However, starts are up 400% since 2020 and could finish 2025 up 500%. Would take a lot of canceling or delaying to collapse these numbers. (This is going to first appear in construction starts, “firms pausing or delaying capex.” It’s already started with Data Center).
What’s propping up construction spending growth? Here’s the top growth markets.
- Market——1yr/%/$ growth ——3yr growth
- Educational 1yr/+8%/+$10bil +3yr/+30%/+$30bil
- Data Centers +56%/+$10bil +286%/+$18bil
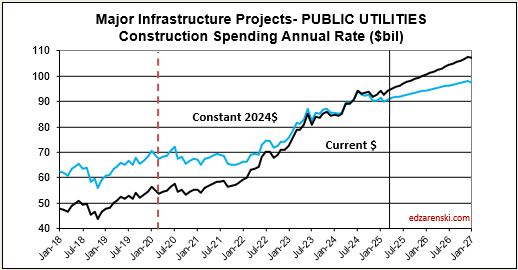
- Public Utilities +11%/+$9bil +58%/+$38bil
- Power +10%/+$14bil +24%/+$29bil
- Highway +4%/+$6bil +40%/+$40bil
Data Centers far and away takes the prize for highest % growth, but Data Centers is only 1.7% of all construction spending. Power is 7%, Highway is 6.6%, Educ is 6.3%, Pub Util is 4.4%
Manufacturing is notably absent from the above list, because after 3 outstanding years, Mnfg is no longer contributing growth. Mnfg spending is beginning to taper off. Mnfg is 9.3% of construction spending. The only market over the last year, or 2 or 3 years, with more $ spending than Manufacturing is Residential.
Mnfg 1yr/+20%/+$39bil 3yr/+284%/+$150bil
Mnfg 2025 forecast -10%/-$24bil


What’s holding spending growth back?


6-17-25 When May construction starts are reported later this month, I’m expecting an overall decline and a lower forecast. There are already reports of pauses in manufacturing facilities and data centers. Hiway and Public Utilities are probably immune from cuts but Power may see some reductions. Education and Healthcare are questions. Residential construction expected down slightly. Housing permits continued a downhill trend in April for the fourth month in a row. KB and Lennar report market pricing is down slightly. # of homes on the market is increasing.
This next plot shows the number of workers required to put-in-place $1 billion of construction in 1 year. Except for Nonbldg Infra, which has remained relatively flat over time, it requires more jobs to put-in-place $1bil today than it did 10 years or 20 years ago. Total construction workforce (8,300,000) divided by # of billions$ put-in-place (2,200 billions$/yr) is the simplest way to show the decline in construction productivity. Results here broken out for major sectors.
Construction Jobs Total hours worked peaked in March, now down 0.4%. For May, jobs increased by 4,000 (<0.1%), but unemployment dropped from 5.6% to 3.5% (175,000). That would mean that 171,000 workers dropped out of the workforce.

Steel Tariffs 50%
50% of nonres bldgs are structural steel. Str Stl is 10% of total bldg final cost. Nonres bldgs construction spending = $770bil/yr., $385bil on SS nonres bldgs., $38.5bil on str stl
Struct Steel material is only 25% of steel total contract cost, so 38.5 x 25% = only $9.6 bil is mtrl used in SS nonres bldgs. So at 50% tariff = $4.8bil added cost to nonres bldgs total spending. (This assumes ALL steel increases in cost).
Above is structural steel only. When including all other steel used in a building, (rebar, studs, frames, etc), steel is 15% of total bldg cost. So added cost would be $7.7bil.
And that is just nonres bldgs. MF Rsdn uses a little steel, but Nonbldg markets, Power, Highway, Transport, Pub Util adds about another $5bil.
So, steel tariffs, IF ALL STEEL WERE TO INCREASE, adds inflation to total Nonres Bldgs and Nonbldg. Half of all Nonres Bldgs use structural steel, so inflation to SS bldgs is 4.8/385, or 1.25% on structural steel bldgs. If looking at the macro view, inflation over the nonres bldg sector, then the $4.8bil increase would be divided by the total nonres spending, or 4.8/770 = 0.625%. All other bldg steel, applied to all nonres bldgs, added another 2.9/770 = 0.4%
Nonbldg Infrastructure markets, if it is a SS building, add the same 1.25% + 0.4%. But Public Works and especially Bridge construction can add significantly more. If domestic producers also raise pricing to follow suit with tariffs, as expected, this is what happens to total Nonres inflation.
US imports 30% of steel it uses. 40% of all steel is used in construction. If 30% is balanced across all types of steel, then 30% of constr steel is imported. (It would take some concentrated effort to determine % imports for each of the individual steel uses.) IF ONLY IMPORTED STEEL WERE TO INCREASE and no domestic manufacturers raise prices, 30% of building steel increases in cost. That is not likely at all. But if so, tariffs would add only 0.4% to nonres bldgs and about 0.1% for all other steel.
Construction Forecast Update May 2025
The total construction spending forecast, now at $2,237bil, +3.7% vs. 2024, has been lowered a bit since the Outlook in Feb. ($2,272bil, +5.5%). Most of the reduction is in Residential, from $997bil, +7.2% down to $958bil, +3.0%. Nonres Bldgs was reduced by $11bil and Nonbldg increased by $7bil. Compared to the average for the year 2024, current total spending YTD is up 2.6%, but is expected to pick a little up throughout the year across all sectors.

Constant $ growth is forecast down 0.7% in 2025 and down more after that. Inflation Index shows annual percent and index to base 2024 = 100. All years, current spending / index = reported as constant 2024$, as if all constant years are the same 2024$.

Residential Single Family spending has been in a range +/- 2.5% for the last 7 months. With only a few months lower than that, this range extends back 18 months. Take out 3%/yr inflation and you can see that SF volume has been flat to down. Multi-family spending, for the last 12 months, is down 15% off recent highs in Q1’24. Reno/repair spending extended recent highs across 5 months in mid 2024, before falling off 10% in Q4, and now, in Q1’25 it has gained back most of that drop. Any spending gains in the near future would be driven by multi-family.
Manufacturing is still the largest $ contributor ($222bil/yr) to nonresidential bldgs total spending ($772bil/yr), but has fallen 6% in the last 5 months. The trend is down in most months for 2025 and down in 2026. This decline is entirely expected and you can read about it in my article, The Manufacturing Taper.
Data Centers shows the largest % spending growth for 2025, forecast +39%, continuing on a phenomenal streak of +45% in 2023 and +56% in 2024. Data Center starts increased 300% over the previous 3 yrs. and still increase in 2025 and 2026, but at a slower rate of growth. Manufacturing spending peaked in Oct’24. Data Center spending continues to increase for the next few years. Both of these forecasts take into account some cancelations or delays announced recently (see May Briefs), however do not account for any major stoppages due to recent trade impacts.
The largest $ increases in spending are Power, forecast to increase +$16bil, and Highway +$13bil. Educational spending is forecast to post the largest nonres bldgs $ growth in 2025 (+$12bil, +9%). Data Centers increase $10bil.
This same scenario that looks to occur in Manufacturing will occur also in Highway/Bridge. Normal starts were about $100bil/yr, with slow growth. But for the last 3 years, actual starts totaled closer to $500bil for the 3 years or $167bil/yr. This strong growth in starts is expected to continue at least into 2025, totaling near $650bil for 4 years. Again, consider that part of that is inflation, but the remainder is government investment growth. So a decline from the taper back to normal for Highway/Bridge may not show up at least for the next few years. But once the taper begins it will have the same effect on Nonbldg Infrastructure spending that we will see from Mnfg in Nonres Bldgs.
Typical jobs growth is 2.5% to 3.5% per year, even though spending can sometimes far outpace that. But jobs growth doesn’t track spending, it tracks volume growth. Volume is spending minus inflation. For example, for the 4 years 2021 thru 2024, spending increased 44%. But inflation increased 33%. Volume growth was only 11%. Jobs increased 12.5%. For 2025, Inflation will outpace spending growth by 1%, but jobs are still expected to increase by 1.5%. Rarely do jobs decrease. That could change.
There are 870K construction jobs in TX. 500K are immigrants and 300K are undocumented.

New starts are forecast up in 2025, but I would caution there are a lot of headwinds that could slow new starts growth. Many economists predict the current trade impacts will slow overall economic growth. That in turn could slow capital expenditures, which, in this case, is new construction starts. So far year-to-date, spending is outpacing new starts growth. That means backlog is decreasing, mostly in nonresidential buildings. We haven’t seen a decrease in Nonres Bldgs backlog since pre-2011. Residential backlog is down slightly. Nonbuilding is increasing.
See Also Construction Briefs May 2025
and Construction Briefs Apr 2025
5-15-25 all ppi DATA UPDATED TO APR See Construction Inflation 2025
I’ve increased the inflation outlook since Feb to a range of 4.5% to 5%. Inflation may be the most uncertain of all factors affecting construction this year. We have yet to see any significant impact from tariffs, and there is sure to be impacts to many construction inputs. We may not know the total impact for several more months. But I would expect, if anything, inflation will go up from here, not down.
The bees are swarming the flowers outside. At least some lifeform is content and at peace with this world.
Construction Briefs Apr 2025
Tariff actions are not yet reflected in Feb PPI Inputs or PPI Final Demand index. Still early. Also remember, PPI does not include imports or tariffs on imports. When we do see movement in the PPI, it reflects domestic pricing decisions following on tariffs.
Lutnick: “Foreign goods may become a little more expensive, but domestic goods do not.” FALSE see next par.
PPI Excludes Imports/Tariffs. The 2018 steel tariffs of +25% applied on imported steel. However the 2018 PPI data shows that the cost of ALL DOMESTIC steel mill products (of all types) produced in the US increased 18% in 2018, after the steel tariffs were imposed.
If tariffs, for example, affect only 10% or 20% of products used in the industry, then the PPI shows us the domestic producers reaction to tariffs, which gets applied to the other 80% to 90% of product. For instance all steel is not imported, so not all steel will experience a tariff. The point here is that tariffs impact pricing decisions on all domestically produced products, not just the imported products. Consumers pay the price.
Impacts on Construction Inflation and Spending (guesstimates).
2021 inflation was 8%-14%. 2022 it was 12%-17%. Could 2025 repeat 2022? Yes. Will it? ??? I guess it hits 6%-10%.
I’m guessing some projects contributing to 2025 spending will be canceled/postponed. So maybe spending drops 5% from here, to zero growth. Construction spending annual growth is normally in the range 4% to 10%. 2025 and 2026 were both forecast at 5% to 7%. No doubt some projects will be canceled or mothballed. So the next 3 yrs spending gets reduced, and cost gets increased.
I’m beginning to think one of the first issues we have to deal with is supply shortages. All types of imported products are not going to be available, and there aren’t enough domestic products to replace them. This will add delays and cost to building projects.
Yeears ago, when I was a construction cost estimator, a major client would run numbers on a proposed new building project. If it couldn’t balance a ROI in 7 yrs, project would not move forward. As cost to build increases, it becomes harder to hit ROI. This supports that some projects may be canceled or postponed.
- Construction – What to Watch
- Cost to build going up
- Cost to finance is up
- Product availability in question
- Product delivery schedule delays
- Margins pressured
- Small/Midsize firms squeezed
- Labor let go/disappearing
- Projects in planning, delayed
- Project ROI not met
- Projects planned, canceled
Virginia has the largest concentration of Data Centers in the U.S. Virginia is projecting energy shortages due to the extreme demand DCs put on power grids. If you don’t build out the energy grid, the data centers put too great a demand on the current grid. “There are six states in the United States where data centres already consume over 10% of the electricity supply, with Virginia leading at 25%.” https://www.iea.org/reports/energy-and-ai/understanding-the-energy-ai-nexus
In the Q1 pre-tariff outlook, Data Center spending (SAAR), began the year 16% above the avg of 2024, is steadily climbing at 1.5% to 2%/mo., and sometimes more, is now up 22% vs avg 2024. By midyear the rate of spending will be up 28%. Data Center spending increased 45% in 2023 and 56% in 2024. Forecast for 2025 +37%. Obviously, this could get reduced if/when some projects get canceled.
The New Albany (Ohio) project, projected worth $1bil, is one of the two announced DC projects that have been halted https://www.nbc4i.com/news/local-news/licking-county/microsoft-pulls-out-of-licking-county-projects/
What if: A 10%/yr reduction in forecast new Data Center starts in 2025 and 2026 would result in reduced Data Center construction spending by -3% in 2025, -7% in 2026, -7% in 2027 and -3% in 2028.
What if: A 10%/yr reduction in forecast new Data Center starts in 2025 and 2026, combined with a 10% cancelation of 2024 starts, would result in reduced Data Center construction spending by -8% in 2025, -10% in 2026, -8% in 2027 and -3% in 2028. A 10% drop in Data Center spending is $4bil/yr.
It is not clear if the two halted projects mentioned in the article above were already committed construction starts or future proposed starts.
The Fed Chair just said what every credible economist, every economics textbook, and every empirical study shows: Tariffs reduce output and raise prices. – Justin Wolfers, Econ professor at Michigan, Senior fellow, Brookings and PIIE.
Let’s not forget what initiated growth in new manufacturing facilities. New manufacturing building contract starts over the last 3yrs is just over $600bil. Normal starts without government investment would be about $300bil over 3yrs. About $100bil of spending growth over the 3 years is inflation, leaving the remainder of about $200bil in spending growth attributed to government investment. All that began, and most of it got spent, under the previous administration. https://www.forbes.com/sites/courtneyfingar/2024/12/12/manufacturing-jobs-boom-arrives-too-late-for-biden-to-benefit/
Whenever we get an unusually large increase in new construction starts and spending, the tapering off of those projects leads to a decline on the tail end. Mnfg new starts peaked in 2022-2023. We are entering the period of the manufacturing construction spending taper. Mnfg spending has fallen slightly in 4 of the last 5 months. The forecast for 2025 is down -10%.
Microsoft has announced a pullback in spending on new Data Centers. Reduced demand negates need for new facilities, kills expansion plans, lowers new construction forecast, decreases jobs growth in construction. Mothball if partially built factory, not only expensive for owner, but also negative impact to contractor’s forecast revenues.
Whenever there’s a devastating natural disaster, causing destruction to homes, property and infrastructure, the supply of contractors, laborers and materials stays the same while demand skyrockets from victims trying to rebuild. Contractors generally pick more profitable projects over less lucrative ones.
In the Construction Analytics Outlook Feb 2025 report I said, “Don’t be surprised if 2025 construction jobs growth slows a bit. Jobs are slightly ahead of volume growth, particularly in the Non-building Infrastructure sector.”
Construction gained 19k (+0.2%) jobs in Feb, BUT total hours worked declined 0.3%. Total jobs have increased but Hrs worked has gone down the last 5 months. We’ve posted minor jobs gains in both Jan and Feb, and yet unemployment has gone up from 5.2% in Dec to 7.2% in Feb.
The March jobs report shows only minor gains in the # of jobs. We’ve added only 24,000 new jobs in the 1st quarter, the slowest 1st qtr jobs growth in 13 years (except for 2020, Covid). But hours worked in March increased by 1.5%. That acts on the entire 8.3 million workforce and is equivalent to adding 128,000 more jobs.
The jobs numbers reported April 4th cover the period from Feb15-Mar15. There are not yet any impacts from tariffs reflected in the jobs numbers.
We may see the term “force majeure” come up a lot in the near future. And if construction contracts don’t have a force majeure clause, there may be a lot of contractors in trouble.
My guess is if the people of Greenland take a vote to Join the United States, it would be 99-1 No. Of course, they would say “No, thank you.” As they so eloquently put it, “We’re not assholes.”
