How did we do?
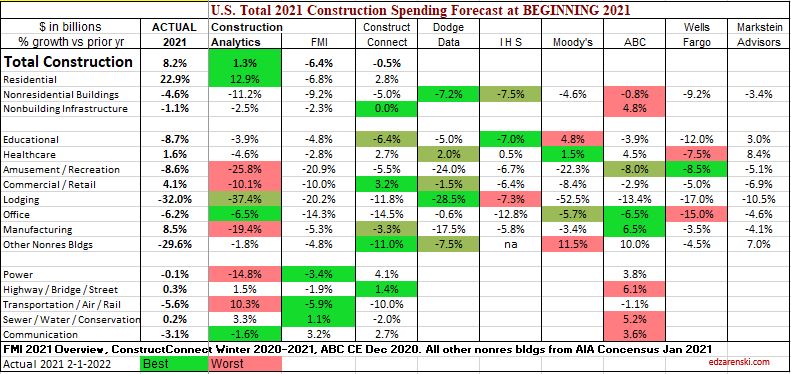
These colorful tables show the 2021 construction spending forecasts from 8 firms published in the January 2021 and July 2021 AIA Consensus Outlook. Construction Analytics (my forecast) Beginning year and Midyear forecasts are included for comparison. The actual spending year end published by U.S. Census on 2-1-22 is included. Forecast are highlighted in bright green (Best), dull green (2nd best) and red (worst).
FMI’s forecast is modified to move Transportation and Communication into the nonbuilding category to conform with other forecasts and also to conform with how Census reports these items. Other Nonres Bldgs is the total of Religious (15% of $) and Public Safety (85% of $) combined. Not all firms provide forecasts for residential or nonbuilding infrastructure.
All too often, forecasts are published but no one looks back to see how the actual results compared to the estimates. Also, looking at the Jan 2021 and Jul 2021 forecasts, you can see if and by how much each firm revised their estimate for the year.
This is the initial Census release of actual 2021 data. Results always get revised with the release of May data (July 1) in the following year. On July 1, 2022, any significant revisions to 2021 actual spending data will be revised and these table will be reissued.
Forecast at the Beginning of 2021
Forecast at MIDYEAR 2021
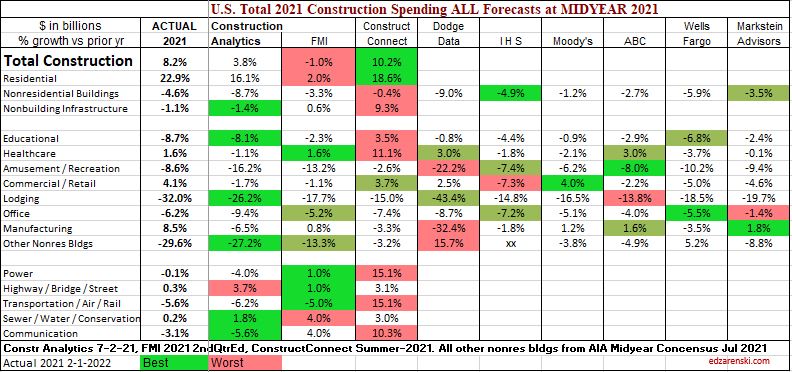
Construction Analytics (my forecast) didn’t fare so well in the 2021 Beginning of year forecast, but then did quite well in the Midyear forecast. My forecasts are based on cash flow of Dodge forecast of construction starts. When starts get revised, my forecast gets revised. Dodge revised the forecast of 2021 starts substantially after the beginning of the year, so that revised my forecast.
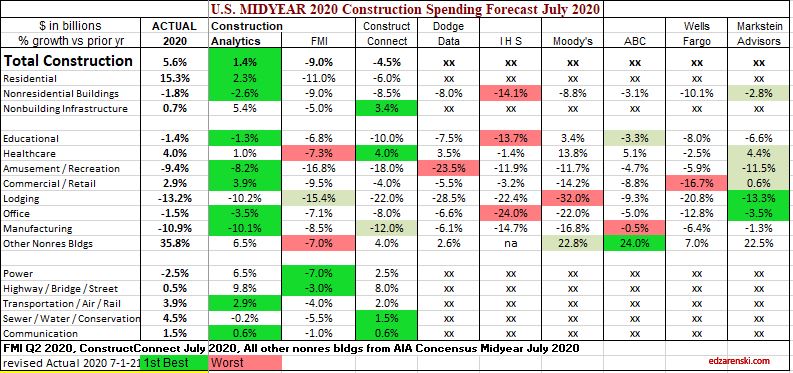
Below is the same data for AIA Midyear Outlook 2020 and my respective forecast at that time. My midyear forecast in 2020 had more best estimates than all other forecasts combined. Although it should be noted, no one got residential even close in 2020, I just happened to be least wrong.
Forecast at MIDYEAR 2020
A word on averages. Generally, the more inputs to an average, the closer the average will be to accurate. But it’s probably worth your while to take a look at the spread between forecasts on any particular line item. When you see 7 out of 8 estimates within a tight range of 5 points, and then one varies by 30 pts., it might be a good idea to question the validity or throw out the outlier.
Also, recognize that the Midyear forecast is a much different animal than the Beginning of Year forecast. At midyear, we already have 5 or 6 months of actual data to influence the value of the forecast at the end of the year. If we have 6 months of actual data that is already UP 10% year-to-date, and a forecast predicts the year will end DOWN 10%, each of the final 6 months of the year would need to come in at -30%. I wrote about that in detail several times last year. See https://edzarenski.com/2021/10/01/construction-spending-update-10-1-21/
