Construction Analytics 2019 Construction Economic Forecast – Nonresidential
This Dec. 2018 Construction Economic Forecast analysis addresses New Construction Starts, Inflation, Cash Flow or distribution of construction work over time, Annual Backlog and Spending. New Starts is new work entering Backlog. Cash Flow gives the pattern of Spending. Inflation differentiates between Revenue and Volume. Backlog, which can be referenced to assess expected future Volume and Spending, provides an indication of when Volume occurs or in what year Revenues occur. Starts data is from Dodge Data & Analytics. Spending data is from the U.S. Census Bureau. Jobs data is from the Bureau of Labor Statistics. Inflation data is from the source labeled. Cash flow, Backlog and Inflation forecast data are developed internally. All data in this report is national level data. All forecast data is by Construction Analytics.
NOTE 12-6-18: Dodge Data and Analytics new construction starts for October, released 11-20-18, reached the 2nd highest seasonally adjusted annual rate ever, 2nd only to June 2018. Most spending from these new starts will occur in 2020. This will increase the 2020 nonresidential buildings spending forecast, with the largest increase in manufacturing. Construction Starts for October, the Dodge end-of-year report and October spending, all released between 11-21-18 and 12-3-18 significantly alter this analysis. The biggest changes reduced residential spending for the next two years. See the 2019 Construction Economic Forecast – Summary for the residential analysis.
This analysis was edited 12-6-18 to include that most recent starts data and the U S Census October spending data.
For a fully formatted PDF of this Nonresidential report 2019 Construct Econ Forecast – NONRES – Dec 2018 RVSD 12-6-18
Link to 2019 Construction Economic Forecast – Summary
Summary
Total of All construction spending is forecast to increase 6% to $1.321 trillion in 2018 and 1.5% to $1.341 trillion in 2019. Spending in 2020 is forecast to reach $1.426 trillion.
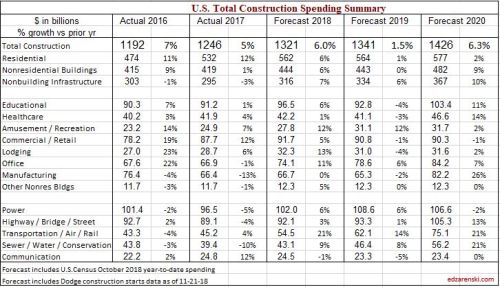
Nonresidential Buildings construction spending is forecast to increase 6% to $444 billion in 2018, 0% to $443 billion in 2019 and 9% to $482 billion in 2020. The forecast for 2019 will be supported by Office (which includes data centers) and Amusement/Recreation but there is downward pressure from slowdowns or timing of cash flow in Manufacturing, Lodging, Healthcare and Educational. Educational, Healthcare, Recreation, Office and Manufacturing all support growth in 2020.
Residential construction spending for 2018 was recently revised down and starts for 2019 are expected flat to down slightly. The forecast is now for an increase of 5.6% to $562 billion in 2018, 0.5% to $564 billion in 2019 and 2.3% to $577 billion in 2020. Although residential spending is still increasing, growth has slowed to less than inflation. Real volume after inflation is declining.
Nonbuilding Infrastructure construction spending is forecast to increase 7.2% to $316 billion in 2018, 5.7% to $334 billion in 2019 and 10.1% to $368 billion in 2020. Transportation spending provides strong growth for the next three years from record new starts in 2017 and the 2nd best year of starts in 2018. Public Works had strong growth in 2018 starts and Highway starts hit a new high in 2018.

In July of the following year the spending data for the previous two years gets revised. Those revisions are always up, although some markets may increase while others decrease. So, even though the current forecast for 2018 is $1,328 trillion, a gain of 6.5%, that will most likely increase.
Dodge Data construction starts are initially anticipated to finish 2018 flat compared to 2017. However, starts are always revised upward in the following year. I expect revisions will show 2018 starts increased by 4% over 2017. Even with revisions, 2018 starts will post the slowest growth since 2011. Starts increased 84% in the period 2012-2017, residential 150% and nonresidential buildings 80%. This forecast includes only a total of 10% growth for the 3-year period 2018-2020.
Starting backlog, currently at an all-time high, increased on average 10%/year the last three years. For 2019 starting backlog is forecast up 10% over 2018. 80% of all Nonresidential spending within the year will be generated from projects in starting backlog. Due to long duration jobs, 2019 nonresidential buildings starting backlog is up 50% in the last 4 years. Current indications are that 2019 backlog will be up 6%-8% across all sectors.
Construction Inflation Indices
Outside of recession years, nonresidential buildings construction spending year over year growth dropped below 4% only SIX times in 50 years. The long-term average inflation is 3.75%. Every year that spending dropped below 4% growth, nonresidential buildings real volume declined.
Construction Analytics Nonresidential buildings inflation forecast for 2018 is 4.9%. Current reliable inflation forecasts range from 4.7% to 5.6%. Inflation in this sector has been at 4% or higher the last four years.
Anticipate national average construction inflation for nonresidential buildings for 2018 and 2019, including steel tariff impact, of 4.25% to 5.5%, rather than the long-term growth average of 4%. Adjust for any other yet unknown tariffs that may hit after Jan 1, 2019.
In the following plot, Construction Analytics Building Cost Index annual percent change for nonresidential buildings is plotted as a line against a bar chart background of the range of all other nonresidential building inflation indices. Usually the lows are formed by market basket input indices while the highs are formed by other selling price indices.

Non-building Infrastructure indices are far more market specific than any other type of index. Reference specific Infrastructure indices rather than any average.
These links point to comprehensive coverage of the topic inflation and are recommended reading.
Click Here for Link to a 20-year Table of 25 Indices
Click Here for Cost Inflation Commentary – text on Current Inflation
New Construction Starts
All construction starts data in this report references Dodge Data & Analytics Starts Data.
For nonresidential buildings, approximately 20% of the spending occurs in the year started, 50% in the next year, 25% in the third year and only 5% in the fourth year or later year. This means that nonresidential spending growth in 2019 is still being affected by starts from 2016.
The following plot show the 3-month moving average and trend line of starts for Nonresidential Buildings. Starts can be erratic from month to month. The trend line gives a better impression of how starts impact spending. It is the rate of change in starts cash flows that provides a predicting tool for spending.

Starts are sometimes misinterpreted in common industry forecasting articles. Starts dollar values represent a survey of about 50% to 60% of industry activity, therefore Starts dollar values cannot ever be used directly to indicate the volume of spending. Also, Starts do not directly indicate changes in spending per month or per year. Only by including an expected duration for all Starts and producing a forecast Cash Flow from Starts data can the expected pattern of spending be developed. Finally, it is the rate of change in Starts Cash Flows that gives an indication of the rate of change in spending.
Starts is a survey sample of a portion of all construction, on average about 50% to 60% of all construction. This can introduce potential error when using starts to predict spending. In any survey, if sample size remains constant, let’s say at 50% of population, but survey response increases 5%/year, then output of the population should increase at 5%/year. However, if survey response increases at 5%/year but sample size is increasing at 3%/year then output of the population should increase at only 2%/year.
If starts survey sample size varies from year to year, it’s possible some of the anticipated spending growth reported by new starts may not represent growth in real volume of future work but could simply represent a change in sample size. Potential significant variations in sample size are seen in the data and may cause errors in the forecast. The detail of Education spending provides an example.
Starting Backlog
Nonresidential Buildings starting backlog at the beginning of 2018 reached an all-time high. For nonresidential buildings this backlog will contribute spending until the end of 2021. Starting Backlog for 2019 is forecast to increase 8%. For purposes of this analysis, I’ve set only moderate or low increases in starts for 2020 and 2021, so this forecast may hold down the future backlog and spending forecast. However, backlog leading into 2019 is up 70% in 5 years.

Starting Backlog is the Estimate-to-Complete (ETC) value of all projects under contract at the beginning of a period. Projects in starting backlog could have started last month or last year or several years ago.
- 75%-80% of all Nonresidential Buildings spending within the year will be generated from projects in starting backlog.
- 80%-85% of all Non-Building Infrastructure spending within the year will be generated from projects in starting backlog.

Non-building Infrastructure starting backlog at the beginning of 2018 reached an all-time high. Some of this is very long-term work that will contribute spending until the end of 2025. In fact, more than half of all spending in 2019 comes from projects that started prior to Jan 2018. 2019 Backlog is forecast to increase 10%. Backlog is up 45% in 5 years but is up 50% in just the last 3 years.

Cash Flow
Simply referencing total new starts or backlog does not give the complete picture of spending within the next calendar year. Projects, from start to completion, can have significantly different duration. An office building could have a duration of 18 to 24 months and a billion-dollar infrastructure project could have a duration of 3 to 4 years. New starts within any given year could contribute spending spread out over several years. Cash flow totals of all jobs can vary considerably from month to month, are not only driven by new jobs starting but also by old jobs ending, and are heavily dependent on the type, size and duration of jobs.
Although new nonresidential buildings starts increased only 1.6% in 2018 note that cash flow increases by almost 8% due to a very large increase from starting backlog. To a lesser extent the same thing happens in 2019.
Non-building infrastructure starts and cash flow follows a similar pattern. In 2018 and 2019 new starts decline moderately, spending from new starts declines substantially but starting backlog and spending from starting backlog increases are so strong that total cash flow within the year continues to increase.
Nonresidential Buildings Spending
Construction spending is strongly influenced by the pattern of continuing or ending cash flows from the previous two to three years of construction starts. Current month/month, year/year or year-to-date trends in starts often do not indicate the immediate trend in spending.
Nonresidential Buildings construction spending is forecast to increase 5.8% to $444 billion in 2018, fall -0.2% to $443 billion in 2019 and climb 8.9% to $482 billion in 2020. Office (which includes data centers) and Amusement/Rec support the 2019 forecast but there is downward pressure from slowdowns or timing of cash flow in Manufacturing, Lodging, Healthcare and Educational. Educational, Healthcare, Recreation, Office and Manufacturing all support growth in 2020.


Nonresidential buildings construction spending in constant $ (inflation adjusted $ to base 2017) will reach $424 billion in 2018 after hitting a post-recession peak of $431 billion in 2016 and dropping to $419 billion in 2017. In 2019 constant $ spending will total $420 billion. Constant $ spending or real volume growth shows all years from 1996 through 2009 had higher volume than any years 2016-2019. Volume reached a peak near $530 billion in 2000 & 2001 and went over $500 billion again in 2008. In constant $ volume, I don’t see returning to that peak before 2023.

Educational
New Starts averaged YOY growth of 11%/year for the last five years. Starts from the last five months of 2017 posted the highest 5mo total in at least seven years, 13% higher than the next best 5mo. The highest and 2nd highest quarters were both within the last 15 months, so both those periods contribute fully to 2018 spending. 2017 starts will support 25% of spending in 2019. Starts are expected to finish 2018 up 5%. 2018 starts will support 50% of spending in 2019 and 20% of spending in 2020.
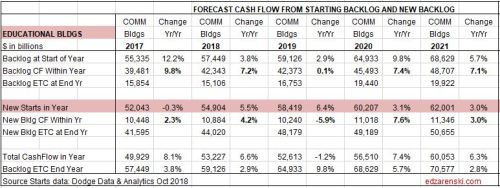
Backlog in five years 2014-2018 increased 11%/year. It is unusual that Starts and Backlog continue to grow for five years but that growth is not reflected in actual spending. From 2013 to 2018 new starts increased 66% but spending for the period of those starts will increase only 34%. That would seem to indicate a very large volume of work is growing in backlog and spending at some point should boom and remain high for an extended period, but the cash flow model is not in agreement. A possible explanation is the sample survey of new starts has been increasing, so not all the starts growth for five years represents growth in new work. Some of the increase in starts is simply growth in sample size. Educational starts 2012-2015 averaged 50% sample size of total spending. In 2016-2018 the average sample size vs spending was 60%.
Spending is now at a post-recession high. Spending increased 6%/year for 2015, 2016 and 2018, while 2017 increased only 1%. 2017 and 2018 are still subject to revision. Expect to see growth level off until mid-2019. Leveling at post-recession high is not a bad thing. A build-up of backlog is indicating that spending should increase substantially, but a disconnect in the analysis was noted above. Spending growth increases again in 2020.
At peak, educational represented 30% of all nonresidential buildings spending. Now it’s only 22%. That’s expected to increase slightly for the next three years.
Educational construction spending is forecast to reach $96 billion in 2018, $93 billion in 2019 and $103 billion in 2020.
Healthcare
Starts are at an all-time high, up almost 40% in the last 5 years. Some longer duration projects push a substantial amount of spending out to 2020.

Backlog increased 11% for 2017 and 8% for 2018. Backlog has been increasing unevenly and grew 30% in 4 years. Backlog increases 3% to start 2019 but is not indicating spending growth in 2019. Cash flow from backlog is indicating spending growth in 2020.
Spending has been very slow to recover, experiencing declines as recently as 2013 and 2014, hitting an 8 year low in 2014, when all other nonresidential building markets had already returned to growth. 2017 posted a gain of 4.4% but then 2018 gained less than 1%. Backlog is increasing but real spending gains won’t materialize until 2020.
Like Educational, backlog growth has been exceeding spending growth for the last few years. That would indicate spending at some point may boom and remain high for an extended period. Cash flow models indicate this may occur in 2020. Other possible explanations are; starts are overstated; cash flow curves (average 28mo) are too short in duration; projects got canceled after starts were recorded; large spending revisions could get posted in the future.
Healthcare construction spending for 2018 is forecast to finish at $42 billion, an increase of only 0.7% over 2017. Considering 4% inflation, Healthcare real volume has declined every year since 2012 with exception of 2017 which would have been flat. It will decline again in 2019 with a forecast -2.7% decline in spending. 2020 realizes the 1st big spending increase in 8 years, +14% to $47 billion.
Amusement/Recreation
Starts are up 13% in 2018. Although down 1% in 2017, starts increased at an average rate of 15%/yr. from 2013 through 2017. Within the past 15 months there have been five billion-dollar project starts.

Starting backlog increased 20%/yr for the last four years while spending was increasing at a rate of 10%/year. This means backlog should continue to support increased spending at least for the next few years.
Spending hit an 8 year low in 2013 but we’ve had 3 years of excellent growth of 10%/yr or more since then. 2017 spending increased only 7% and 2018 11%, but cash flow is indicating a 12% increase for 2019. This market is only 5% of nonresidential buildings spending.
Amusement/Recreation construction spending for 2018 is forecast to reach $28 billion, an increase of 12% over 2017. 2019 is forecast to increase 12% to $31 billion.

Commercial/Retail
Commercial/Retail starts have been increasing every year since 2010 but starts in 2018 are flat vs 2017 Starts are at a peak but after 5 years of 15%-20% growth/year are up only 4% in the last two years.
Commercial starts are seeing strong gains from distribution centers (warehouses which are in commercial spending). The decline in retail stores is being hidden by the increase in warehouses, which are at an all-time high. Stores are down 10% from the peak in 2016. Warehouses are still up only 4% in 2018 but increased 500% from 2010 to 2017.
In 2010, Warehouse starts were only 1/3 of Store new starts. In 2018, Warehouse starts are 25% greater than Store starts. Warehouse starts have increased between 20%-40%/year for seven years and are now five times greater than in 2010. See this Bloomberg article Warehouses Are Now Worth More Than Offices, Thanks to Amazon

Some big projects from a period of strong new starts growth are ending. This will slow spending after 7 years of strong growth. 2018 backlog still produces a spending increase which may finish close to +5%, but forecast shows spending slows even more to only 2% in 2019 and less than 1% in 2020.
The biggest change in Commercial/Retail in the last few years is that backlog is now more heavily weighted with warehouse projects than store projects. The mix has shifted from 60/40 stores in 2014-2015 to 55/45 warehouses in 2018-2019.
Spending dropped from the high of $90 billion in 2007 to $40 billion in 2010. It has been growing steadily since reaching bottom in early 2011 and has recovered to an annual total rate of $92 billion in 2018. Spending increased an average of 13%/year for six years from 2012 through 2017. Spending growth will be flat in 2019 and 2020 but we are currently near the all-time high. It is worth noting that the $92 billion in 2018 dollars after accounting for inflation is still 30% lower than the $90 billion of spending in 2007.
Commercial/Retail construction spending is forecast to reach $92 billion in 2018, $91 billion in 2019 and $90 billion in 2020, flat to no growth after seven strong years.
Office
Starts finished 2018 up 8%. In 2016 starts were up 30% and had reached similar too highs in 1998 and 2006-2007. Starts have been increasing since 2010 with the strongest growth period 2013-2016, up 25%/year. Although the rate of growth slowed in 2017 and 2018, the total amount of starts is at an all-time high. In the last 12 months there are no less than a dozen project starts valued each at over $500 million, a few of those over $1 billion. That high-volume period of starts will elevate spending through 2019 and well into 2020. Data centers are included in Office.
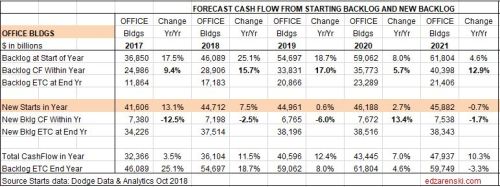
Backlog for 2017 was the highest in at least 8 years, more than double at the start of 2014 when the current growth cycle of office construction spending began. For 2018, backlog reached a new high, up 25% over 2017. Starting backlog for 2019, up 19%, is three times what it was just five years ago. Office starting backlog 2017-2019 increased an average of 20%/year. Backlog growth should support strong spending into 2020.
Growth of only 1% in starts for 2019 and 3% increase for 2020 keeps office starts near the all-time high. Even with low growth in new starts for the next two years, the amount of work in backlog from starts on record provides growth in spending for the next three years.
Spending increased by 20%/year from 2013 to 2016, but in 2017 it turned to a 1% decline. That was unusual and unexpected since 2016 starts and 2017 backlog had both reached 10-year highs. Possible explanations might be: a very large number of projects were canceled or delayed; potential revisions to 2017 Office spending may still be pending (In July every year, the previous two years of spending gets revised); but highly probable is the sample size of starts increased dramatically in 2016 and the 30% increase in starts was not all growth in real volume but was partially just a change in sample size, therefore the spending forecast may have been significantly overstated.
Again, it is worth noting that spending in 2018, which for the first time returned to the previous highs posted in 2008, once adjusted for inflation is still about 25% lower in real volume than 2008.
Office construction spending is forecast to reach $74 billion in 2018, $79 billion in 2019 and $84 billion in 2020.
Lodging
Lodging posted a new high for starts in 2018, up 8% over 2017. For the period 2011-2016 starts averaged over 30%/year growth for six years. In 2017, starts declined 4% but that remained near the 2016 high. Now with a gain in 2018, those three years average very evenly. Peak starts were in 2016.

Starting backlog averaged increases of 30%/yr. from 2015 to 2017. Lodging starting backlog jumped from $7 billion/yr. in 2014 to $15 billion/yr. in 2018. It has supported similar spending growth. Lodging projects have relatively short duration and timing of starts within the year is important to spending and next-year starting backlog. Compared to most other types of nonresidential buildings, a greater than average percentage of lodging spending occurs within the year started. So, movement in starts has a greater impact on spending within the year.
Lodging spending recorded the largest drop of any market, falling 75% from $36 billion in 2008 to $9 billion in 2011. However, it also recorded the strongest rebound of any market, climbing 20% to 30% per year for the 5-years 2012-2016. In 2011, Lodging dropped to only 3% of total sector spending. It rebounded to 7% in 2017. Lodging actual spending increased 12% in 2018. It’s still not back to the previous high of $36 billion in 2008. Beyond 2018, spending will decline, but this is after 6 years of growth totaling 300%.
Lodging construction spending for 2018 is forecast to reach $32 billion, an increase of 12% over 2017. Spending is forecast at $31 billion for 2019 and $32 billion for 2020.

Religious and Public Safety
Spending of $11-$12 billion/year represents only 2.5% of total nonresidential building spending. In 2008-2009 it was 5% of the total. The religious building market has been declining since 2002 and is down 55% since then. Public Safety peaked in 2009 and has declined every year through 2017, down 40% from the peak. In 2018, public safety spending is increasing.
I don’t track starts or backlog for these markets. I do track monthly spending and carry a forecast in the Table of Construction Spending classified as Other Nonres Buildings.
Religious and Public Safety currently amounts to $12 billion/year. A 10% change in spending of $1.2 billion in a year would amount to only 0.2% change in all nonresidential buildings spending. This category doesn’t often change by 10% yr/yr, so it’s affect is very small.
Manufacturing
Manufacturing reached record high starts in 2014 and record spending in 2015, posting a 100% increase in new starts in 2014 that drove starting backlog and spending to new highs in 2015 and 2016. New starts declined 20%-30%/year for the next two years after the high in 2014 but then 2017 starts increased 27%. Now 2018 starts have increased by 18%, yet that is still 15% lower than 2014.
Starts in June came in at four times the average of all monthly starts in the last three years. October came in at three times the average. Those two months would add up to more than half of annual starts for any of the last three years. Some of these projects will still be contributing to spending in 2023.

Starting Backlog remained equally high in 2015 and 2016, but then dropped 17% in 2017. Backlog dropped 17% in 2017 and actual spending dropped 13%. That was expected. What was unexpected is that 2017 posted another very strong year of new starts, up 27%. This will support a spending rebound in the future but not before a temporary drop in mid-year 2019.
Spending was forecast to fall in 2017 after peaking in 2015 from massive growth in new starts in 2014. Based on cash flows from starts, from April 2016 through the end of 2017 spending was expected to decline in 17 of 21 months. It did decline in 14 of those months. Over the next 30 months there are only six months have a forecast to decline, all of those between March and September 2019, all caused by uneven cash flows from very large projects either ending or pushing spending out to future years. This will hold down total spending in 2019. Although backlog for 2019 is up 40%, much of the cash flow from that will occur in 2020.
Manufacturing construction spending is forecast to reach $67 billion in 2018, $65 billion in 2019 and then jump 25% to $82 billion in 2020. Given the growth in backlog and some very long duration projects started recently, spending growth may increase again in 2021.
Non-building Infrastructure Spending
Non-building Infrastructure construction spending is forecast to increase 7.2% to $316 billion in 2018, 5.5% to $334 billion in 2019 and 9.9% to $367 billion in 2020. The forecast growth for 2019 will be supported by Transportation and Public Works but will be held down somewhat by Highway. Transportation terminals and rail project starts both increased more than 100% in 2017 and both are long duration projects types that will contribute spending for several years. Environmental Public Works project starts increased 20% in 2018 and boost spending in 2019 and 2020.

Non-building Infrastructure constant $ volume reached a high of $309 billion in 2015 and peaked at the all-time high of $311 billion in 2016, but then dropped to $295 billion in 2017. 2018 saw a return to $303 billion and 2019 is projected to reach $309 billion. Only twice before, 2008 and 2009, did Infrastructure exceed $300 billion. Constant $ spending or real volume growth has been within +/- 3% for the last 5 years.

Non-building Infrastructure spending, always the most volatile sector, in mid-2017 dropped to 2013 lows. However, this short dip was predicted. Cash flow models of Infrastructure starts from the last several years predicted that dips in monthly spending would be caused by uneven project closeouts from projects that started several years ago, particularly in Power and Highway markets.

Current backlog is at an all-time high, up 10%+ each of the last 3 years, and spending is expected to follow the increased cash flows from the elevated backlog. Transportation terminals new starts in 2017 jumped 120%. Rail project starts increased more than 100%. Starting backlog for all transportation work is the highest ever, up 100% in the last two years. Transportation spending is projected to increase 15-20%/year for the next two years.
No future growth is included from infrastructure stimulus and yet 2018 spending is projected to increase by 7%. 2019 and 2020 are forecast to increase 6% to 10%.
Power
Power spending as reported by U.S. Census includes infrastructure for all electric power generation plants and distribution, gas and LNG facilities and all pipelines. In the last year there were more than twenty $billion+ project starts and a dozen more projects valued over $500 million each. In 2015 pipeline starts represented less than 10% of all power starts. In 2018 year-to-date, pipelines are half of all power work started. In three years, pipeline work increased by more than $20 billion or 500%.
Starts, completions and pauses in work cause erratic movement in actual spending. Cash flow may be adversely impacted by very large projects ending or by the delay of large projects that started previously. A multi-billion-dollar nuclear power plant stopped work and large pipeline project delays after the start was recorded have adversely impacted the cash flow forecast. This impacted the spending forecast in 2017, which finished down 5%, 15% below initial projections, and again 2018 will finish 10% below initial projections for 2018 posted back in Nov. 2017.

Although total power starts for 2018 are down 13%, electric / power generation is down 35% but gas/LNG and pipelines starts are up. Starts peaked in 2015-2016, but total in backlog reached a peak in 2018. However, much of this work is very long duration projects, so 2018 backlog will be providing spending at least through 2021. Spending could see 5% gains in 2019 but unless 2019 starts increase 2020 will experience a modest decline. Dodge is predicting 2019 starts will decline 3%.
Power construction spending is forecast to reach $102 billion in 2018, $109 billion in 2019 but then only $107 billion in 2020.
Power spending highlights one of the biggest shortfalls of judging expected performance based on year-to-date change. Notice in the 1st quarter of 2018, spending year-to-date (YTD) was down 8% to 10% from 2017. It is clear now that did not give a good indication of how 2018 would proceed. A better indication is provided by the trend line expected in the current year versus the trend line in the previous year. If they diverge, then early YTD changes will not give a clear indication of expected performance in the current year. An example follows. Note, SAAR data shows performance trend but cumulative NSA$ is needed to get YTD$.

![]()
Power posted the highest spending for 2017 early in the year, then declined in the 2nd half. In 2018, the beginning of the year posted the lowest rate of spending for the year, increased through June, then stayed higher in the 2nd half. The YTD percent growth compared to 2017 has been increasing throughout the year. Higher spending in the 2nd half 2018 compared to the lowest values of the year in late 2017 will boost year-to-date spending every month through year end. Although YTD spending through August is up only 2%, I expect the total for the year will finish up 6%. Even if power spending declines 1% per month for the remainder of the year it will still finish up 5% over 2017.
Highway/Street/Bridge
Highway starts hit an all-time high in 2017 and are forecast to climb another 8% in 2018. This model is predicting starts growth will slow or level off after 2018.
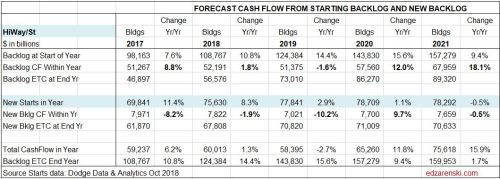
Starting backlog increased 30% in the last 3 years and will increase another 14% leading into 2019. This long duration backlog is going to provide for a large increase in spending but not until late 2020 and even more-so into 2021.
Spending in 2018 did not increase in tandem with backlog, because the share of spending within the year from projects that started 1 or 2 years before began to decline. In 2020 and 2021, the share of spending within the year from projects that started 2, 3 and 4 years before is increasing.
Highway construction spending is forecast to reach $92 billion in 2018, $93 billion and then jump to $105 billion in 2020. 2021 may see an increase of 10% in spending.
Transportation
Transportation starts have two main parts, Terminals and Rail. Some analysts include transportation in nonresidential buildings. That does not account that airports include not only land-side terminals but also air-side runway work and rail includes platforms and all railway right of way work, which includes massive civil engineering structures. About half of all transportation spending is rail work.
Terminals and rail starts reached record high in 2017, both up 120% after a 35% increase in 2016. Spending in 2018 is forecast to finish up more than 20%. Starting Backlog increased 22% in 2017 then jumped 95% in 2018. However, Transportation sample size of new starts potentially increased 30%, far more than any other market. A large portion of the 2017 increase in starts is expected to be change in sample size. This model adjusts 2017 starts down by 20%. Still, most of that backlog spending will occur in future years. Some of the project starts in 2016 and 2017 have an eight-year duration. In the last 24 months there have been sixteen $billion+ new project starts and seven $500million+ new starts.
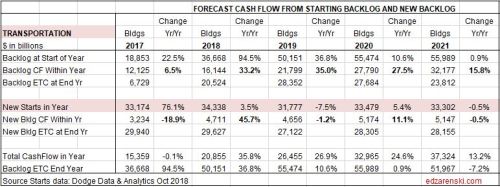
2018 total starts are 100% higher than any other year prior to 2017. Starting Backlog skyrocketed from $15 billion in 2016 to $55 billion for 2019. Backlog will support spending for several years to come. Keep in mind, when a $4 billion project first gets recorded in starts, that is the general contract. Many subcontracts will be awarded by the general contractor over the next few years.
Based on predicted cash flows from starts, spending is expected to increase at least into mid-2021. 2018-2019-2020 should see increases of 15% to 20%/year. Dodge is forecasting 2019 starts will stay close to the elevated levels of 2017 and 2018. I’m predicting starts in 2019 will decline from 2018 simply due to the huge volume of new work that started in the last two years. Even with that, backlog could set a record high in 2020.
Transportation construction spending is forecast to reach $55 billion in 2018, $62 billion in 2019 and $75 billion in 2020. Given the growth in backlog and some very long duration projects started recently, spending growth may increase again in 2021.
Environmental Public Works
Environmental Public Works includes sewerage projects, Water supply and Conservation, or Dams, water resource and river/harbor projects. New starts for all these type projects declined from 2014 through 2017. Then all showed gains in 2018 and the forecast is more gains in 2019. All of these projects are public spending and saw no real gains in spending from 2010 through 2017. With the projected increases in starts in 2018 and 2019, spending is now forecast to increase the next three years to a new high by 2020.
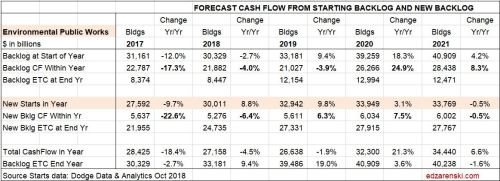
Public Works construction spending is forecast to grow 9% to reach $43 billion in 2018, $46 billion in 2019 and $56 billion in 2020.
Communications
Starts data for communications is not regularly reported. Total starts for the year is always recorded well after year end. A moderate forecast is included for future starts growth the next two years.
Actual spending is erratic, up 10% one year down 3% the next then up 25% followed by 2% growth. 2018 should finish down 1% after a 12% gain in 2017. The forecast shows a 5% decline in 2019 and flat spending into 2020.
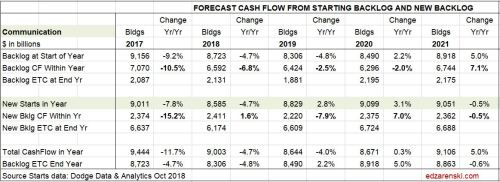
Communication construction spending was up 12% in 2017 and finished at $24.8 billion The forecast for 2018 is down 1% to $24.5 billion. Expect $23 billion in 2019 and $23 billion in 2020.
For a PDF of this Nonresidential report 2019 Construct Econ Forecast – NONRES – Dec 2018 RVSD 12-6-18
