12-18-20
Public Starts and Backlog
Leading into 2020, the Public markets with the highest growth in new starts the previous two years were Transportation and Public Works. Transportation terminals and rail starts were up 15% over two years, 25% in the last three years. Backlog nearly doubled in three years because a large portion of those starts is very long duration projects. Public works starts were up 13%, 20% in three years, and backlog is up 40%. Infrastructure projects typically have the longest duration. Projects contribute spending sometimes up to 5 or 6 years.
Public work backlog leading into 2020 was up an average 8%/year for the last three years. Some of this is very long-term work that started construction in 2017 and it will still contribute spending for the next several years. 40% of all public spending in 2020 comes from projects that started prior to Jan 2019.
2020 losses in new construction starts impact the forecast for the next few years. Total new starts in 2020 for Public work dropped 9%. Transportation starts fell 20%, Educational starts fell 11% and Public works fell 6%. Amusement/Recreation starts fell 40%. Highway/Bridge starts increased 4%.
2021 Starting Backlog for all Public work is down 5%. Backlog for Transportation projects drops only 4%, and that leaves 2021 still 2nd only to the all-time high in 2020. Both Educational and Public Works backlogs drop 7%. Amusement/Recreation backlog falls 40%. Highway backlog increases 3%. Of all public work in backlog at the start of 2021, 43% comes from projects that started prior to Jan 2020.
Public Spending
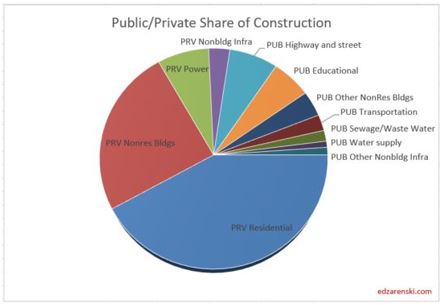
The two largest markets contributing to public spending are Highway/Bridge (30% of total public spending) and Educational (25%), together accounting for 55% of all public construction spending. At #3, Transportation is only 12% of public spending. Environmental Public Works combined makes up 15% of public spending, but that consists of three markets, Sewage/Wastewater, Water Supply and Conservation. Office, Healthcare, Public Safety and Amusement/Recreation account for about 3% to 4% each.
Highway is 100% public and Public Works 98%. Educational is 80% public, Transportation 70%, Amusement/Rec 50% and Healthcare 20%.
Total public spending for 2020 is projected to finished up 5% at $350 billion. Spending for every major public market is projected to finish up in 2020. By far, the largest Public spending increases measured in dollars for 2020 are Educational, Transportation and Public Safety.
Total public spending in 2021 is projected to finished up 5% at $370 billion. Transportation provides most of the gains in 2021 and Public Works adds some, but this forecast may come down without support from Highway or Educational.

Public Infrastructure and Public Institutional
A bit less than 60% of all Non-building Infrastructure spending, $198 billion in 2020, is publicly funded. That public subset of work has averaged growth of $5 billion/year from 2013 through 2019, with maximum growth of $16 billion in 2019. 2020 increased only $4 billion. In 2020, Non-Building Infrastructure spending makes up about 60% of Public spending.
About 30% of all Nonresidential Buildings spending, $141 billion in 2020, is publicly funded. It’s mostly Educational. That public subset of work has averaged growth of $6 billion/year from 2013 through 2019, with maximum growth of $10 billion in 2017. 2020 increased $14 billion. In 2020, Nonresidential Buildings spending makes up about 40% of Public spending.
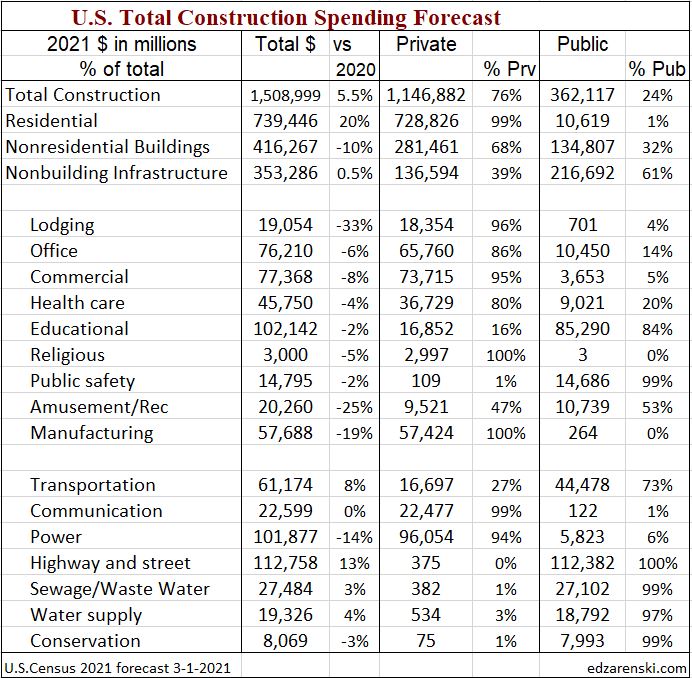
- Infrastructure = $349 billion, ~25% of all construction spending.
- Infrastructure is about 57% public, 43% private. In 2005 it was 70% public.
- Public Infrastructure = $198 billion. Private Infrastructure = $150 billion.
- Power and Communications are mostly privately funded infrastructure.
- Nonresidential Buildings is 30% public (mostly institutional), 70% private.
- Educational, Healthcare and Public Safety are Public Nonres Institutional Bldgs
- Public Commercial construction and Amusement/Rec. are not included.
- Public Institutional = $110 billion, mostly Education ($86b).
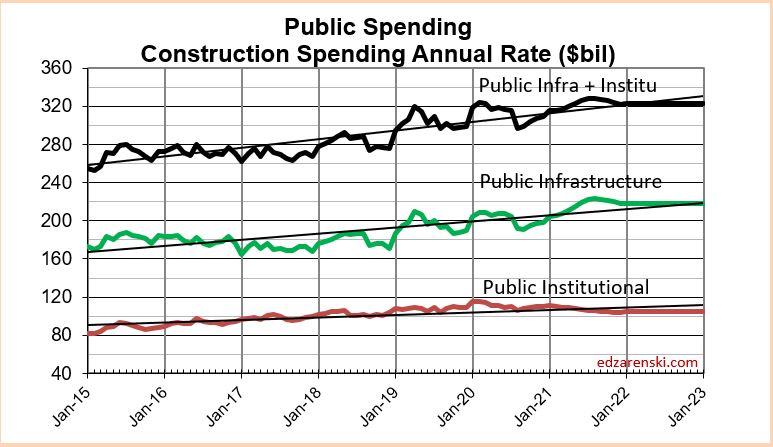
Public Infrastructure + Public Institutional = $308 billion, 22% of total spending.
Public Infrastructure + Institutional average growth is $12 billion/year. This subset has never exceeded $30 billion in growth in a single year. In 2019 spending increased $20 billion. With 10 months data posted, 2020 is forecast to increase $17 billion.
Although total all public spending may increase for 2021, the select group of Infrastructure + Institutional likely to be funded by an Infrastructure stimulus bill shows 2021 growth is uncertain and may remain flat.
See Also
Down the Infrastructure Rabbit Hole
