6-16-19
8-15-19 edits – added plots
In early 2007, residential construction volume had already dropped 20% and total construction volume was down 10%, (the annual averages would not show this dramatic drop but a monthly plot would), yet construction job openings and labor turnover survey (JOLTS) was peaking at a 6 year high. From Jan 2007 to Jan 2008, construction had already lost 250,000 jobs. All of that was in residential construction. At the time, nonresidential construction was still growing.
Nonresidential buildings volume would peak in late 2008 and non-building infrastructure peaked in early 2009. By that time, in Q1 2009, residential volume was down 60%. Even though nonresidential construction was peaking, total construction was down 25%.
In 2008 construction jobs declined by another 500,000, about 90% residential jobs. JOLTS dropped to half of the 2007 peak high. It was over the next year or so that all construction began to decline, jobs would drop in all sectors and JOLTS would plummet to an all-time low.
The point is this: The construction recession began with the decline of residential construction in 2006-2007, at a time when JOLTS was at a 6-year high. Jobs declines lagged the decline in real construction volume (the annual average plot shows this well).

It is remarkable how residential construction volume from the Q1 2006 peak to Q1 2007 had dropped 20% but residential jobs increased by 6%. JOLTS was peaking at a 6 year high. Although total construction jobs increased in 2006, jobs started to decline in the 2nd half 2006 and would drop 200,000 in 2007. JOLTS continued to show job openings increasing from mid-2006 to mid-2007. Neither jobs growth nor JOLTS reflected what was occurring in real construction volume and certainly did not give any leading indication of what was on the horizon.
The AGC survey of contractors has been reporting difficulty hiring construction labor every year since 2012. Yet from May 2012 through May 2019, construction added 1,870,000 jobs, an increase of 33%, the 2nd strongest jobs growth period ever recorded, not far behind 1993-99 when jobs and volume grew equally (JOLTS was not tracked before 2000). In the four years 2003-2006, just prior to the great recession we added 1 million jobs and volume growth kept up with jobs for the first three years, but then the residential recession started and volume began to plunge. However, JOLTS increased from 2003-2007. These three periods mark the best periods of jobs growth in the last 30 years.
During the last seven years, unlike 1993-99 or 2003-05, when jobs and volume grew equally, construction volume (spending minus inflation) increased by only 22%, far less than the 33% jobs growth. While contractors continue to report difficulty filling jobs, the pace of jobs growth is near an all-time high and is out-pacing the growth in volume of work to support those jobs. JOLTS increased every year during this period.
Now fast forward to 2019. Construction spending growth for the previous two years, 2017 + 2018, increased 4.5% + 5.0%. But inflation during this period was 4.4% + 4.8%. Real construction volume for the last two years increased less than 1%. But jobs increased by nearly 8% and JOLTS more than doubled from 2016 to the end of 2018.
This is a real head-scratcher. Volume has not increased for two years, yet jobs are up 8% and the indicator for job openings is increasing. This is not at all what the data should be showing.
In fact, from the 2006-2007 pre-recession peak until now, non-supervisory jobs have recovered to within 7% of the previous high, but construction volume is still 18% below the previous peak. Total all construction jobs is only 3% lower than the pre-recession high.

Just as the data showed in 2007, the data at the start of 2019 shows that we are top-heavy construction jobs that are not supported by real growth in construction volume.
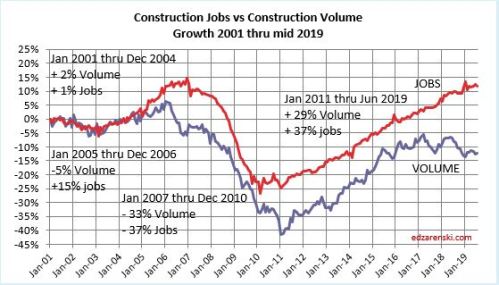
8-3-19 > added plot > Plot below shows the same data as the above two plots, only plotted monthly, with all data from 2001 thru 2019 on one plot. From 1991 to 2000, jobs vs volume disparity was only 1%. This plot sets Jan 2001 to zero baseline for both jobs and volume. By Dec 2006 the disparity was 20%. This plot shows construction jobs growth vs volume growth now has a wider disparity than Jan 2007 when we were leading into the Great Recession. By far, the largest portion of this growing disparity is residential. In the last 24 months residential volume has decreased by 12% but residential jobs have increased by 7%. To be fair, that doesn’t include some nonresidential jobs that were actually doing residential work.
Construction volume, (spending inflation adjusted to constant $ volume) hit a 3-year low in Dec-Jan.
8-3-19 > added 12 month trailing jobs plot. Jobs growth rate, although showing some minor up months, has been declining since Q3 2018. As of July 2019, the 12 month trailing total of new construction jobs has dropped almost 50% in 9 months. If we maintain the current rate of jobs growth (avg 15k/mo in 2019), within the next three months we will hit a six-year low. I’m expecting growth to slow, so we may hit that six-year low next month, in the August data.

With construction spending in 2019 predicted up only 2%, and forecasting 4.5% construction inflation for 2019, real volume for 2019 will be down 2.5%. Jobs thru April are already up 1.2% year-to-date. So the gap is widening.
We are in the third year of no increase in construction volume. But jobs have continued to grow and JOLTS is at an all-time high. These data sets should not occur at the same time. But this is exactly what occurred prior to the great recession after which we experienced a devastating drop in jobs. However, compared to the construction volume measured by inflation adjusted spending, both the changes in jobs and the JOLTS indicator of job openings seemed to lag real activity by about a year.
Even if we do not experience a construction recession similar to 2008-2011, the current situation may be signaling that we could experience a jobs correction with the slightest downturn. If a jobs correction does not materialize then we are headed for a period in which we will solidify the highest ratio of jobs per volume of work put-in-place as measured in the last 50 years.

See also these articles:
Construction Volume vs Jobs 2017-2018
