PPI tables show input costs and final costs monthly to nonresidential buildings and residential. Here I use that information to track year-to-date (ytd). SEE the latest information at the bottom of this post.
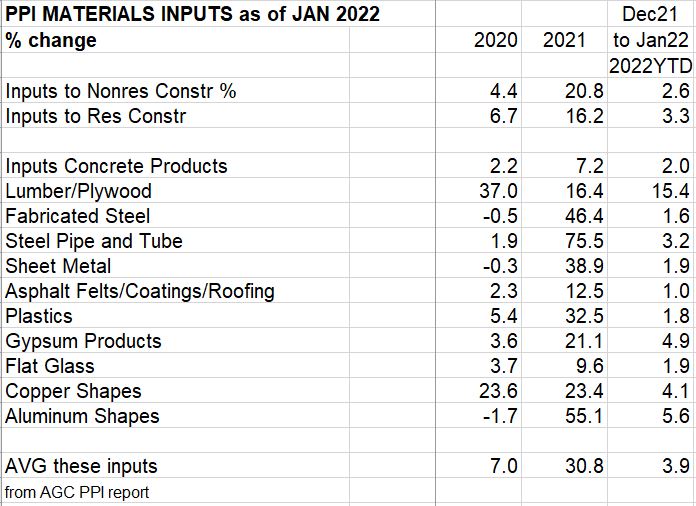
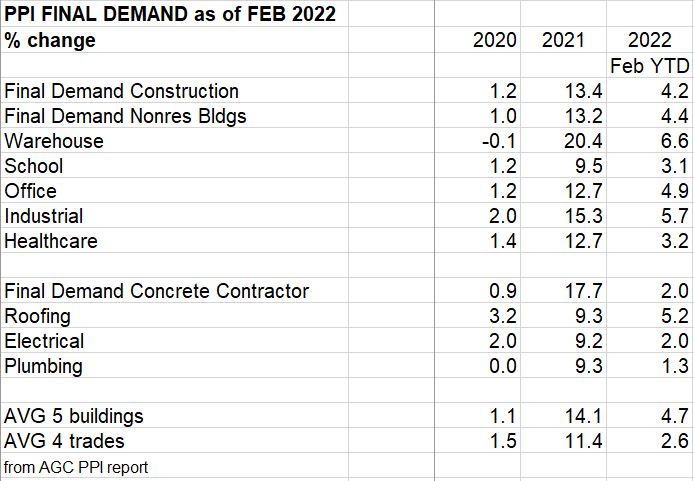
January Inputs PPI is up 2.6% in nonresidential and 3.3% for residential. Most of the inputs reported here are up less than 2% YTD, but Lumber/Plywood is up 15%. Final costs of contractors is up 1% to 5% and final cost of buildings is up 3% to 6%. SEE also Construction Inflation 2022

3-23-22 update Input Costs through February 2022 to nonresidential buildings up 4.5% year-to-date, residential up 6.4%. Inputs to residential went up 3.0% in Feb. In a typical year of 4% inflation, costs would increase only 0.25% to 0.50% per month. Residential is up 6%+ after the first two months! Most of the inputs reported here are up less than 2% for February, except Lumber/Plywood up 4.1% and Aluminum up 6.2%. Year-to-date, for two months, Lumber/Plywood is up 20% and aluminum is up 12.1%. Watch copper, up 4.9% ytd, for potential world situation interfering with supply. Final costs of contractors and final cost of buildings changed very little in February. Range is mostly up 2% to 4% ytd, but up to 6% year-to-date. 4-12-22 edited, corrections.

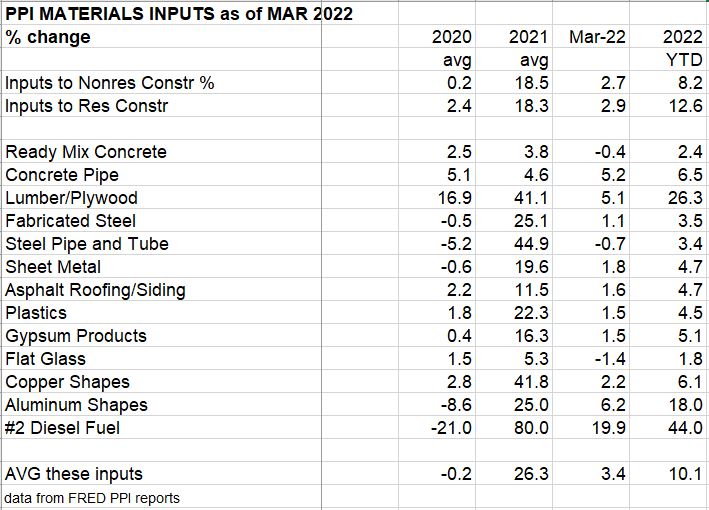
4-13-22 update > Input Costs through March 2022 to nonresidential buildings up 7.5% year-to-date, to residential up 9.5% ytd. In a typical year of 4%-5% inflation, costs would increase only 0.25% to 0.50% per month. Residential is now up 9% after the first 3 months of 2022! Keep in mind when reading these year-to-date (YTD) results, these are cumulative for 1st quarter 2022. That’s not a guess at year end results.
The only inputs reported here up more than 2% for March are Lumber/Plywood, up 5.1%, and Aluminum, up 6.2%. Year-to-date, for 3 months, Lumber/Plywood is up 26% and aluminum is up 19.1%. Watch copper, up 7.2% ytd, for potential world situation interfering with supply. Final costs of contractors and final cost of buildings changed very little in February or March. The final cost average of 5 building types is up 5.2% ytd in the first 3 months of 2022.


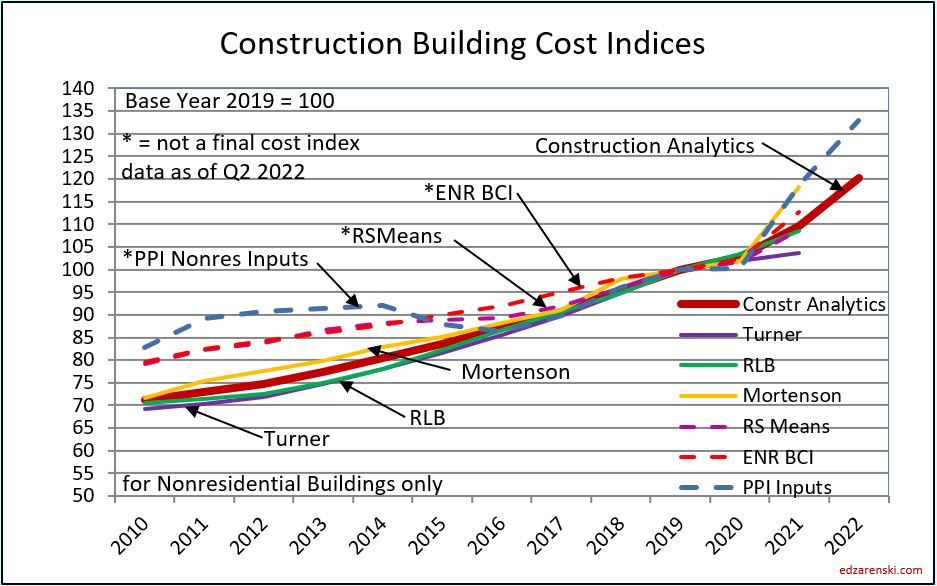
The PPI inputs through the 1st quarter is putting pressure on the nonres bldgs index for 2022 to move higher than forecast.
5-8-22 Correction to 2020 and 2021 Totals
I had taken the 2020 and 2021 totals from the AGC PPI reports. However, all analysis by Construction Analytics reports inflation as the annual average. AGC reports the annual growth as the December value, so compares Dec to previous Dec. That does not represent annual growth. For example, some costs in 2021 maintained a level 3% annual growth rate for 9 months then rapidly increased to 9% in the final 3 months. AGC reports the annual growth at 9%, whereas the annual average is 4%. Inflation rate reporting must be consistent, you cannot mix Dec/Dec and annual average. Therefore, all PPI data has been edited using the original source data from Bureau of Labor Statistics.

5-12-22 Construction PPI for April Construction Inputs post slowest monthly gains so far this year.
Nonresidential Inputs up 0.9% in Apr, up 10.0% YTD. Residential Inputs up 0.8% in Apr, up 15.6% YTD
Final Demand (Selling Price) Nonres Bldgs post strong gains in 1st 4 months, up 4.1% in April, up 9.0% ytd. Warehouses up 12% ytd.


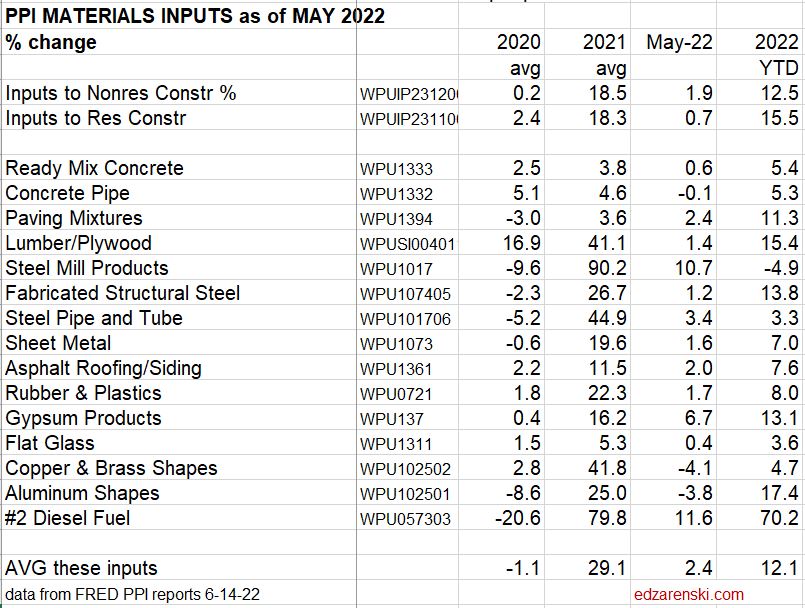
6-14-22 Construction PPI for MAY Construction Inputs to residential post, for second consecutive month, slowest monthly gains so far this year.
May PPI data for construction > Big gainers from 2021 have slowed in 2022, Lumber, Steel, Sheet Metal, Rubber/Plastics, Copper. New gainers in 2022 are Ready Mix Conc, Conc Pipe, Paving Mixtures, Gypsum. We could see the same levels of inflation as last year, just from different products.
Final Demand pricing is updated every 3-4 months. Just had a major revision in April, some items increased by 50-75%. May increases look low, but the next revision month could change that, as did April. Better to look at this indicator quarterly, after the revision month.

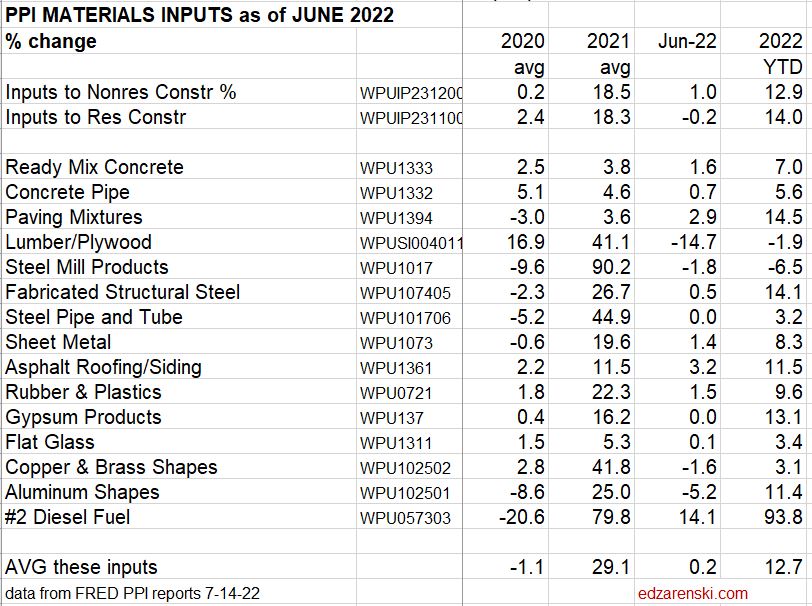
7-14-22 Construction PPI for JUNE Construction Inputs to residential down for thrid consecutive month.
June PPI data for construction > Biggest gain in June is Deisel Fuel, up 14.1%, up 93.8% year-to-date. Biggest decline is Lumber/Plywood, down 14.7% in June, now down 1.9% ytd.
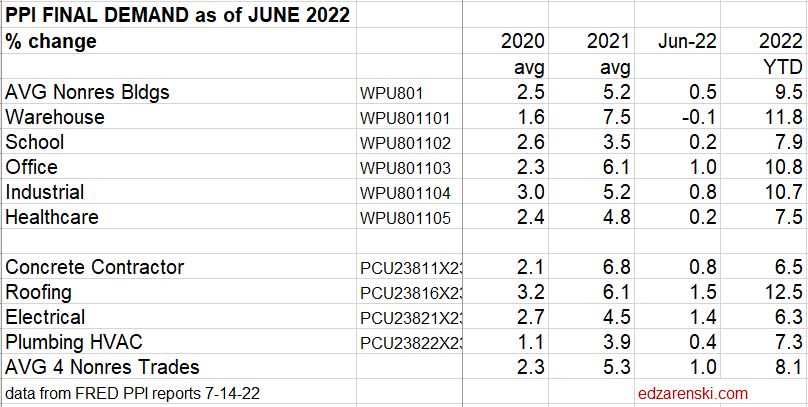
Final Demand (Selling Price) of nonresidential buildings and trades continues to climb, buildings on average up 0.5% in June, up 9.5% ytd, trades up 1.0% for June, up 8.1% ytd.
In this June report, there are many instances where FRED has revised number in previous 2022 months, mostly in the prior two months, but in some cases back to January. So, the year-to-date change from May to June will not match the May ytd previously reported x the June change.
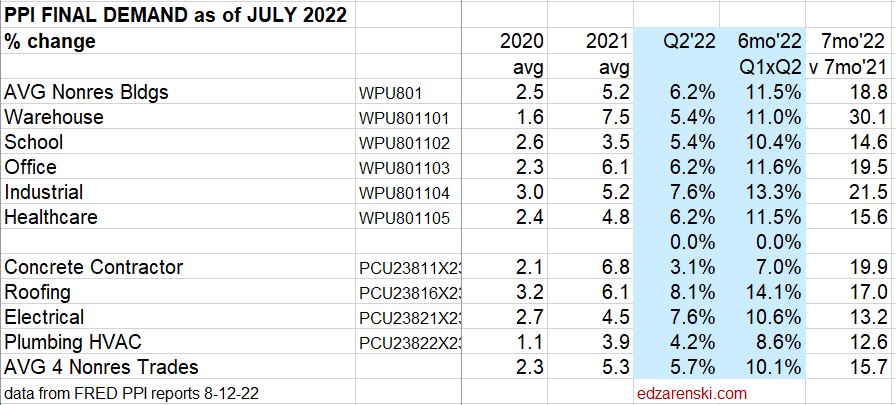
8-12-22 Construction PPI for JULY Construction Inputs to residential down for third consecutive month.
July PPI data for construction > Biggest gainers in July – Ready Mix Concrete posts largest monthly gain of the year, up 2.7%. Now up 9% in 7 months, also up 9.3% compared to same 7 mo 2021. Biggest decliner – Diesel Fuel, down 16% for the month. Now up 62% for first 7mo of 2022, but up 77% compared to same 7mo in 2021.
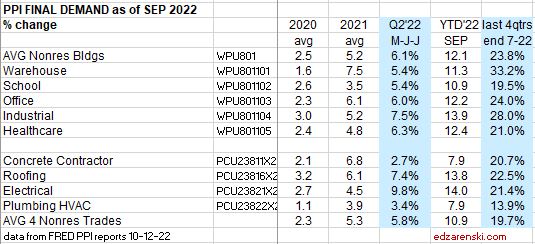
Final Demand (Selling Price) of nonresidential buildings and trades continues to climb, buildings on average up 6.2% for 2nd quarter (M,J,J), up 12% ytd. Trades up 5.7% for Q2, up 12.5% ytd.

Material Inputs PPI represents change in cost of producing those materials. Average material cost is about 50% of final bldg cost. But with several margins tacked on before install, PPI $ represents less than half of final bldg cost, perhaps 40%.
Final Demand PPI, or Selling Price, represents contractors bid price to client. Includes labor, mtrl, equip, overhead and profit. Labor includes change in wages and productivity. Every three months (Jan, Apr, Jul, Oct) BLS performs an update survey to correct these Final Demand indices. For the past three quarterly updates about 80% to 90% of the change in the index was posted in the update month. Therefore, they should not be referenced monthly. These are quarterly indices.
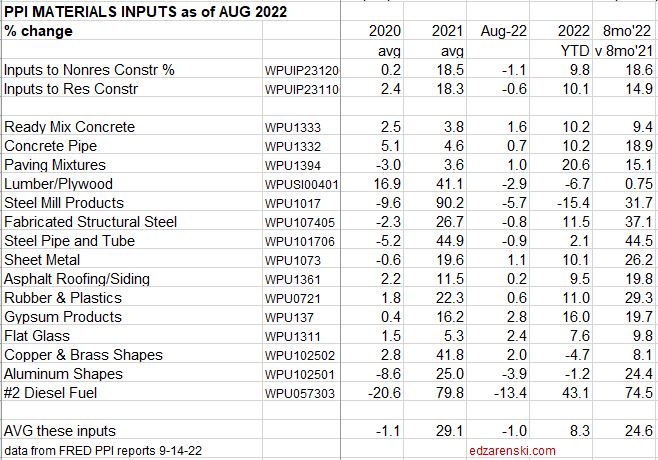
9-14-22 Construction PPI for AUGUST
Construction Inputs to nonresidential buildings dropped for the second consecutive month after posting only a 0.4% increase in June, now down -2.4% for the past three months, but still up 9.8% year-to-date. Residential inputs are down for the fourth consecutive month, down -4.4% since April, up 10.1% ytd. Costs are still high, but are moving in the right direction after 1st quarter costs that averaged +10% to +15%. Historically, most cost increases are posted in the 1st quarter and the least in the 4th quarter.
Average of all inputs for nonresidential buildings is up 18.6% for eight months 2022 compared to the same months 2021. Avg inputs for residential compared to 2021 is up 14.9%
- Ready Mix Concrete, up 7 of 8 months, ytd is up10.2%
- Lumber/Plywood, down 4 of the last 5 months a total 28%, ytd down -6.7%
- Fab Str Steel, down -2.1% the last two months, up 11.5% ytd
- Diesel Fuel, down -28% in last 2mo, up 43% ytd
PPI $ represents less than half of final bldg cost, perhaps 40%.
It will take two more months before we see the effect these changes have on Final Demand PPI, which is updated every three months. Next update is to October data released mid-Nov. Every three months (Jan, Apr, Jul, Oct data) BLS performs an update survey to correct these Final Demand indices. For the past three quarterly updates about 80% to 90% of the change in the index was posted in the update month. Therefore, they should not be referenced monthly. These are acting like quarterly indices.

10-14-22 Construction PPI for SEPTEMBER
Construction Inputs to nonresidential buildings dropped for the third consecutive month after posting only a 0.4% increase in June, now down -3.1% for the past three months, but still up 9.5% year-to-date. Residential inputs are down for the fourth consecutive month, down -6.0% since April, up 8.3% ytd. Several major cost components have been on decline the last few months: Lumber/Plywood, Steel Mill Products, Fabricated Steel, Steel Pipe and Tube, Aluminum and Diesel Fuel. Costs are still high, but are moving in the right direction after 1st quarter costs that averaged +7% (28%annual) to +8%. Historically, most cost increases are posted in the 1st quarter and the least in the 4th quarter.
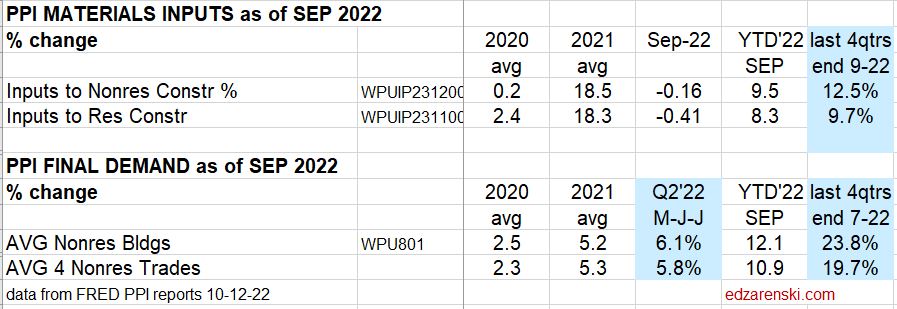
Costs for the last four quarters for all inputs for nonresidential buildings are up 12.5%. Avg inputs for residential for the last four quarters are up 9.7%. The average cost for the last 4 quarters (last 12 months) for the 15 input products I track is up 13.9%.
- Ready Mix Concrete, up 10.7% year-to-date (YTD), up11.6% last 12 months.
- Lumber/Plywood, up 30% in Q1 but down 11.4% ytd, up 9.1% last 12 months
- Fab Str Steel, up 11.2% ytd, up 16.6% last 12 months
- Diesel Fuel, down -17% in 2 of last 3mo, up 60% ytd, up 66% last 12 months
PPI $ represents less than half of final bldg cost, perhaps 40%.

Final Demand PPI is updated every three months. Next update is to October data released mid-Nov when we will see the third quarter, Aug-Sep-Oct, for 2022. Every three months, (Jan, Apr, Jul, Oct data), BLS performs an update survey to correct these Final Demand indices. For the past six quarterly updates about 80% to 90% of the change in the index for the previous quarter was posted in the update month. Therefore, they should not be referenced monthly. Two months are extremely low to the average and the third month is extremely high. Also, the January index is an update month, so most of the index reported that month refers to Nov and Dec, so should not be counted in 2022. Therefore, I chose to report the quarters as reported and updated by BLS. The quarters are FMA, MJJ, ASO, NDJ.
11-15-22 Construction PPI for OCTOBER 2022
Since June, PPI Input costs have been in decline. However Final Demand costs lag and have not posted any declines in at least the last 6 quarters.
Construction PPI Data for Oct’22 > Inputs to Nonres Bldgs UP 9.5%ytd, 12.4% last4qtr. Inputs to Rsdn UP 7.6%ytd, 9.2% last4qtr
FRED corrects Final Demand values quarterly, Jan,Apr,Jul,Oct. Oct value corrects entries for Aug&Sep. Most recent qtr lowest in last4qtrs.
Final Demand PPI is updated every three months. October Final Demand data released mid-Nov represents the correction value for the third quarter, Aug-Sep-Oct. Every three months, (Jan, Apr, Jul, Oct data), BLS performs an update survey to correct these Final Demand indices. For the past six quarterly updates about 80% to 90% of the change in the index for the previous quarter was posted in the update month. Therefore, they should not be referenced monthly. Two months are extremely low to the average and the third month is extremely high. Also, the January index is an update month, so most of the index reported that month refers to Nov and Dec, so should not be counted in 2022. Therefore, I chose to report the quarters as reported and updated by BLS. The quarters are FMA, MJJ, ASO, NDJ.

12-10-22 Construction PPI for NOVEMBER 2022
Since June, PPI Input costs have been in decline. However Final Demand costs lag and have not posted any declines in at least the last 6 quarters. PPI Input$ represent only about 30% to 40% of Final Demand cost.
Construction PPI Data for Nov’22 > Inputs to Nonres Bldgs UP 9.2% ytd, 12.5% last4qtr. Inputs to Rsdn UP 8.2% ytd, 9.3% last4qtr.
For the last 6 months Inputs to nonresidential construction are down -3.0% and to residential are down 5.9%.

FRED corrects Final Demand values quarterly, Jan, Apr, Jul, Oct. Oct value corrects entries for Aug & Sep. Most recent qtr lowest in last4qtrs. We will not get another reliable indicator to Final Demand cost until January when FRED will issue the corrections to Nov and Dec.
Final Demand PPI is updated every three months. October Final Demand data released mid-Nov represents the correction value for the third quarter, Aug-Sep-Oct. Every three months, (Jan, Apr, Jul, Oct data), BLS performs an update survey to correct these Final Demand indices. For the past six quarterly updates about 80% to 90% of the change in the index for the previous quarter was posted in the update month. Therefore, they should not be referenced monthly. Two months are extremely low to the average and the third month is extremely high. Also, the January index is an update month, so most of the index reported that month refers to Nov and Dec, so should not be counted in 2022. Therefore, I chose to report the quarters as reported and updated by BLS. The quarters are FMA, MJJ, ASO, NDJ.
PPI TRENDS
A few years back I looked at PPI historical data. This is what I found.
- 60% of the time, the highest increase of the year in the PPI is in the first quarter.
- 75% of the time, two-thirds of the annual increase occurred in the first six months.
- In 25 years, the highest increase for the year has never been in Q4.
- 60% of the time, the lowest increase of the year in the PPI is in Q4.
- 50% of the time, Q4 is negative, yet in 25 years the PPI was negative only four times.
Since the onset of the pandemic, Feb 2020, residential construction inflation is up 33%, nonresidential up 20%. If you are a residential contractor, take 33% off the top of your revenue growth from Feb20 to Nov22. What remains is your business volume growth. Is your business growing?
Current and predicted Inflation rates updated 12-10-22:
- 2020 Rsdn Inflation 4.5%, Nonres Bldgs 2.6%, Non-bldg Infra Avg -0.3%
- 2021 Rsdn Inflation 13.9%, Nonres Bldgs 7.4%, Non-bldg Infra Avg 7.8%
- 2022 Rsdn Inflation 15.4%, Nonres Bldgs 12.2%, Non-bldg Infra Avg 13.6%
- 2023 Rsdn Inflation 6.0%, Nonres Bldgs 4.8%, Non-bldg Infra Avg 4.3%