Construction JOBS continue to creep higher, even when volume is falling. From Apr’22 to Oct’22 jobs increased 1.5% but volume of work dropped 10%. Jobs and volume should track together as seen from 2011 to 2018. Since Oct’22, jobs are up only 2% while volume up 7%. Volume is catching up.
Jobs have been increasing at 3%/year, or approx 200k to 300k jobs per year. In Feb 2020 there were 7.6 million construction jobs. Now there is almost 8.0 million. The average for 2020 dropped 3% or 170k jobs. But we regained jobs at 2.5% growth in 2021, 4.2% in 2022 and so far over 2% in 2023. Now this is interesting, because we did not see an increase in average volume in 2021, 2022 or 2023. In total, jobs are up 4.8% since Feb 2020, while volume of work is down 4.7%.

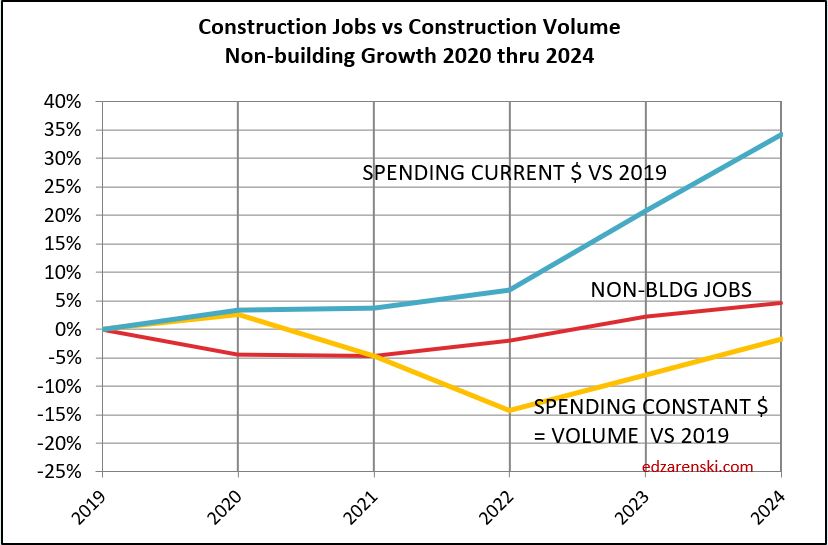
Construction Jobs have been on an even rate of growth approx. 2.5% to 3% per year, even when volume is falling. Spending has been on a bumpy climb, but keeps climbing. Without inflation real volume of work overall since 2020 has not increased at the same rate as jobs.
Current July Jobs are up 1.5% since Dec.’22, up 3% vs the average for 2022. July will be pretty close to the average for 2023. As construction inflation slowed down (has been slowing since mid-2022), volume gained ground on jobs over the last 9 mo., but jobs since Jan 2020 are still 10% higher than volume.
Here’s a look at total jobs just since 2020

Why do jobs sometimes/often grow faster than volume to support those jobs? Some possibilities:
When inflation is unusually strong, business planners may misjudge growth. Planning jobs growth on inflated revenues that net much lower than expected volume may lead to misjudging jobs growth. Result is jobs growth faster then volume.
When volume is decreasing, firms may be reluctant to (or smart not to) let go jobs. See the period on the above plot from Mar 2022 thru Oct 2022. Vol dropped 10%, Jobs increased 2%. So, the calculation shows a big excess in jobs for that period, because volume growth doesn’t support it. Within the next six months, volume increased 7%, making up half the difference.
Here’s jobs vs vol in each sector.
Notice how Rsdn jobs barely declined in 2020, but Rsdn volume increased 10%. Did that set off cries of jobs shortage in Rsdn? Not so in Nonres.

In Nonres Bldgs, volume by 2021 had fallen below growth in construction jobs. The deficit reached its worst in 2022 but in the last 9 months volume growth far faster than jobs growth has evened the balance.

Nonbuilding construction volume fell to a deeper deficit than Nonres Bldgs. But we can see the gap closing as volume increases faster than jobs.
These above three sector plots go back to base 2019, showing how much percent change there has been since 2019. For a longer term look, here below is a plot of Nonresidential Buildings back to 2011. On this plot we can see jobs growth, when compared to 2011, for Nonres Bldgs, is above volume growth since 2017. The low point of volume was in 2021. 2022-2023 has posted the most rapid growth in many years. This closes the gap between Nonres jobs and volume, very helpful to the productivity outlook.

When splitting out jobs by sector we must always remember that some Nonres bldgs jobs actually work on constructing residential buildings (for ex., steel and concrete on a multifamily hirise) but remain counted as nonres jobs. Also, some undocumented workers may not be counted at all in residential jobs. That skews the data plots. But you can see that it would reduce the jobs in Nonres and increase the jobs in residential, improving both plots.
Construction spending data is indicating a slight dip in volume growth over the 2nd half 2023, but then leading into much stronger growth in 2024 in all sectors. Volume by Feb’24 is back to today’s level after falling 5%. I don’t expect jobs to decline with the drop in volume. Maybe slow down. I think at worst jobs hold steady for a few months before resuming 2.5%-3% annual growth later this year.

When jobs continue to increase while volume is dropping, that wrecks productivity. But sometimes volume increases rapidly while jobs grow steady at a 3% rate. Look at the period Oct’22 thru Jan’23. Jobs increased 2%, but volume quickly jumped 6%.

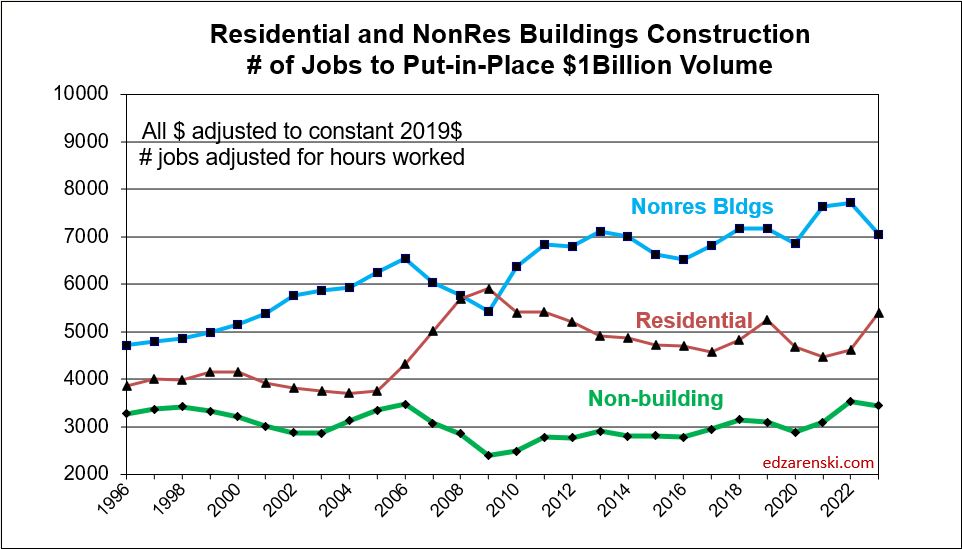
The number of jobs required to put-in-place $1 billion of construction in one year, as plotted below, about 5000 for residential, is the inverse of the plot above, the annual amount of $ put-in-place per job, about $200,000 for residential.

Hi Ed,
We are a small but growing electrical contacting firm solidly rooted in the industrial and infrastructure markets, we presently have $2.7M in our backlog most of it from last year, we anticipated that most of it would be in progress in the first and second quarter of this year but here we are in the 3rd quarter and virtually none of it has materialized yet. To make matters worse, most of it probably will not start until the 4th quarter or into next year. If it is like the last couple of years, we will mobilize and demobilize our workforce several times on each project. Knowing when and how much labor is required at any given time becomes a moving target so our ongoing projects end up with excess labor in anticipation of another project starting or restarting, an obvious impact to productivity. Itâs hard to let a good worker go because they are hard to find. We tend to hang on to them even though we know it will affect our profit.
Anecdotally, the construction workforce is growing older and during and after covid many older workers retired if they could afford or moved on to less vigorous pursuits leaving a large knowledge and leadership gap in the industry which affects productivity.
We are now adjusting our estimates to allow for these inefficiencies. I expect at some point that equipment lead time issues will ease and the workforce will gain knowledge; in years not months bringing jobs and volume back into parity. Or a deep prolonged economic downturn that all the thought leaders say will not happen happens and resets the industry. There will be a point where buyers of construction start to balk at the cost and not build or pivot and do something different.
The first paragraph is firsthand experience the rest is an educated guess. I know that some of our larger contractor customers are having similar problems but I do not think it effects them as much. I wish I had more time to research the data for this email.
I look forward to receiving your emails. Keep up the good work.
Regards,
Steven Geisler Sr. PMP
Vice-President/PM
[Durhamelectricincorporated email]
LikeLike
It would be interesting to have a discussion on the reasons that it now takes 30% to 40% more jobs (compared to 1996) to put-in-place $1B in volume in res and non-res construction. But non-bldg remains rather steady. Is productivity really that much worse? Where is the productivity impact of all the technology that’s been introduced? For someone that likes technology, these statistics are a head-scratcher.
LikeLike