2-20-18 original post
Feb 2019 Tables and Plots updated to end of 2018
Here’s the link to the June 2019 data
Here’s a link to the AGC APRIL 2020 summary report.
Producer Price Index of Materials Inputs to Construction. The 1st two plots are PPI Final Costs which includes all overhead and profit as sold. All other plots are PPI Input costs. Changes in PPI Input costs at the producer level may not reflect changes in actual pricing to contractors or changes in final cost as installed to building owner. Input Costs do not reflect retail markup or mark down and do not reflect overhead and profit markups that may change according to market activity.
PPI for Construction Inputs IS NOT a direct indicator of construction inflation. It does not represent selling price, the final cost of materials put-in-place which includes cost of labor, overhead and profit. See below link to description of Ovhd&Profit.
Cautions When Using PPI Inputs to Construction!
PPI Inputs and Inflation not only can vary widely but also may not even move in the same direction. See the above link for a table comparing PPI% vs Inflation%.


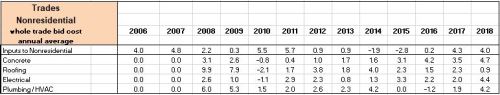
PPI Nonresidential Building Types
PPI Nonresidential Building Construction Sector — Contractors
Specific Building and Contractor PPI Indices are Final Demand or Selling Price indices. They are plotted above.
Bureau of Labor Statistics Producer Price Index measures PPI cost of materials price at producer level. The PPIs that constitute Table 9 of the BLS PPI Report measure changes in net prices for materials and supplies typically sold to the construction sector, but do not represent the final cost installed. They are known as PPI Inputs. They are plotted below.
PPI Materials and Supply INPUTS to Construction Industries
Here’s a brief summary of some of the PPI statistics tracked here:
- One year (2018) change
- biggest increases > Steel Pipe and Tube 21%, Fabricated Steel for Bridges 15%, Ornamental Metals 12%, Fab Structural Steel for Buildings 12%
- biggest declines > Copper and Brass shapes -6%, Lumber and Plywood -4%
- PPI Final cost of buildings and Trades up 4% to 6%
- Final cost of buildings posted largest increases since 2008.
- Final cost of trades (except for Roofing) posted largest increases since 2009.
- Steel Products posted largest increases since 2008
- Lumber and Plywood, which had risen dramatically (+30%) earlier in the year, now down 4% from Dec ’17
- Two year (2017+2018) changes
- biggest increases > Diesel fuel 45%, Steel Pipe &Tube 31%, Aluminum Shapes 16%, Fabricated Structural Metal for Buildings 16%, Ornamental metals 16%
- no declines over a two year period
Most stable pricing over last 5 years, these items did not change by more than 5%/yr in any given year during the last 5 years and net the smallest total change for 5 years: Concrete Brick and Block, Concrete Pipe, Ready-Mix Concrete, Plastic Products, Insulation, Fabricated Steel Plate, Sand/Gravel/Crushed Stone.


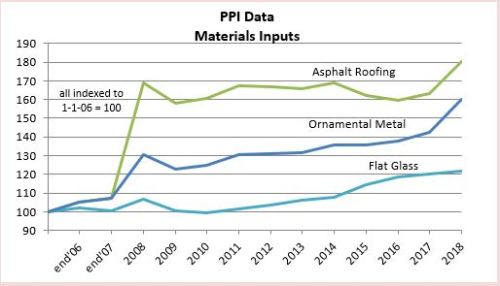

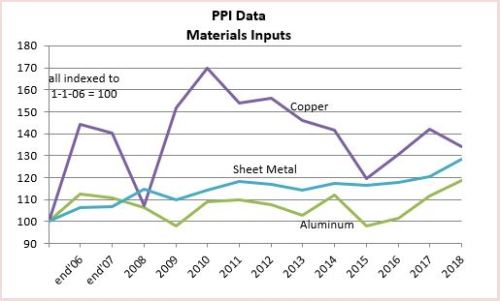
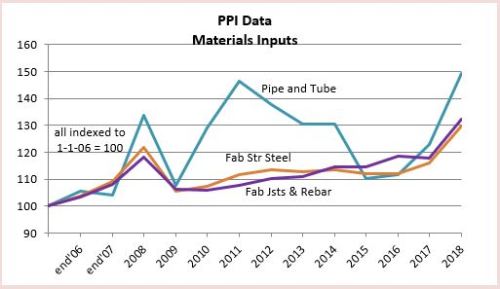
The Materials Inputs indices plots above are generated by indexing the December to December percent changes in the table below. Data updated to include Dec 2018 published January 2019.


Each month, @AGCofA @KenSimonson puts out tables and explanation of recent changes in producer price indexes and employment cost indexes for construction materials inputs, and building types and subcontractor final demand cost. Best source available. Watch this AGC page for monthly updates to the PPI
Here’s the link to the June 2019 data
