9-26-17
Construction Starts and Spending trends may not be apparent unless you look deep into the last few years of data.
Construction spending is strongly influenced by the pattern of continuing or ending cash flows from the previous two to three years of construction starts.
Current month/month, year/year or year-to-date trends in starts often do not indicate the immediate trend in spending.
Power market starts and spending provides a good example. Power starts peaked in 2015 at an all-time high, up 142% from 2014 and more than the prior two years combined. Yet Power spending was down 6% in 2015 and up only 3% in 2016. This happened because Power starts were also at an all-time high in 2012, just below the 2015 level, and those starts drove 2014 spending to an all-time high, but then tapered off in 2015. Those peak starts from 2015 will still be contributing spending for several years to come, long beyond typical jobs, and that drives up typical spending growth because it adds more than typical number of months that contribute spending.
Power starts dropped 11% in 2016 and continue to drop in 2017. Year-to-date and year over year comparisons to 2016 show Power starts down in all respects. For the 1st six months of 2017, Power starts are down four out of six months compared to same month in 2016 and year-to-date through June is down a total 20%.
Even though Power starts have been declining since the 2015 high point, Power had several periods with an exceptionally high value of new starts, some of these periods 2x to 3x the normal rate of growth and a year or two longer duration than typical; late 2014, Jan-May 2015, Feb-Jun 2016 and again in Feb-Jul 2017. When we have old, long duration jobs that are still contributing to monthly spending, spending goes up. A large share of the cash flow or monthly spending from all those exceptional starts will occur in 2018 and 2019. Those jobs will elevate Power spending 15% to 20% in 2018 and also in 2019.
- Pattern of cash flows from construction starts is indicating substantial acceleration in spending over next six months in all sectors, perhaps most notable in infrastructure.
- Infrastructure jobs from 2014 with longer than average duration will continue into 2018. These break the average balanced cycle of one month of old jobs ending for every new month of jobs starting. That will increase spending in 2018.
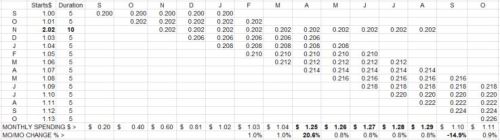
This simplified example shows what happens to monthly spending growth when a long duration job first influences spending past the typical duration and then when it ends. In the example here, starts grow at 1% per month and have a typical duration of 5 months. One month has an unusually large project start that will last for 10 months. A typical month of spending has cash flow from 5 months of starts, but the long duration project creates 6 months of cash flows for the period beyond typical duration.
Notice what happens and when it occurs. When the large project starts it has no unusual affect on spending. When it first extends beyond typical duration, it has a massive +20% growth effect on spending, even though starts had only been increasing at 1%/month for the previous 5 months. When it ends it has a similar downward effect, again, even though starts had been increasing at 1%/month.
Spending growth (or declines), both when an extra large job causes it to increase and then when the extra job ends, is almost entirely influenced by the long duration project, not by normal monthly starts growth rate.
2017 construction spending is expected to approach $1,250 billion, up 6% from 2016. Average annual rate of spending is going to increase 5% from $1,240 to $1,300 at year end. I wouldn’t be surprised to see future revisions to Mar-Apr-May spending smooth out that erratic period and add to total $ 2017.
- All sectors have already hit spending lows for the year and will increase 4% to 8% over the next six months.
- Infrastructure will finish the year with totals down 2% to 3%, but the annual rate of spending could potentially increase 8% from July to year end. 2018 shows 10% growth.
- Nonresidential Buildings are up 4% in 2017, the sixth consecutive year of growth. For 2018 expect 8% growth.
- Residential spending will be up more than 10% for 2017, the sixth year over 9%. Spending growth in 2018 slows to 5%.

2017 construction starts through August total $482 billion, down 1% compared to revised 2016. If 2017 gets revised as expected, even by only 4%, it will show +3% growth over 2016, but we won’t see that growth in the data until next year.
- Starts revisions for the period 2008-2015 averaged +5.8%/yr. For the period 2012-2015 revisions averaged +4.0%.
- The smallest revision to starts data since 2008 was +3.5%/yr. 2016 year-to-date through August revisions are +11%.
- Previous year starts are always revised upwards. Therefore, current year starts year-to-date growth is always understated.
- Starts have been increasing at an average rate of 11%/year for the last 5 years.
- After revisions, I expect 2017 will be the highest amount of new construction starts in 13 years.
Manufacturing spending was expected to fall in 2017 after peaking in 2015 from massive growth in new starts in 2014. However, a few months of exceptional 2015 starts will elevate 2018 spending and late 2016 starts will elevate 2019 spending.
Office spending, down slightly (temporarily) due to timing of completions from old jobs, is on track to reach 10% growth in 2017. Starts have been increasing since 2010 with the strongest growth period of new starts from Sept 2016 through June 2017. So, for the next 10 months we may see year/year comparisons negative, but that high volume of starts from Sept 2016 to June 2017 is going to elevate spending in 2018 and 2019.
Commercial spending early reports for June and July are both well below that predicted by starts cash flows and may be prone to substantial revisions. Commercial spending revisions have been up 17 of last 18 months an average of 6.0%/month. (10-2-17 Commercial spending was revised up by 4% for both June and July) Commercial starts have been increasing every year since 2010.
Educational has seen a slow but steady growth in new starts since 2012. Current dip in spending are not expected to continue. Cash flow from starts is indicating a steady climb in spending from now through the end of 2018.
Healthcare starts from 2015 are ending unevenly, rather than smoothly, causing temporary dips in spending. Growth resumes by Sept-Oct.
Transportation Terminal starts in the first three months of 2017 were more than three times higher than any three-month period in the previous five years. While this helped turn 2017 spending positive, 2017 is still affected by uneven starts from two to three years ago holding down gains in the 2nd half. Transportation will show only a 1% gain in 2017 but double digits gains in 2018. The high volume of 2017 starts has the most affect on 2019 spending.
Highway spending in 2018 will benefit from a scenario exactly as described above in the cash flow chart. Projects that started in 2015 but that have unusually long duration will contribute spending in 2018 beyond the duration that typical projects have ended. It is not recent new starts but old ongoing projects that will increase 2018 spending by 6%.
Public Works cash flow from starts has been indicating declines in spending since last summer. In fact, declines in public works spending (down 20% YTD in Sewage Waste Disposal) is the biggest drag on Infrastructure spending in 2017. However, now spending declines are expected to turn to growth in the 2nd half 2017 and continue growth through 2018.
(This analysis does not include any spending projections from an infrastructure investment bill).
See August Construction Spending 10-2-17 for more trends in spending.
See Starts Trends Construction Forecast Fall 2017 11-8-17 for updated trends in New Starts.
See Backlog Construction Forecast Fall 2017 11-5-17 for updated trend in Starting Backlog for 2018
